

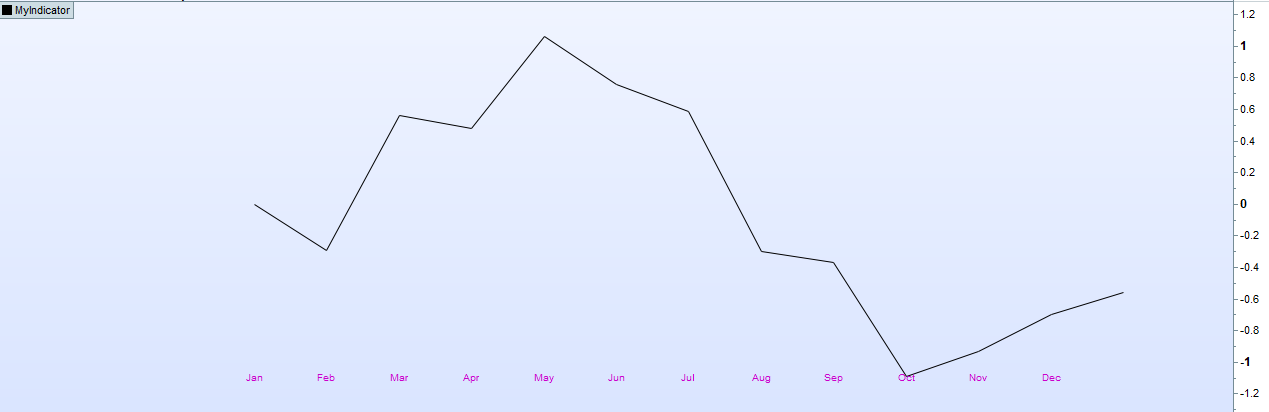
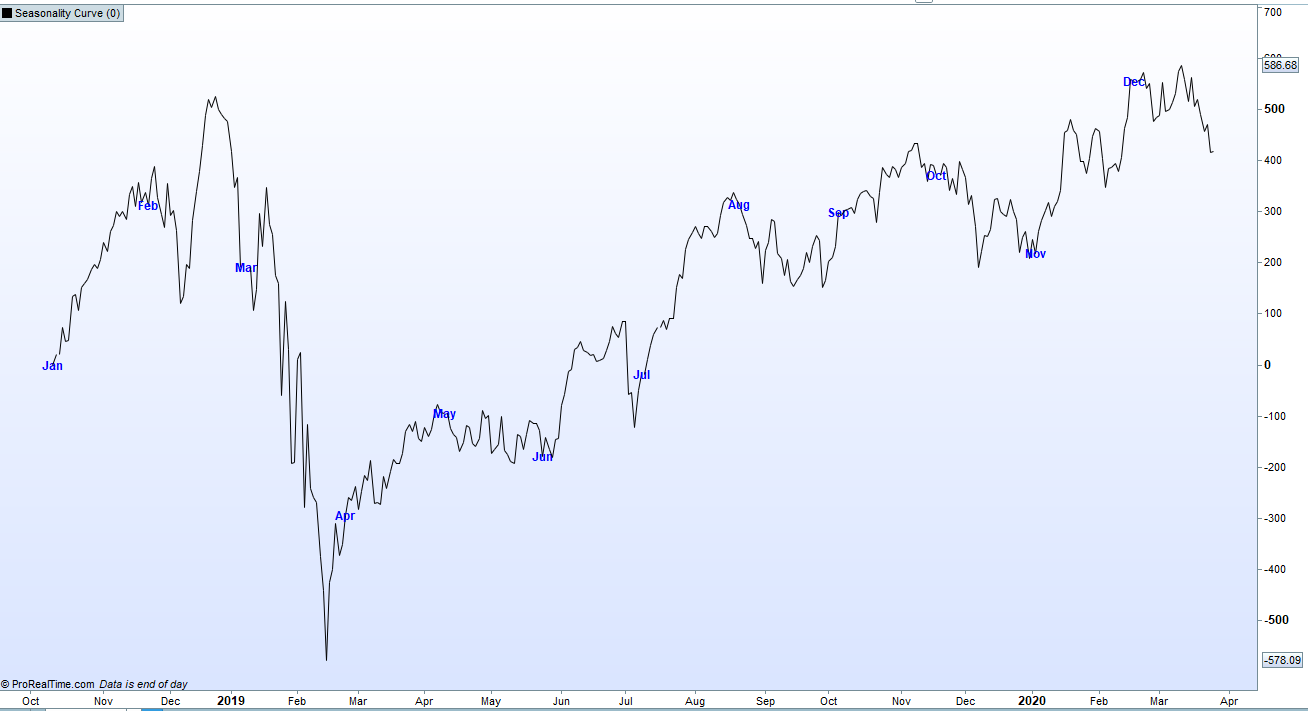
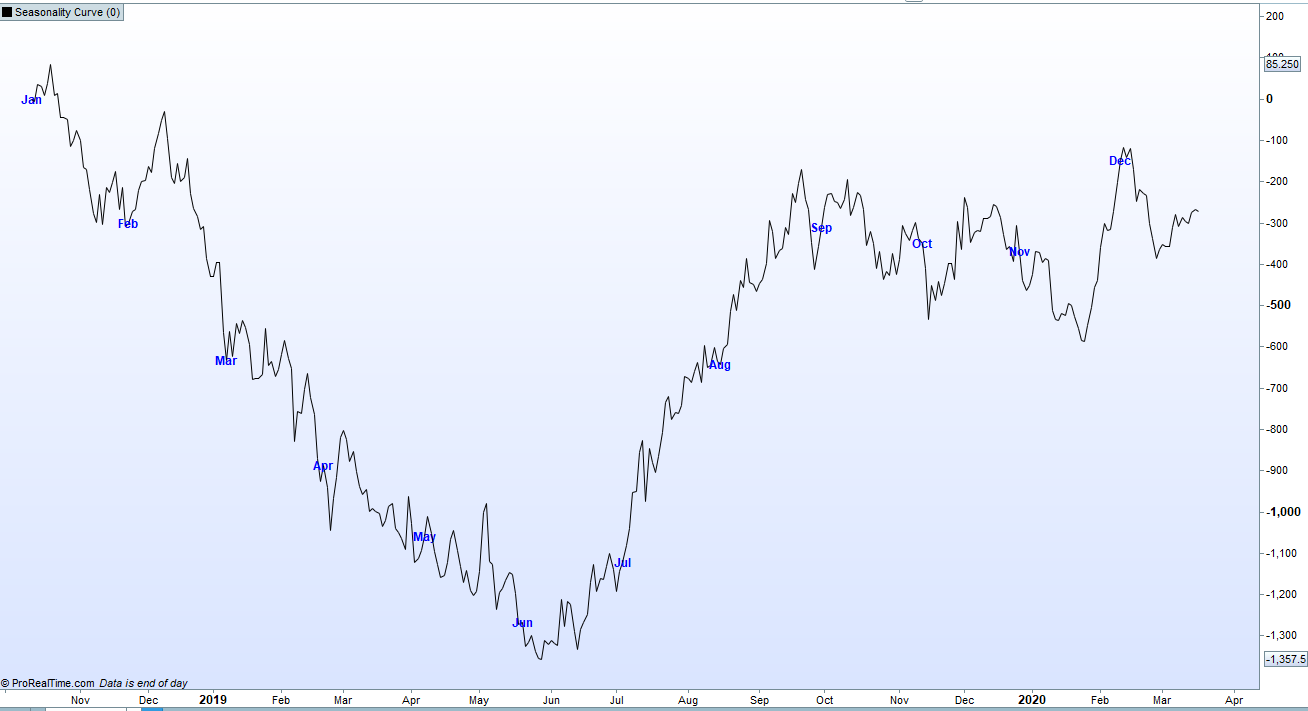
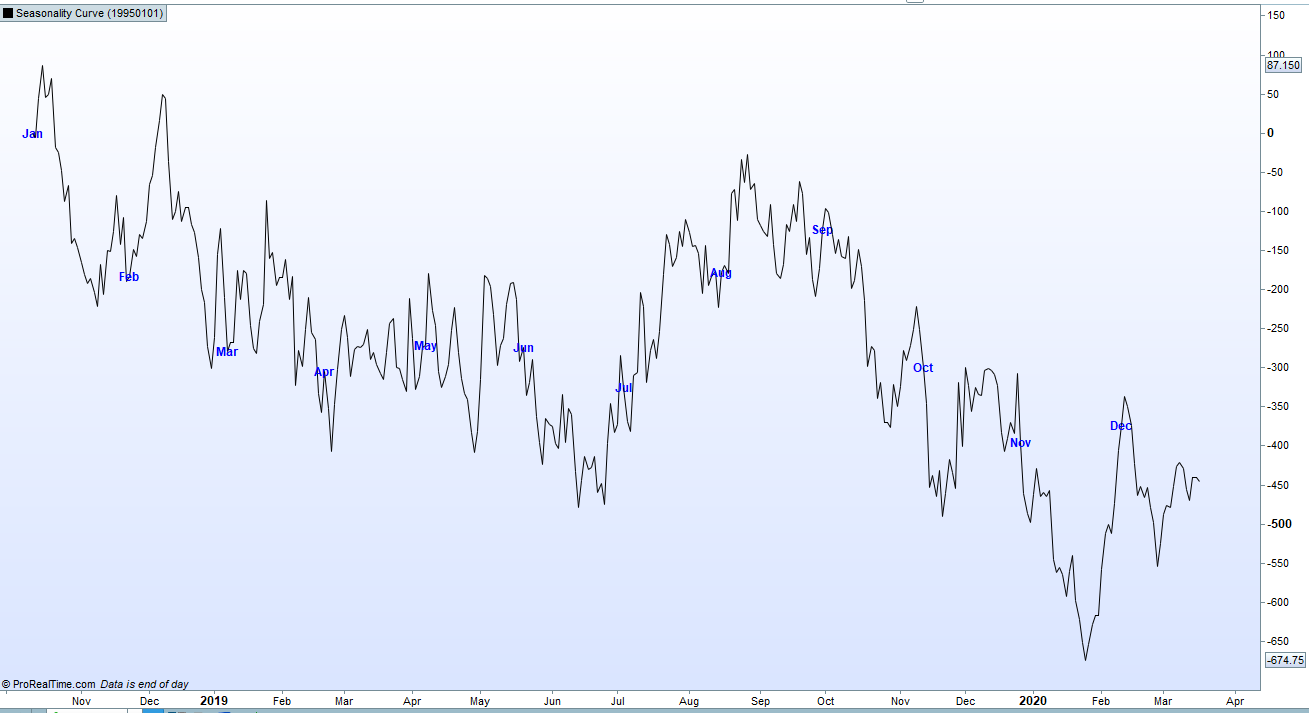
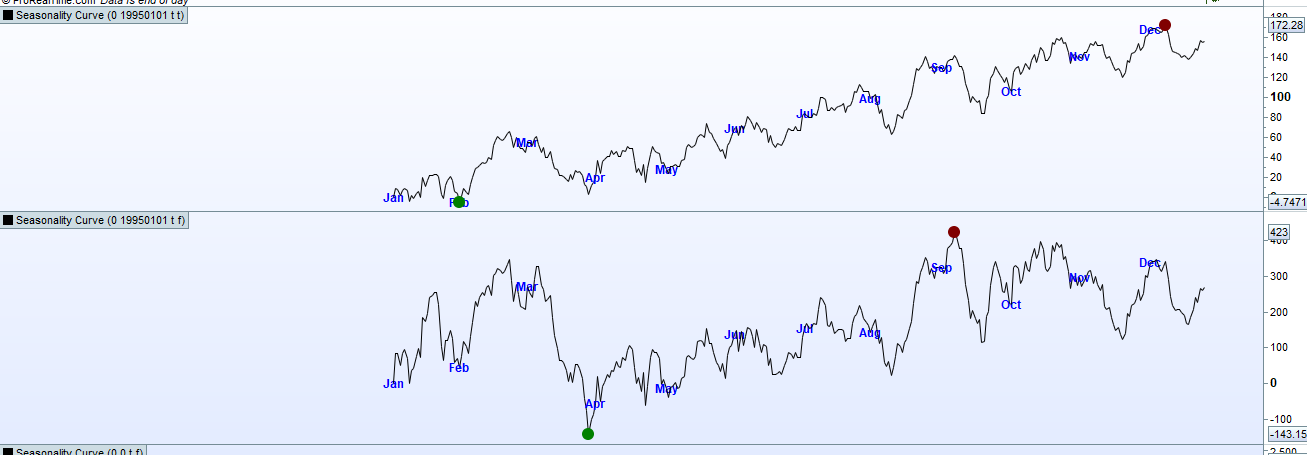
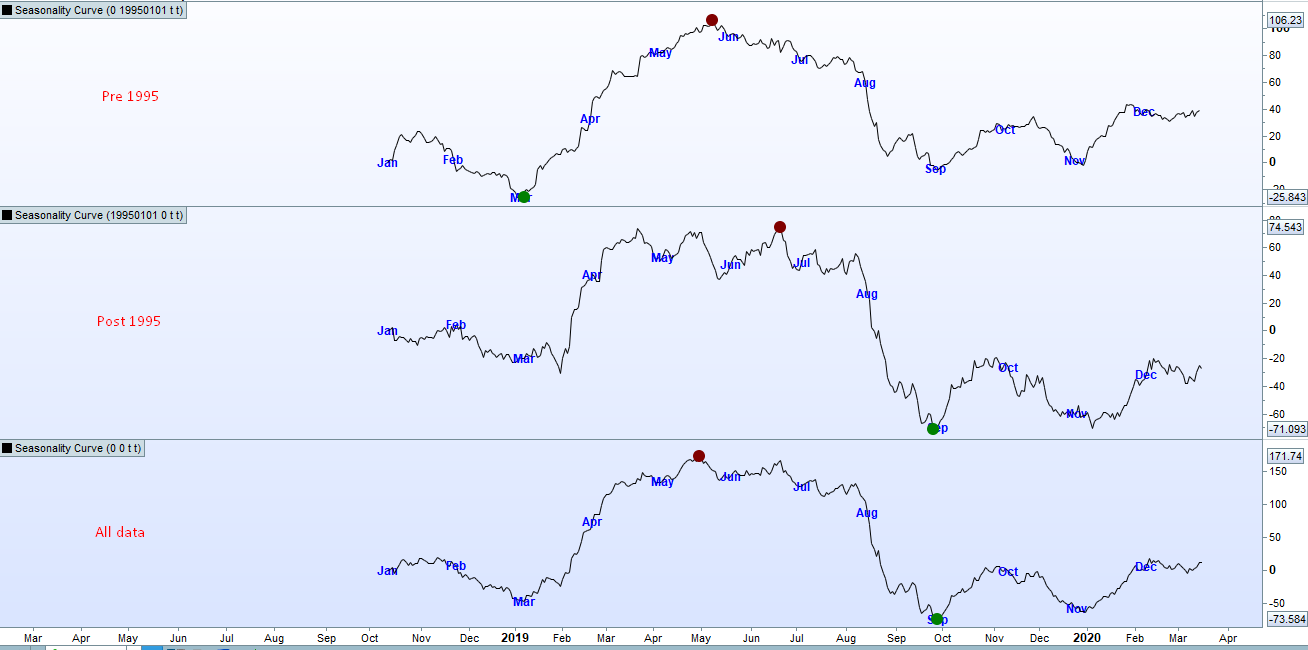
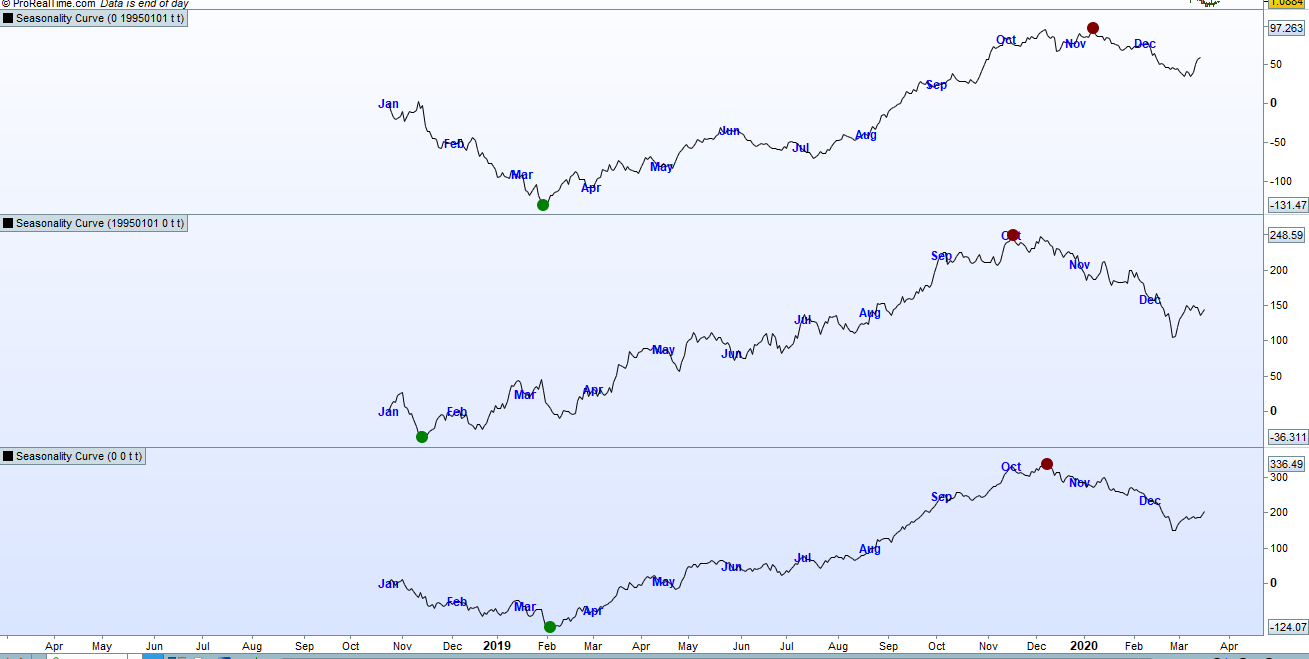
Seasonality Curve using arrays.
Viewing 13 posts - 1 through 13 (of 13 total)
Viewing 13 posts - 1 through 13 (of 13 total)
- You must be logged in to reply to this topic.
New Reply
Summary
This topic contains 12 replies,
has 2 voices, and was last updated by ![]()
4 years ago.
Topic Details
| Forum: | ProBuilder: Indicators & Custom Tools |
| Language: | English |
| Started: | 03/03/2020 |
| Status: | Active |
| Attachments: | 11 files |
Loading...