Hi All,
i would like to ask for a code assistance.
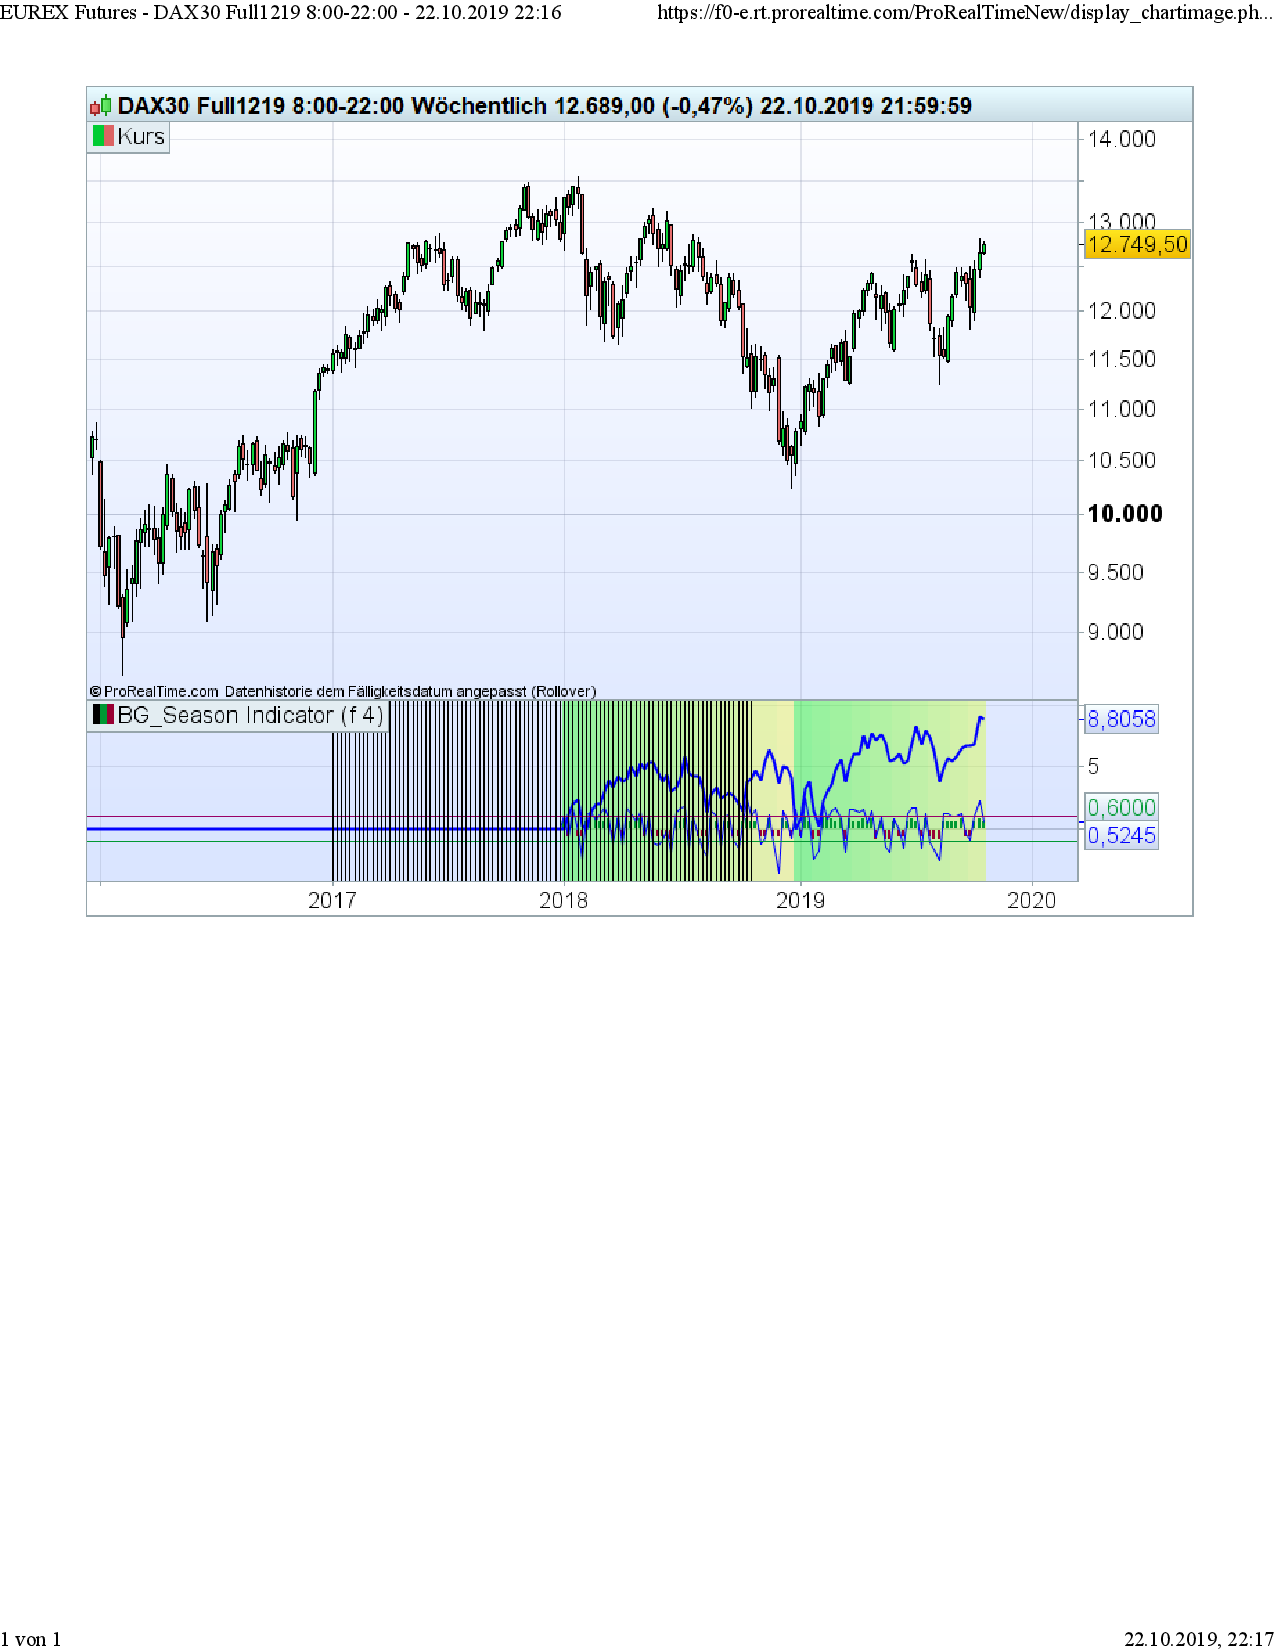
The attached code shows the seasonal behaviour
– quantity of up /down weeks from year to year in % (Histogram 1=100%)
– price percentage of the up /down weeks in %
– SumUp percentage of Price changing from Jan to Dec.
- I would like to know how to code the vertical line shown 52 weeks ago from todays date without showing the vertival lines to the left.
How to eliminate the additional vertical lines to the left?
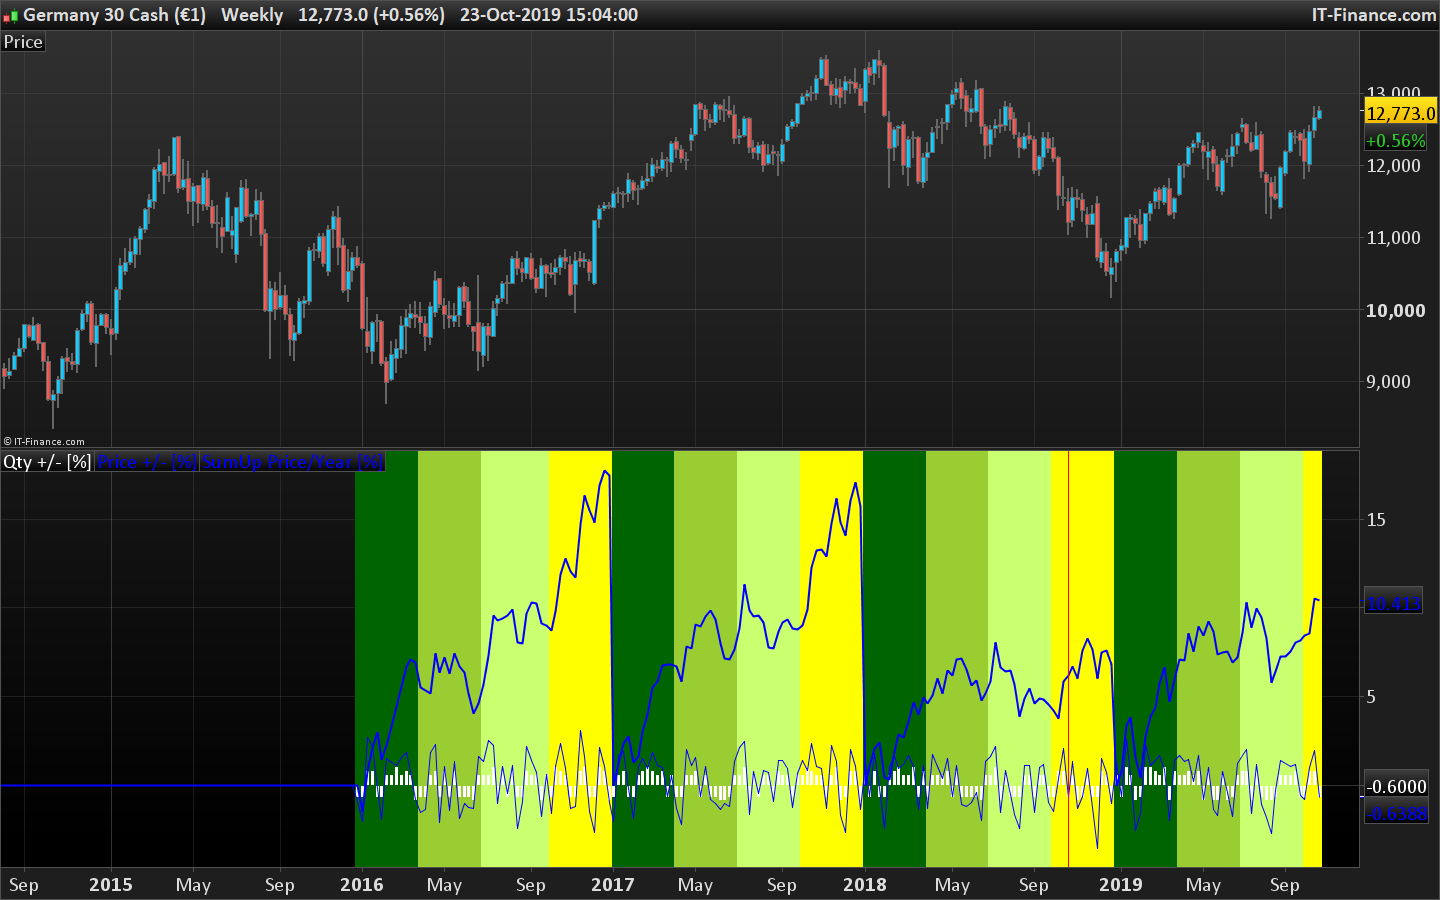
- Is it possible to change the background colour all 3 monthy repeating every year.
For example:
2018, Jan-Mar= dark green, Apr-Jun=mid green, Jul-Sep=light green, Okt-Dec= yellow
2019, Jan-Mar= dark green, Apr-Jun=mid green, Jul-Sep=light green, Okt-Dec= yellow
– How is it possible to eliminate the fix variable of 2018 at the if loop at the beginning?
Many thanks for your support in advance.
Best Regards
Hasardeur
// monthly1     = false (in weekly chart=false, in monthly chart=true)  // variable boolean
// LookbackYear s= 4

SumTot= 0
SumPos= 0
SumNeg= 0
//AvgTot= 0
nPos  = 0
nNeg  = 0
Pb    = 0


LookBackYears= MAX(1, MIN(LookBackYears, 25))
IF monthly1 THEN
t= 12                                           // look back period for monthly chart
ELSE
t= 52                                           // look back period for monthly chart
ENDIF

IF Year >= 2018 THEN
FOR m=0 TO LookBackYears DO
REM cslculate positive/Negative months/weeks
i= m*t
SumTot= SumTot + (close[i]-open[i])/open[i]*100     // SumUp all (+/-) percentage
IF (close[i]-open[i]) > 0 THEN
nPos= nPos+1                                       // SumUp positive months/weeks
SumPos= SumPos + (close[i]-open[i])/open[i]*100    // SumUp positive price percentage
ELSE
nNeg= nNeg-1                                       // SumUp positive months/weeks
SumNeg= SumNeg + (Close[i]-Open[i])/open[i]*100    // SumUp negative price percentage
ENDIF
NEXT

REM calculate average
nYears= (LookBackYears+1)
If Year[1]<Year Then
AvgTot= 0
ELSE
AvgTot= AvgTot + SumTot/nYears
Endif
// total average price of pos/neg months/weeks
IF (nPos/nYears) > 0.5 THEN
Pb= nPos/nYears                                    // percentage of pos monts/weeks  (+1=100%)
Avg= SumPos/nYears                                 // average price of pos months/weeks
ELSIF (nPos/nYears) < 0.5 THEN
Pb= nNeg/nYears                                    // percentage of neg monts/weeks  (-1=100%)
Avg= SumNeg/nYears                                 // average price of neg months/weeks
ELSE
Pb= 0
Avg= SumTot/nYears                                //average price of 50% pos/neg months/weeks
ENDIF

If date > today-t Then
DRAWVLINE(barindex-t)                              // vertical line at 0NE look back perid (t) month/week from today on (last bar at the right)
ENDIF
For u=1 to t DO
If month = u THEN
BACKGROUNDCOLOR(255/12*u, 255, 055/12*u,100)    // background coloour (should canging all 3 month)
ENDIF
NEXT
ENDIF

Return Pb STYLE(histogram) as "Qty +/- [%]", Avg coloured(0, 0, 255) as "Price +/- [%]", AvgTot coloured(0, 0, 255) STYLE(line, 2) as "SumUp Price/Year [%]"
Here is the modified code. I changed the vertical line color to red, because it was not clearly visible on a yellow background.
You can now choose the first year for the indicator to begin to be plotted in history with the StartYear variable.
defparam drawonlastbaronly=true

monthly1     = 0 //(in weekly chart=false, in monthly chart=true)  // variable boolean
LookbackYears= 4 //
FirstYear = 2016 //first year to plot

SumTot= 0
SumPos= 0
SumNeg= 0
//AvgTot= 0
nPos  = 0
nNeg  = 0
Pb    = 0


LookBackYears= MAX(1, MIN(LookBackYears, 25))
IF monthly1 THEN
t= 12                                           // look back period for monthly chart
ELSE
t= 52                                           // look back period for monthly chart
ENDIF

IF Year >= FirstYear THEN
FOR m=0 TO LookBackYears DO
REM cslculate positive/Negative months/weeks
i= m*t
SumTot= SumTot + (close[i]-open[i])/open[i]*100     // SumUp all (+/-) percentage
IF (close[i]-open[i]) > 0 THEN
nPos= nPos+1                                       // SumUp positive months/weeks
SumPos= SumPos + (close[i]-open[i])/open[i]*100    // SumUp positive price percentage
ELSE
nNeg= nNeg-1                                       // SumUp positive months/weeks
SumNeg= SumNeg + (Close[i]-Open[i])/open[i]*100    // SumUp negative price percentage
ENDIF
NEXT

REM calculate average
nYears= (LookBackYears+1)
If Year[1]<Year Then
AvgTot= 0
ELSE
AvgTot= AvgTot + SumTot/nYears
Endif
// total average price of pos/neg months/weeks
IF (nPos/nYears) > 0.5 THEN
Pb= nPos/nYears                                    // percentage of pos monts/weeks  (+1=100%)
Avg= SumPos/nYears                                 // average price of pos months/weeks
ELSIF (nPos/nYears) < 0.5 THEN
Pb= nNeg/nYears                                    // percentage of neg monts/weeks  (-1=100%)
Avg= SumNeg/nYears                                 // average price of neg months/weeks
ELSE
Pb= 0
Avg= SumTot/nYears                                //average price of 50% pos/neg months/weeks
ENDIF

If date > today-t Then
DRAWVLINE(barindex-t) coloured(255,0,0)                             // vertical line at 0NE look back perid (t) month/week from today on (last bar at the right)
ENDIF
//For u=1 to t DO
//If month = u THEN
//BACKGROUNDCOLOR(255/12*u, 255, 055/12*u,100)    // background coloour (should canging all 3 month)
//ENDIF
//NEXT
if month>=1 and month<=3 then
r=0
g=100
b=0
elsif month>=4 and month<=6 then
r=154
g=205
b=50
elsif month>=7 and month<=9 then
r=202
g=255
b=112
else
r=255
g=255
b=0
endif
backgroundcolor(r,g,b)
ENDIF

Return Pb STYLE(histogram) as "Qty +/- [%]", Avg coloured(0, 0, 255) as "Price +/- [%]", AvgTot coloured(0, 0, 255) STYLE(line, 2) as "SumUp Price/Year [%]"
Dear Nicolas,
many thanks for your fast and detailed support.
As I see, I have been close to the solution, the “defparam drawonlastbaronly = true” I have not known.
Thanks again.
Best regards
Hasardeur