Looking at the info we’re given in the detailed report, I’m thinking of a way to combine the relation between those values to arrive at an overall score for any particular backtest.
It has to result in a number where ‘higher is better’, but maybe some factors should be given an additional weighting?
This is my starting point, based on the values I tend to pay attention to:
av.Gain / Av.Loss * %Win * MaxRunup / MaxDD * GainLossRatio / Duration (months)
This would depend on some standardization of position size between instruments based on exposure value (for the DAX, NAS, DJ, SP I use: 0.5, 0.5, 0.2, 1.66 respectively)
What do you think? other factors to consider?
Is such a thing useful? does it mean anything? or too much fussing about ?
If there’s anyone out there with a background in statistics, maybe you know of a better way to construct such a formula ???
That’s avery interesting point which might be worth analyzing in depth.
It’s food for the brain.
Thank you for sharing 🙂
Sounds an extremely useful benchmark measure against which to compare strategies. It is something I’ve attempted using excel pivot tables, but I have to be in the mood for all the faff doing it ‘off PRT’.
Wouldn’t it be fantastic if we had a ‘free text column’ in the Detailed Report where we could enter such formula as you propose above and PRT computed automatically?
The same measure could be applied to bots Forward Tested on Demo / Live Accounts as I find myself all the time saying … “now which of these 25 bots is the best performer today / this week etc”. I know this can be done drilling down in the Detailed Report and taking Notes off several widgets – then compare all 25 bots etc – but it all feels like so much faff doing it this way?
I put in a Suggestion to PRT re adding a ‘Period widget‘ to the Auto Trading Window, but your idea does so much more and is a new exciting step forward!
I reckon we should progress your idea and not worry too much (at this stage) if the formula is the best it can be? We can explore how we would achieve display of the results and if PRT might include in the V12 release … that would be an exciting Christmas present for us all!!?? 🙂
Thoughts (apart from it being a great idea !) :
I think what you’d want to know is the performance per time unit. At least that is how I try to maximise the performance of the AutoTrades. (OT : For example, an extremely deep SL may work out for net result, but only for that trade. Usually not for the overall net result because of the ages it takes to taking profit.)
And thus the exposure amount should be eliminated from the formula**. This in itself means that the invested amount should be linear to the result. At least I think that would be the prerequisite, because obviously (??) we are going to compare our results ? (being anonymous in the money we spend) – If that is too difficult (it is !) then all should be normalised to a standard exposure amount. Thus, we could agree that 1000 is the exposure amount, and if mine coincidentally is 2000 then my “result score” should be divided by 2. To this regard, notice the complication with a loss, because a loss will then also be divided by 2 (and my experience tells me that this is not fair – not at all sure though).
The Duration could be problematic with dozens of trades per day. But then – again – it should be about the performance per time unit.
What could be wrong in my thinking is that I clearly speak “over trades” while you possibly observe one trade only (though not sure). There would also be a problem with running trades (open position) because in my view they just count (sadly PRT statistics don’t understand that), also knowing that for my normal trading I seem to have an iron 30% of gain in the open positions. Thus for example, might PRTs statistics show that I have 30K profit, then I have 10K of additional profit throughout time and PRT statistics thus never show that. This is very significant (for me it is). And if you talk about “months” as the duration unit, in my view it should be about open positions just the same (am I right ?).
**) : Which could be difficult for any formula in general, when the gains are exorbitant.
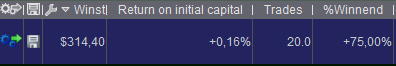
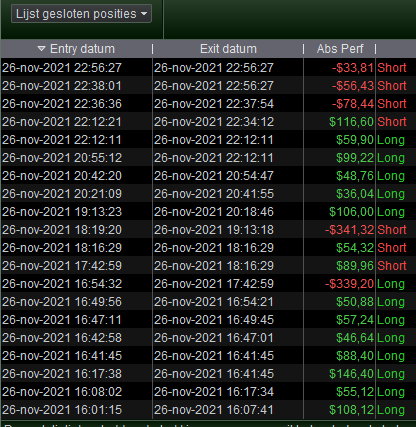
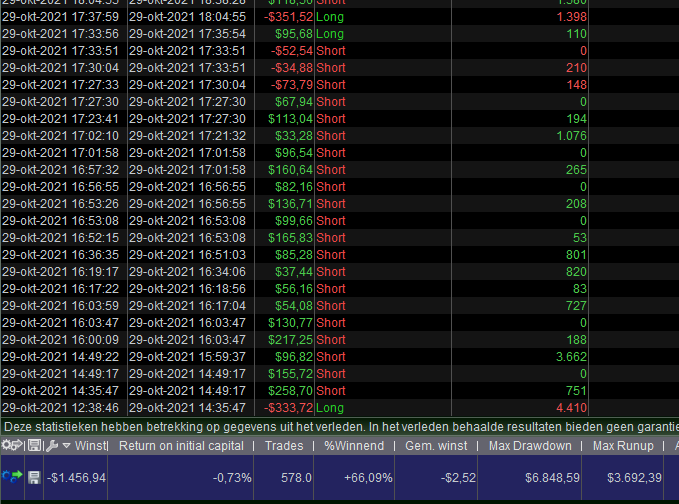
PS: I am staring at what you see in the 2nd attachment – Return on Initial Capital – and wonder whether that already tells all ? –> No, because it does not tell how long it took me to obtain that figure. Thus square that with the duration somehow ?
I will try to work out two examples, based on the “PS” in my previous post. It is just to test whether it would work. In this post the first example :
My exposure is USD 224000;
The attachment shows that the profit of USD 314,40 (including payed spread) was obtained over the period of 7 hours. Thus, 314,40 / 7 = 44,91 per hour.
I need to normalise to a standard exposure amount, which is set to USD 1000. 44,91 / 224 = 0.200491 per hour (per 1000). Thus my score is 0.200491;
Because of the small number, we could work it out per day. Thus x 24 = 4.81178. This looks to be a nice number to work with.
Next example in the next post …
(I don’t want to hijack the thread – it’s just ideas)
Wouldn’t it be fantastic if we had a ‘free text column’ in the Detailed Report where we could enter such formula as you propose above and PRT computed automatically?
yes! i was thinking the same thing. For something like this to be useful it would have to be automated, so you just get the number as a part of the report, relating all the stats.
The Duration could be problematic with dozens of trades per day
I was thinking of the duration of the backtest rather than the trade, eg. looking at the performance of a 1min algo with a 3 year BT compared to a 1 hour algo with a 10 year BT
Normal trading day from yesterday (thus no AutoTrading) :
I multiplied all figures by a consistent though unknown number. But the score figure would be comparable.
Exposure was 390000 (390K);
In this case I’d need to say that the trading day lasts 24 hours, never mind it is not so at all for any equity. The fact that all (USA) closed at 7pm my time (instead of 11pm) should not interfere because it gets too complicated otherwise. Futures, stocks, USA, Europe … thus, 24 hours.
My profit was 1700. This is 70,83 per hour.
The exposure should be normalised to 1000, this 70,83 / 390 = 0.18162 per hour.
Per 24 hours this is 4.35876.
From my previous post :
Thus x 24 = 4.81178.
and I am startled. My Autotrading may outpace me.
The fact that I manipulated the figures twice (one time the multiplier for obfuscation and one time the normalising to 1000 exposure) is not important.
So my score yesterday was USD 4.81178.
BTW in euros (/ 1.12) this would be 4.29623.
I was thinking of the duration of the backtest rather than the trade, eg. looking at the performance of a 1min algo with a 3 year BT compared to a 1 hour algo with a 10 year BT
Clear.
So the 7 hours I showed for a back test of the past month (20 days) comes to
-1456.94 / 224 / 20 = -0.32521 (for a day).
Once we would be used to such a number, we could see that it is quite harmless to have a minus of -0.32521 (it is negative). However, what I would do myself is incorporate the law of large numbers, and somehow integrate the fact that this is over 578 trades, which make the loss diminish. Otoh it would also tell me that large profit is impossible just the same. What it also tells me is that this algo is harmless to run and can be observed in live for improvement.
If this would have been spread over two trades, it would be a dangerous beast. And thus I would incorporate the 578 trades somehow. … Normalise that to 1000 ? maybe.
-0.32521 / 578 * 1000 = -0.56265.
Would this have been 2 trades :
-0.32521 / 2 * 1000 = -162.60500 (ouch – not-dangerous numbers should be between -1 and 1 ?).
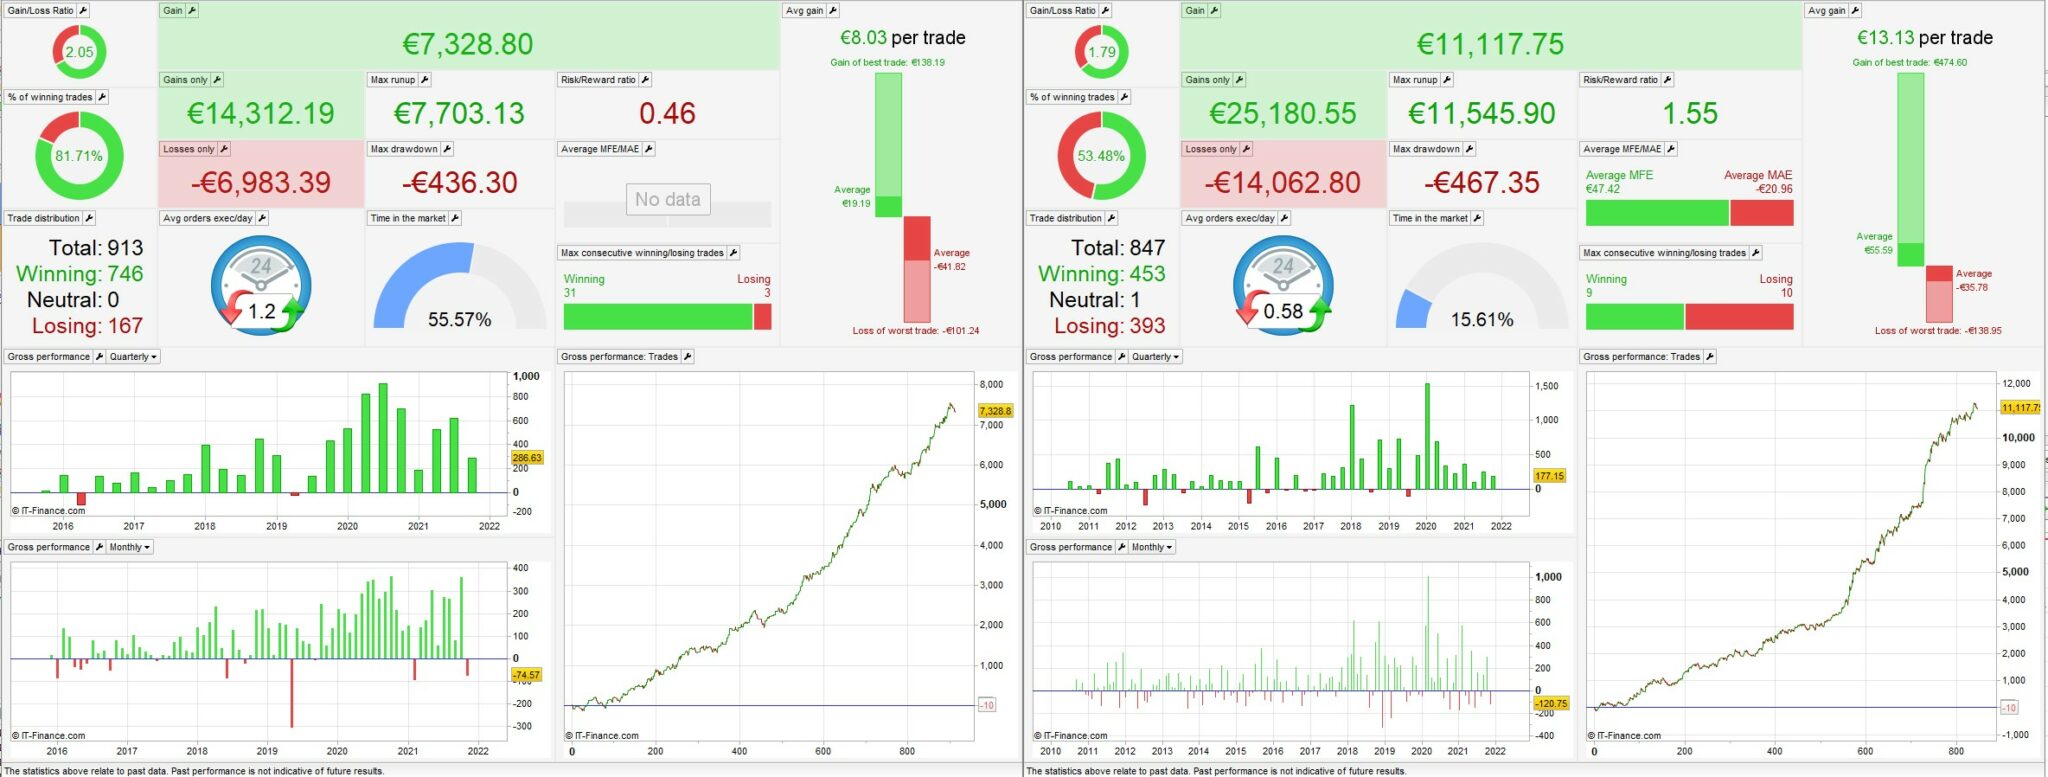
Peter, I think we may be at cross purposes. This is an example of what I had in mind.
The attached image shows the results from 2 different backtests. The one on the left is SP500 with a position size of 1.66, on the right is DJI position size 0.2
The exposure of each is therefore broadly comparable: 4572 x 1.66 = 7589, 34640 x 0.2 = 6928
As we’re dealing with ratios between respective values, the difference in the absolute value shouldn’t be too significant (???)
Based on the above formula, this would give the following scores:
Algo 1: 19.19/41.82 * 81.71 * 7703 / 436 * 2.05 / 72 (months) = 18.86
Algo 1: 55.59/35.78 * 53.48 * 11546 /467 * 1.79 / 137 (months) = 26.84
The score would be an abstract value where higher is better.
(typo: the second calculation is Algo 2, on the right)
According to the orginal formula (I only changed duration in DAYS, but it’s just a timeframe to be changed to use months, weeks, etc…) by nonetheless, I wrote this snippet with an example (let me know if I interpreted the formula incorrectly or you find any error in calculations):
// Rating formula
////////////////////////////////////////////////////////////////////////////////
// https://www.prorealcode.com/topic/scoring-your-report-data/
//
// av.Gain / Av.Loss * %Win * MaxRunup / MaxDD * GainLossRatio / Duration (days)
//
Timeframe(default)
////////////////////////////////////////////////////////////////////////////////
// DrawDown & RunUp
//
ONCE Capital  = 10000
ONCE MinPoint = Capital
ONCE MaxPoint = 0
ONCE MaxRU    = 0
ONCE MaxDD    = 0
//------------------------------------------
//       EQUITY
Equity        = Capital + StrategyProfit
TempProfit    = PositionPerf * PositionPrice / PipSize * PipValue
TempEquity    = Equity + TempProfit
//------------------------------------------
//       DrawDown
MaxPoint      = max(MaxPoint,TempEquity)
DD            = MaxPoint - TempEquity
MaxDD         = max(MaxDD,DD)
DDperc        = MaxDD * 100 / Capital
//
//------------------------------------------
//       RunUp
MinPoint      = min(MinPoint,TempEquity)
RU            = TempEquity - MinPoint
MaxRU         = max(MaxRU,RU)
RUperc        = MaxRU * 100 / Capital
//------------------------------------------
//       DD/RU ratio
DDRUratio     = MaxDD / MaxRU
//------------------------------------------
////////////////////////////////////////////////////////////////////////////////
//       DAY tally
Timeframe(Daily,UpdateOnClose)
ONCE Dtally   = 0
Dtally        = Dtally + 1
Timeframe(default)
////////////////////////////////////////////////////////////////////////////////
//       Winning, Losing and Neutral trades
ONCE Winning  = 0
ONCE Losing   = 0
ONCE Neutral  = 0
ONCE MoneyG   = 0
ONCE MoneyL   = 0
NewTrade      = (OnMarket AND Not OnMarket[1]) OR (LongOnMarket AND ShortOnMarket[1]) OR (LongOnMarket[1] AND ShortOnMarket)
IF NewTrade THEN
   Money      = StrategyProfit - StrategyProfit[1]
   IF Money > 0 THEN
      Winning = Winning + 1
      MoneyG  = MoneyG + Money      //Money GAINED
   ELSIF Money < 0 THEN
      Losing  = Losing + 1
      MoneyL  = MoneyL + Money      //Money LOST
   ELSIF OnMarket AND OnMarket[1] THEN
      Neutral = Neutral + 1
   ENDIF
ENDIF
//
//       %Winning, %Losing trades
TotalTrades   = Winning + Losing// + Neutral     //Neutral trades are ignored
WinPC         = Winning * 100 / TotalTrades
WinPC         = Losing  * 100 / TotalTrades
WinRatio      = Winning / Losing
//
//       GainLoss Ratio
GainLossRatio = MoneyG / MoneyL
////////////////////////////////////////////////////////////////////////////////
PerfIND       =           (GainLossRatio * 1.00)
PerfIND       = PerfIND * (WinRatio      * 1.00)
PerfIND       = PerfIND * (DDRUratio     * 1.00)
PerfIND       = PerfIND / (Dtally        * 1.00)
////////////////////////////////////////////////////////////////////////////////
GRAPH PerfIND
////////////////////////////////////////////////////////////////////////////////
// Example(tested on DAX, 1H, 200K, ranges from -0.00001 down to -0.04641):
//
FastAVG = average[20,0](close)
SlowAVG = average[100,0](close)
IF FastAVG CROSSES OVER SlowAVG  THEN
   BUY AT Market
ENDIF
IF FastAVG CROSSES UNDER SlowAVG THEN
   SELLSHORT AT Market
ENDIF
I added a multipier in lines 74-77 to be able to weigh each parameter differently.
I edited line 57 (but it doesn’t change the output).
 JS
JSParticipant
Senior
@nonetheless First nice idea but when I look at the formula I am not sure what the meaning of your calculation is 🙂
The first term: Average Gain / Average Loss = (already) the Risk / Reward Ratio
Then multiplying the Risk / Reward Ratio with %Winning what does that mean???
When you work this out (Risk/Reward Ratio * %Winning) you get: Average Win * Losing Trades / Average Loss * Total Trades (what is the meaning of that?)
Then multiplying the Risk / Reward Ratio with %Winning what does that mean???
there is a definite relation between these 3 factors. When %Win is high (+80%) then the average loss will also be high (compared to average gain)
An average %win of 50% might look poor, but if the average win is higher than the average loss it still works.
@Roberto, the code looks amazing, thanks for that – I would never have thought of doing it that way. I’ll run some tests as soon as I get the time.
JSParticipant
Senior
What I mean is:
Average Gain = Only Profit / Winning Trades
Average Loss = Only Loss / Losing Trades
%Winning = Winning Trades / Total Trades
When you divide: Average Gain / Average Loss and multiplying it with %Winning then your Winning Trades will fall out (of the equation)
What is left is: Average Gain * Losing Trades / Average Loss * Total Trades (what is the meaning of that?)