Can someone please run this on 200k and share results?
Made this a 30s scalper instead of 10s.
100k results look fine, but seemed a bit overfitted. Would like to see if 200k results comply.
DOW-30S
//-------------------------------------------------------------------------
// Main code : ScalpMaster v3 -
//-------------------------------------------------------------------------
defparam cumulateorders= false
defparam flatbefore= 070000
defparam flatafter= 220000

once longtrading=1
once shorttrading=1

TIMEFRAME(5 minutes, updateonclose)
// Settings
ema1= exponentialaverage[9](close)
ema2= exponentialaverage[2](close)
bullish = close>ema1 and close>ema2 and ema1>ema2

ema1= exponentialaverage[9](close)
ema2= exponentialaverage[2](close)
bearish= close<ema1 and close<ema2 and ema1<ema2


TIMEFRAME(1 minutes, updateonclose)
// Settings
mac = MACDline[12,26,9](close)

bullish1 = mac > 0
bearish1 = mac < 0


TIMEFRAME(30 seconds)

// Indicator
myPivotSupportResistanceZones, myPivotSupportResistanceZones2 = CALL "Pivot Support/Resistance Zones"
//
if longtrading then
// Long
if close crosses under myPivotSupportResistanceZones or close crosses over myPivotSupportResistanceZones2 then

if bullish and bullish1 then
buy 1 contract at market
endif
endif
endif

if shorttrading then
// Short
if close crosses under myPivotSupportResistanceZones or close crosses over myPivotSupportResistanceZones2 then
if bearish and bearish1 then
sellshort 1 contract at market
endif
endif
endif

// Stop Loss
SET STOP %LOSS 1.5


trailingPercent = 0.40
stepPercent = 0.014
if onmarket then
trailingstart = tradeprice(1)*(trailingpercent/100) //trailing will start @trailingstart points profit
trailingstep = tradeprice(1)*(stepPercent/100) //% step to move the stoploss
endif


//reset the stoploss value
IF NOT ONMARKET THEN
newSL=0
ENDIF

//manage long positions
IF LONGONMARKET THEN
//first move (breakeven)
IF newSL=0 AND close-tradeprice(1)>=trailingstart THEN
newSL = tradeprice(1)+trailingstep
ENDIF
//next moves
IF newSL>0 AND close-newSL>trailingstep THEN
newSL = newSL+trailingstep
ENDIF
ENDIF

//manage short positions
IF SHORTONMARKET THEN
//first move (breakeven)
IF newSL=0 AND tradeprice(1)-close>=trailingstart THEN
newSL = tradeprice(1)-trailingstep
ENDIF
//next moves
IF newSL>0 AND newSL-close>trailingstep THEN
newSL = newSL-trailingstep
ENDIF
ENDIF

//stop order to exit the positions
IF newSL>0 THEN
SELL AT newSL STOP
EXITSHORT AT newSL STOP
ENDIF

//************************************************************************


//-------------------------------------------------------------------------
// Function : Pivot Support/Resistance Zones
//-------------------------------------------------------------------------
DEFPARAM CalculateOnLastBars = 1000
PivotBAR     =  3                      //3  bars AFTER  pivot
LookBack     =  4                    //4  bars BEFORE pivot

BarLookBack  = PivotBAR + 1
IF low[PivotBAR] < lowest[LookBack](low)[BarLookBack] THEN
IF low[PivotBAR] = lowest[BarLookBack](low) THEN
MySupport     = BarIndex - PivotBAR
SupportPrice  = low[PivotBAR]
ENDIF
ENDIF
IF high[PivotBAR] > highest[LookBack](high)[BarLookBack] THEN
IF high[PivotBAR]  = highest[BarLookBack](high) THEN
MyResistance    = BarIndex - PivotBAR
ResistancePrice = high[PivotBAR]//high[BarIndex - MyResistance]
ENDIF
ENDIF

DRAWSEGMENT(MyResistance,ResistancePrice,BarIndex,ResistancePrice) COLOURED(255,0,0,255)
DRAWSEGMENT(MySupport,SupportPrice,BarIndex,SupportPrice) COLOURED(0,128,0,255)

RETURN SupportPrice, ResistancePrice
Any improvements are welcome.
Having a couple of days of backtest in addition on those kind of systems is useless; put it on demo forward for some weeks and you’ll have your answers 🙂
Still I think its worth knowing the results of 200k because it a good WF test and prove its worth of putting it demo. 🙂
hello everyone, I tested this strategy for a week on wall street cash ($ 2)(1sec) and I am in profit of around $ 700
here the version of the code that I tested
//-------------------------------------------------------------------------
// Codice principale : 1secondo
//-------------------------------------------------------------------------
//-------------------------------------------------------------------------
// Code principal : CANDLE
//-------------------------------------------------------------------------
Defparam cumulateorders = false

n =1

timeframe(15 minute,updateonclose)
c160m = open > open[1] and close > close[1] and close > open


timeframe(1 minute,updateonclose)
c11m = open > open[1] and close > close[1]
c21m = abs(close-open) >= 17
c31m = abs(close[1]-open[1])
c41m = c31m > c21m

timeframe(default)
c1def = open > open[1] and close > close[1]
c2def = abs(close-open) >= 1


IF not longonmarket and c1def and c11m and c21m and c41m and c2def and c1def and c160m then
BUY N contracts at market
set stop ploss 300
ENDIF

//if longonmarket and close crosses under st then
//sell at market
//endif

//************************************************************************
//trailing stop function
trailingstart = 19 //trailing will start @trailinstart points profit
trailingstep = 7 //trailing step to move the "stoploss"

//reset the stoploss value
IF NOT ONMARKET THEN
newSL=0
ENDIF

//manage long positions
IF LONGONMARKET THEN
//first move (breakeven)
IF newSL=0 AND close-tradeprice(1)>=trailingstart*pipsize THEN
newSL = tradeprice(1)+trailingstep*pipsize
ENDIF
//next moves
IF newSL>0 AND close-newSL>=trailingstep*pipsize THEN
newSL = newSL+trailingstep*pipsize
ENDIF
ENDIF

//manage short positions
IF SHORTONMARKET THEN
//first move (breakeven)
IF newSL=0 AND tradeprice(1)-close>=trailingstart*pipsize THEN
newSL = tradeprice(1)-trailingstep*pipsize
ENDIF
//next moves
IF newSL>0 AND newSL-close>=trailingstep*pipsize THEN
newSL = newSL-trailingstep*pipsize
ENDIF
ENDIF

//stop order to exit the positions
IF newSL>0 THEN
SELL AT newSL STOP
EXITSHORT AT newSL STOP
ENDIF
//***
thanks
Alex
 Paul
PaulParticipant
Master
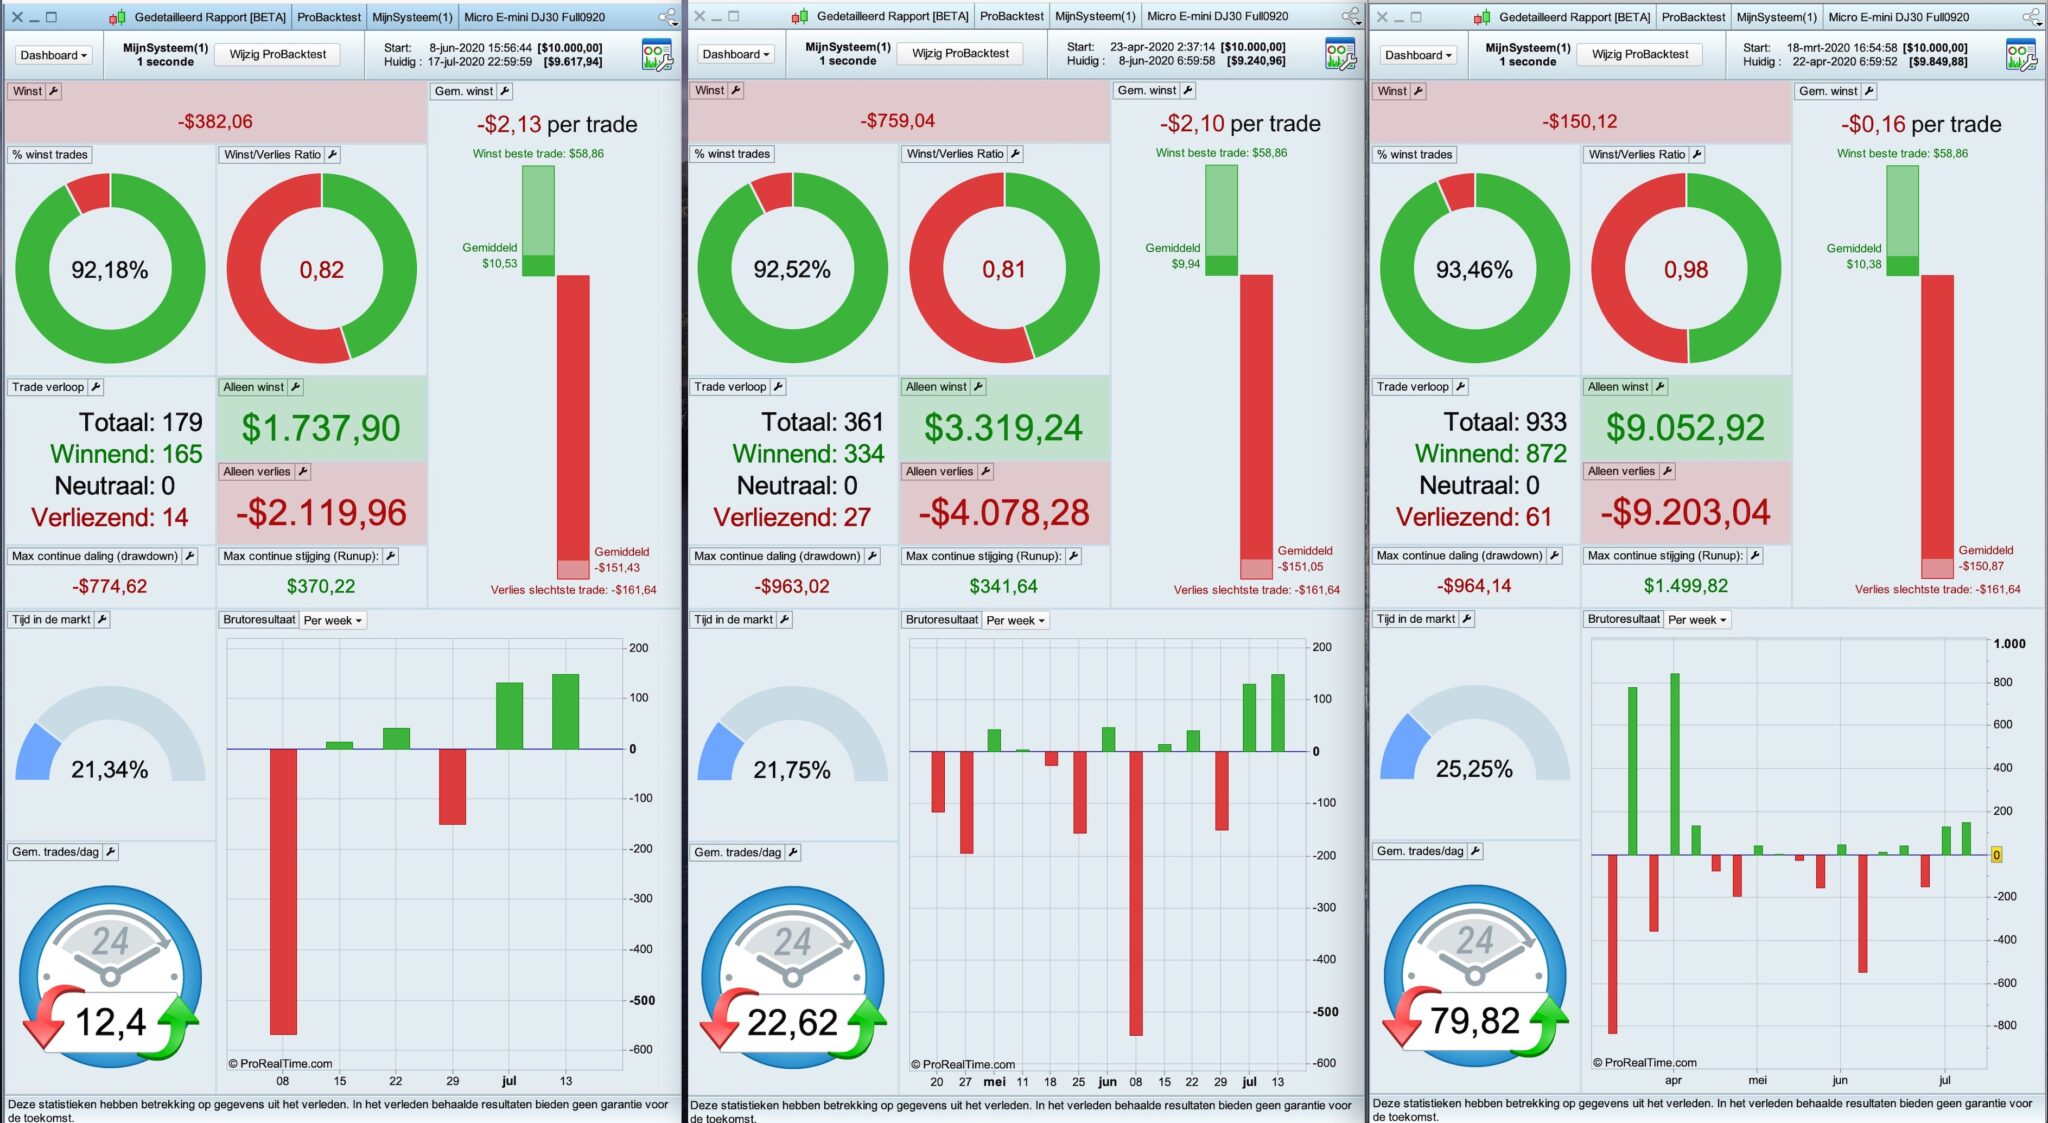
I applied that strategy on the futures mini dow 1s
since it’s possible to test also before a preset date, you can accumulate results.
no spread, but used a fixed commision p/trade.
tested 1s from 18 march to 17 july
PaulParticipant
Master
there is potential, also on futures
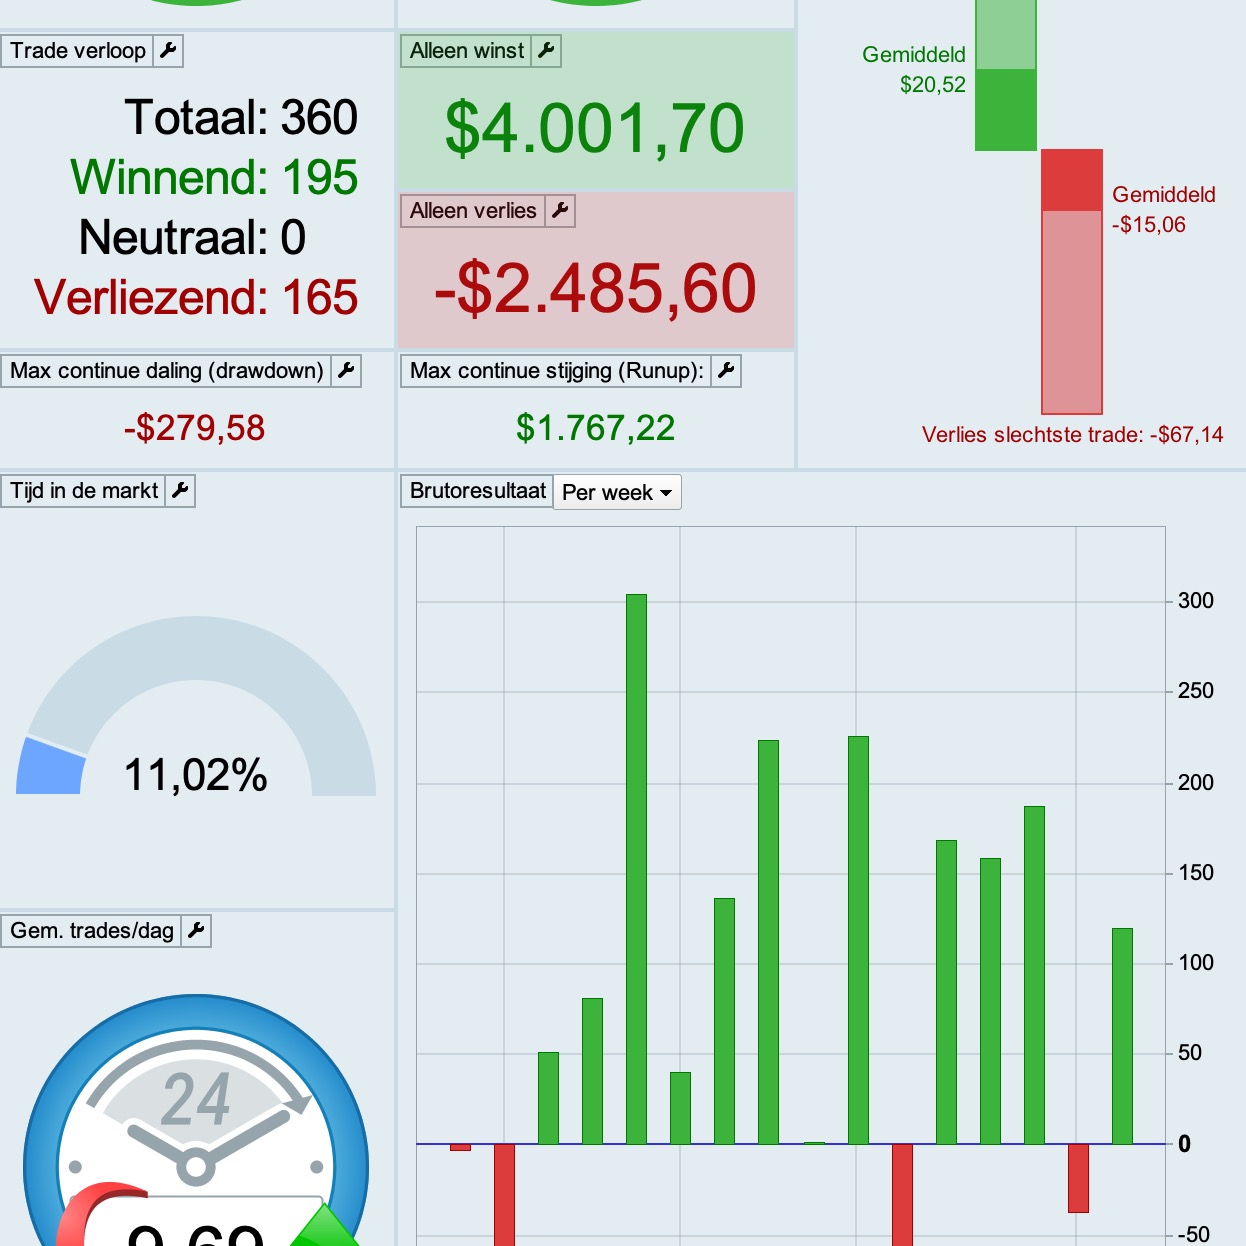
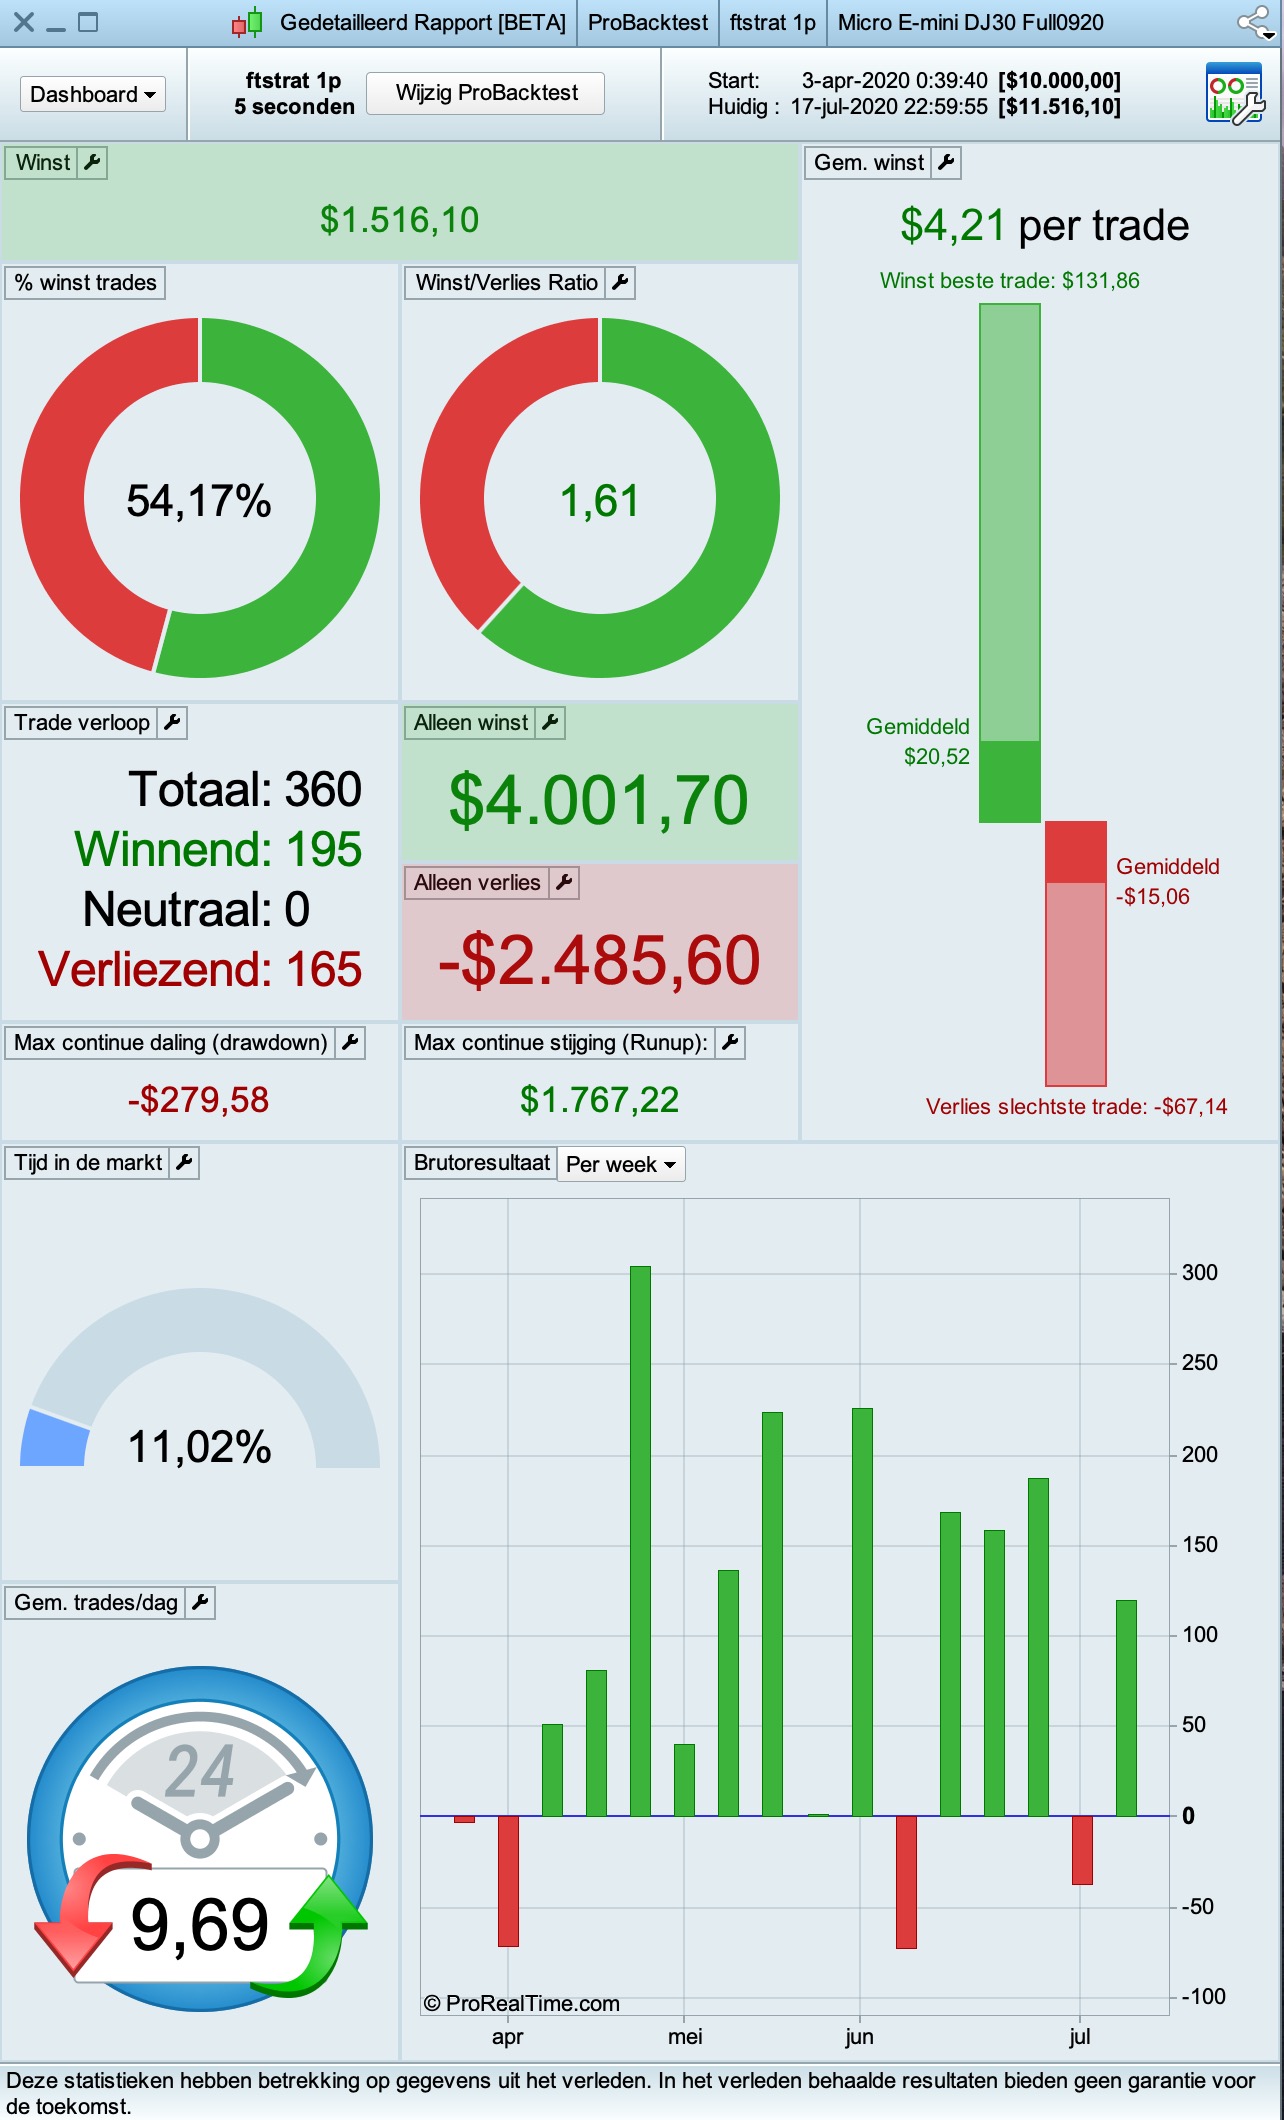
if switched to 5s, 0,5% stoploss & more optimised it looks like this, however if again applied a preset date to add to results, the months before these results are bad. (from jan)
Sorry Paul but which strategy are you referring to? This topic became a multi-strategy one 🙂
Also, how did u make that “cumulated results” test? It’s a v11 feature?
PaulParticipant
Master
It’s in reply to the strategy alex posted above. Sorry, didn’t read the topic back. Actually it’s a strategy of makside isn’t it?
Anyway, it’ wasn’t really about the strategy, more about the ability to have more trades on a short timeframe with futures.
it’s indeed a v11 feature. I had contact with prt with the problem with limited data and they suggested to have a look at futures with v11 & interactive broker. They explained not only is it possible to have much more units, but you have that amount from any moment in time more or less which makes it better for scalping & backtesting.
Hi, I’m new to robots, sorry if my question is stupid. Reviewing your backtest is sometimes tested with € 2,000 other times with € 10,000. This why is it? What does it affect when activating it in real? if i think about activating it in real, how many contracts do i have to write for activation?
Hi Javi
Try everything out on your Demo Platform (for months even!) before ever going Live.
You will get answers by trial of various values.
Thank you Francesco
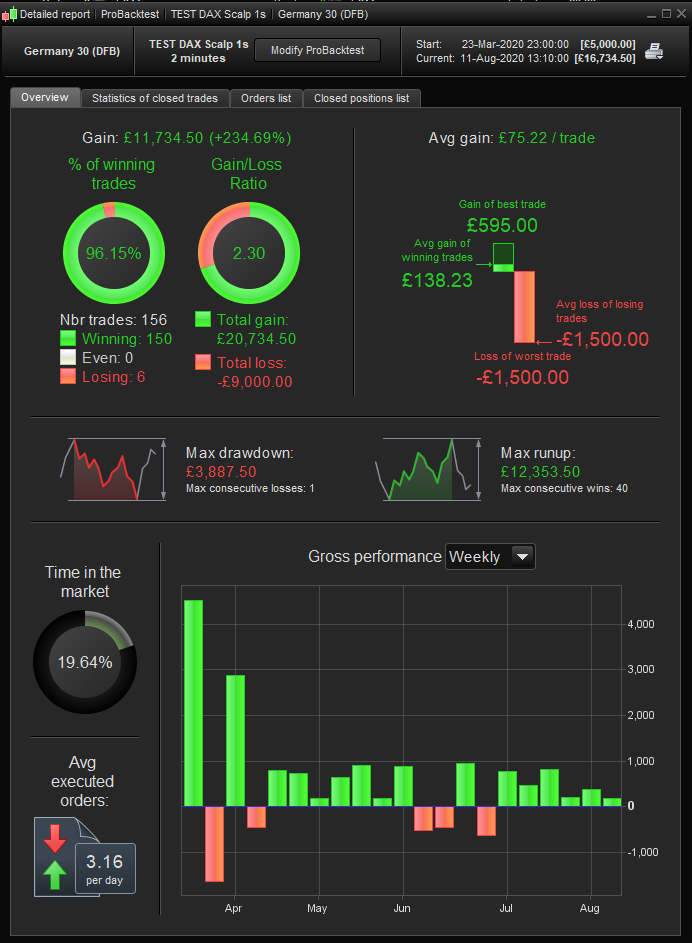
I tweaked the strategy to run on a 2 min time frame, taking signals from 10mins in row 11, and the key item of interest is the very high % of winning trades.
I’m testing on a spread betting account, so using an average spread of 2. I’m working to have a filter from a higher time frame. Will keep you all posted.
Thanks,
S
Why did you backtested only since march? Could be interesting to look how it works on 200k units.
Also, the high %winning trades it’s due to the huge stop loss i guess.
Maybe only since 23 March 20 as the Market took a big change in price action?
I am adopting a similar logic myself, bonus is … loads quicker on backtest! 🙂
Providing System does well in at least a 1 week to 1 month OOS period then it seems to be working … optimise again after the OOS period etc.
I know you purists won’t agree, but I like to be a bit rogue! 🙂
But if the market changes again while you have into live account your “quicker backtest system” you may regret it 🙂
The version I took from above is long only. A simple filter would stop trading during the market downturn. I understand the SL, and with tighter money management/small risk capital, giving positions to breathe can pay off in the longer run. Nice little strategy that I look forward to testing further.