Hi all,
I am coding a simple entry/exit system, however when I try and optimise some variables I can see something odd..
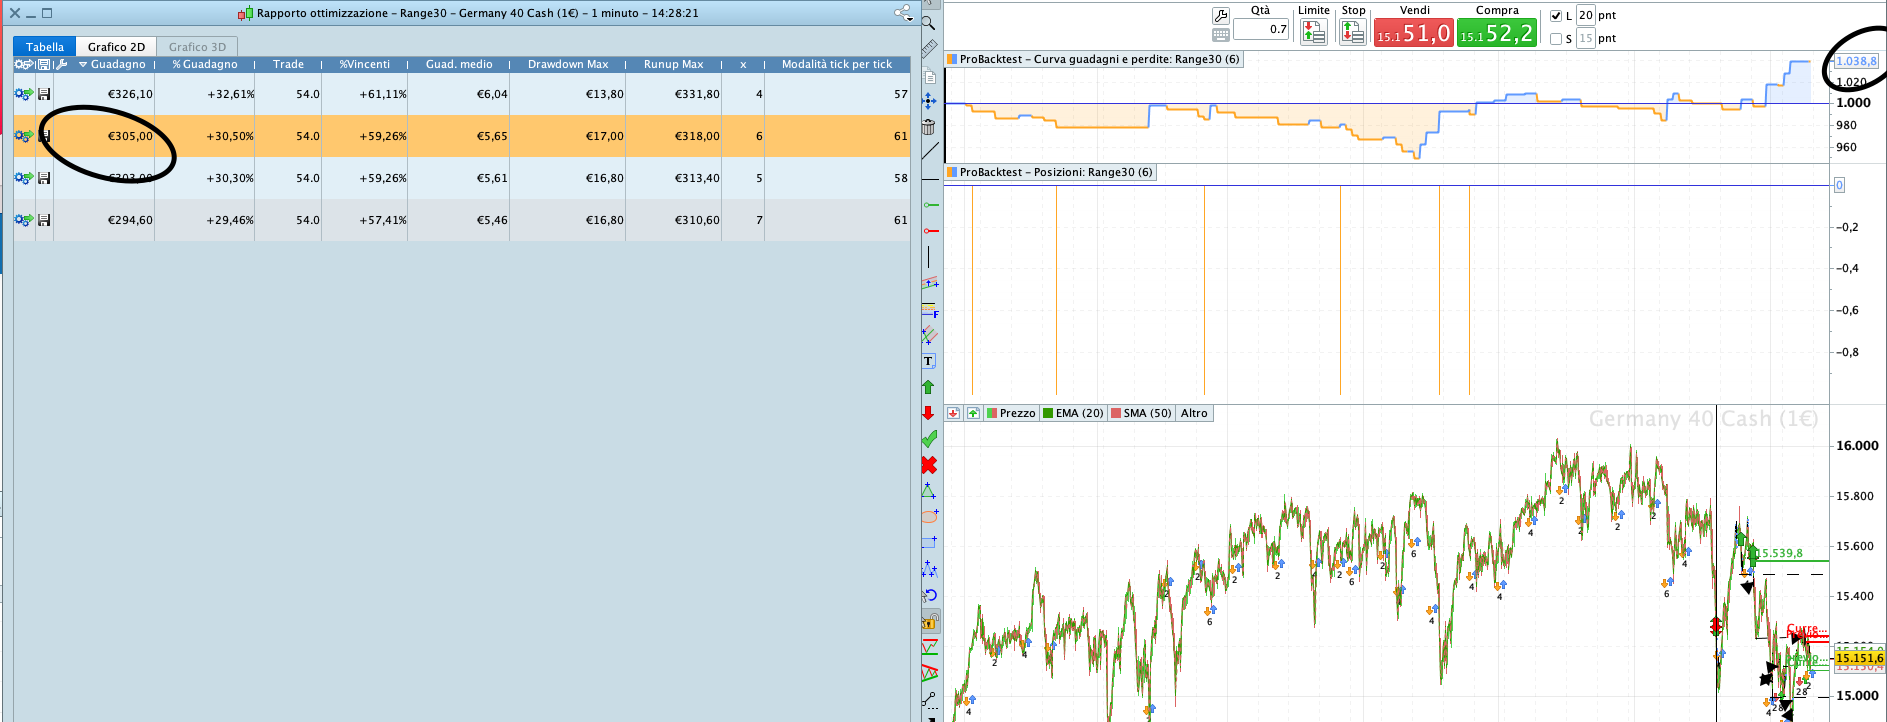
The Gains on Optimization Report (on the left), are completely misaligned with what I see on the P/L curve (on the right). (this happens even when selecting the different optimised models.
In my past experience usign this platform I always beleived these figures were the final results of the strategy
Thanks
Gabriel
Optimization had never used tick by tick (intrabar) precision while ordinary backtest do. That’s why there is a “Modalita tick by tick” column that shows you on how many bars some checking should be made in a normal backtest, more bars = more differences possible.
The figures on the left seem to be the outcome of closed trades, while the curve is updated at any new candle.
Is there any open trade still not reported among closed trades?
No trades are still open at the end of the strategy. But the difference between the results is rather significant.
@Nicolas – is it wise to not use tick by tick opt when coding a scalping strategy? If you don’t use tick by tick are you trading at each candle’s close?
Here is the code, if someone wants to try and run this to see their outcome…
DEFPARAM cumulateorders = False
DEFPARAM flatafter = 080600
starthour = 073000
endhour = 075950

if time = starthour then
hh2 = hh1
hh1 = hh
hh = close
ll2 = ll1
ll1 = ll
ll = close * 1000
endif

if time >= starthour and time <= endhour then
hh = max(hh, high)
ll = min(ll, low)
endif


if CurrentTime < 080000 then
tot = 0
Endif
//x=5
y = 20

// Condizioni per entrare su posizioni short
IF NOT ShortOnMarket AND NOT  LongOnMarket AND  CurrentTime > 075900 and CurrentTime < 080200 and tot = 0 Then
SELLSHORT 1 CONTRACTS AT ll stop
Set stop TRAILING x
set target profit y
tot = 1
ENDIF

IF NOT LongOnMarket AND NOT ShortOnMarket AND CurrentTime > 075900 and CurrentTime < 080200 and tot = 0 tHEN
BUY 1 CONTRACTS AT hh stop
Set stop TRAILING x
set target profit y
tot = 1
ENDIF
Your equity curve shows lots of trades opening and closing in the same bar and so do not show up as positions under the equity curve.
May be something weird in the code or could be those tight times result in trades open and close at 8 o’clock when there is high volatility?
Your Set Stop Trailing at Line 30 and 37 needs widening from the value for x at Line 24.
Better still, dont use Set Stop Trailing at all as it does not work as you expect it to. Try Set Stop Loss.
Hi @GraHal,
thanks for the above.
The actual purpose of this code is to scalp a few points in the first two minutes at the opening. As the aim is to have trades opened and closed within minutes or seconds sometimes.
I shall try to change to Set Stop Loss and see what happens.
If I wanted a Trailing Stop for any strategy, should I code it from scratch? rather than use Set Stop Trailing? Do you think this would be ineffective for all the strategies or for this only?
Thanks
Gabriel
What is the point of Lines 7 and 8 … you don’t use hh2 or hh1 anywhere?
Also Line 12 … ll = close * 1000 … is going to give a huge number, is this ever used?
Just a few thoughts from looking at the code.
Re Trailing Stop, use one of the many codes available here …
Snippet Link Library
Filter by Trail in column B and you will see several … provided by the kind Coding Wizards on here.
Hi @GraHal,
thanks again.
What I am trying to do is to Buy Stop or Sell Stop above and below the trading range occurred in 30 minutes before the open.
I have reviewed the code as per your suggestion above (Thank you!!) and also noticed that the strategy was only selling. I fixed a couple of things and it should work as expected.
endhour = 075950

// getting high and lows for the last 30 mins of trading
if time = starthour then
hh = high
ll = low
endif

if time >= starthour and time <= endhour then
hh = max(hh, high)
ll = min(ll, low)
endif

//set total trades counter to 0 every morning
if CurrentTime < 080000 then
tot = 0
Endif
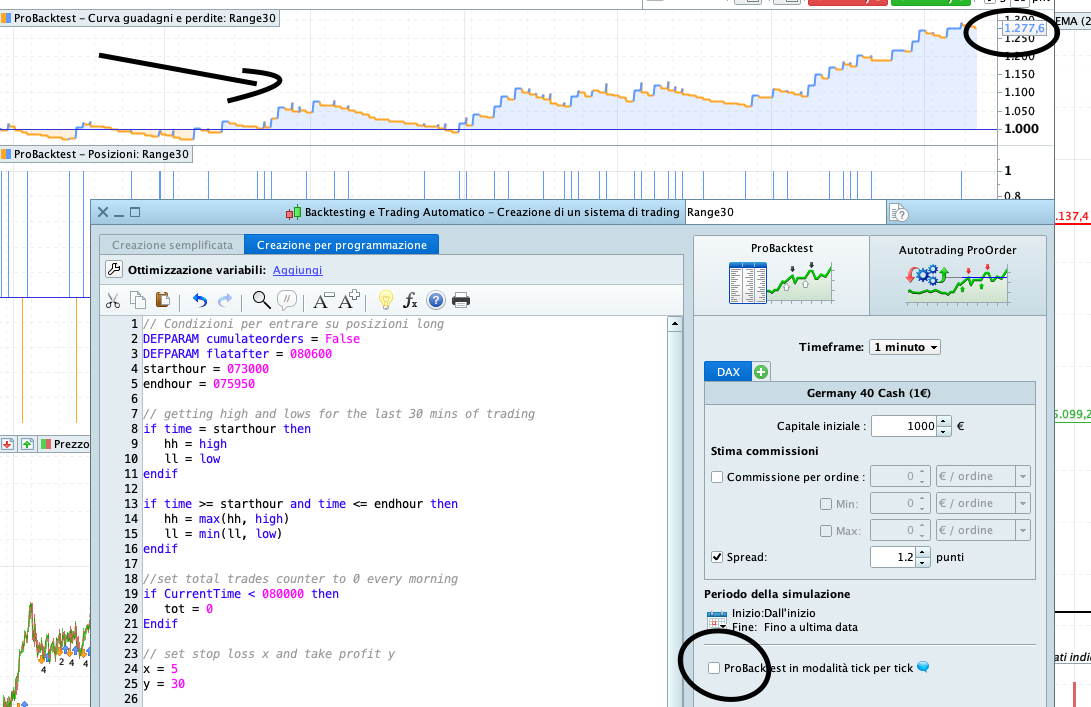
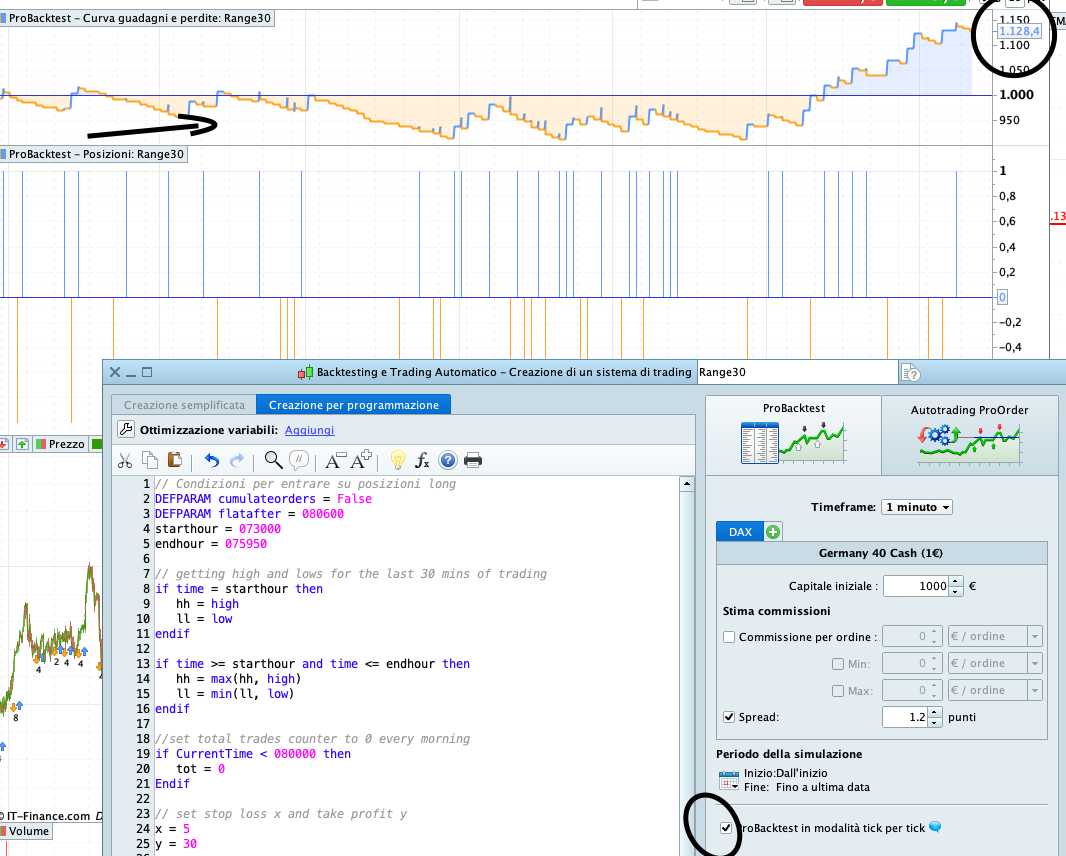
However.. What I am still struggling to understand is how big the results are when backtesting tick-by-tick and when not!! The gains and the P/L curves are extremley different
Should we use tick-by_tick for scalping strategies? (in this strategy there is only 1 trade executed with trailing trailing and take profit after all)
Thanks
Gabs
I’ll try the new code, but yes we always need to have tick by tick enabled … results are completely false without tick by tick enabled and would never be achieved in Realtime.
When I first started on here (never coded before) I thought, wow it’s this easy to code and become a millionaire! 🙂 That was before there was even a tick by tick option to enable.
I then spent loads of time testing testing testing as I didn’t know what was going on or why. Eventually I advised PRT of my findings. I guess it must have been early days for Auto-Trading on PRT. Anyway all history and behind us now, just feel in a chatty mood this morning! 🙂
haha 🙂 find below the full code.. I thought I found the best strategy in the world but with tick by tick that’s not really true haha
I tried playing around with different kinds of stops (trailing/loss). It’s a really basic strategy.. i was hoping it could be automated (succesfully)
But anyway I am back at square one. If I test my strategy using tick by tick and then try an optimise Stop loss and take profit.. the P/L values are completely off between the strategy and the optimisation report (feel free to give it a try)
// Condizioni per entrare su posizioni long
DEFPARAM cumulateorders = False
DEFPARAM flatafter = 080600
starthour = 073000
endhour = 075950

// getting high and lows for the last 30 mins of trading
if time = starthour then
hh = high
ll = low
endif

if time >= starthour and time <= endhour then
hh = max(hh, high)
ll = min(ll, low)
endif

//set total trades counter to 0 every morning
if CurrentTime < 080000 then
tot = 0
Endif

// set stop loss x and take profit y
x = 10
y = 30

// Long
IF NOT LongOnMarket AND NOT ShortOnMarket AND CurrentTime > 075900 and CurrentTime < 080100 and tot = 0 tHEN
BUY 1 CONTRACTS AT hh stop
Set stop trailing x
set target profit y
if longonmarket then
tot = 1
endif
ENDIF

// Short
IF NOT ShortOnMarket AND NOT  LongOnMarket AND  CurrentTime > 075900 and CurrentTime < 080100 and tot = 0 Then
SELLSHORT 1 CONTRACTS AT ll stop
Set stop trailing x
set target profit y
if shortonmarket then
tot = 1
ENDIF
endif
P/L values are completely off between the strategy and the optimisation report
Please expand a bit more on what you mean by above?
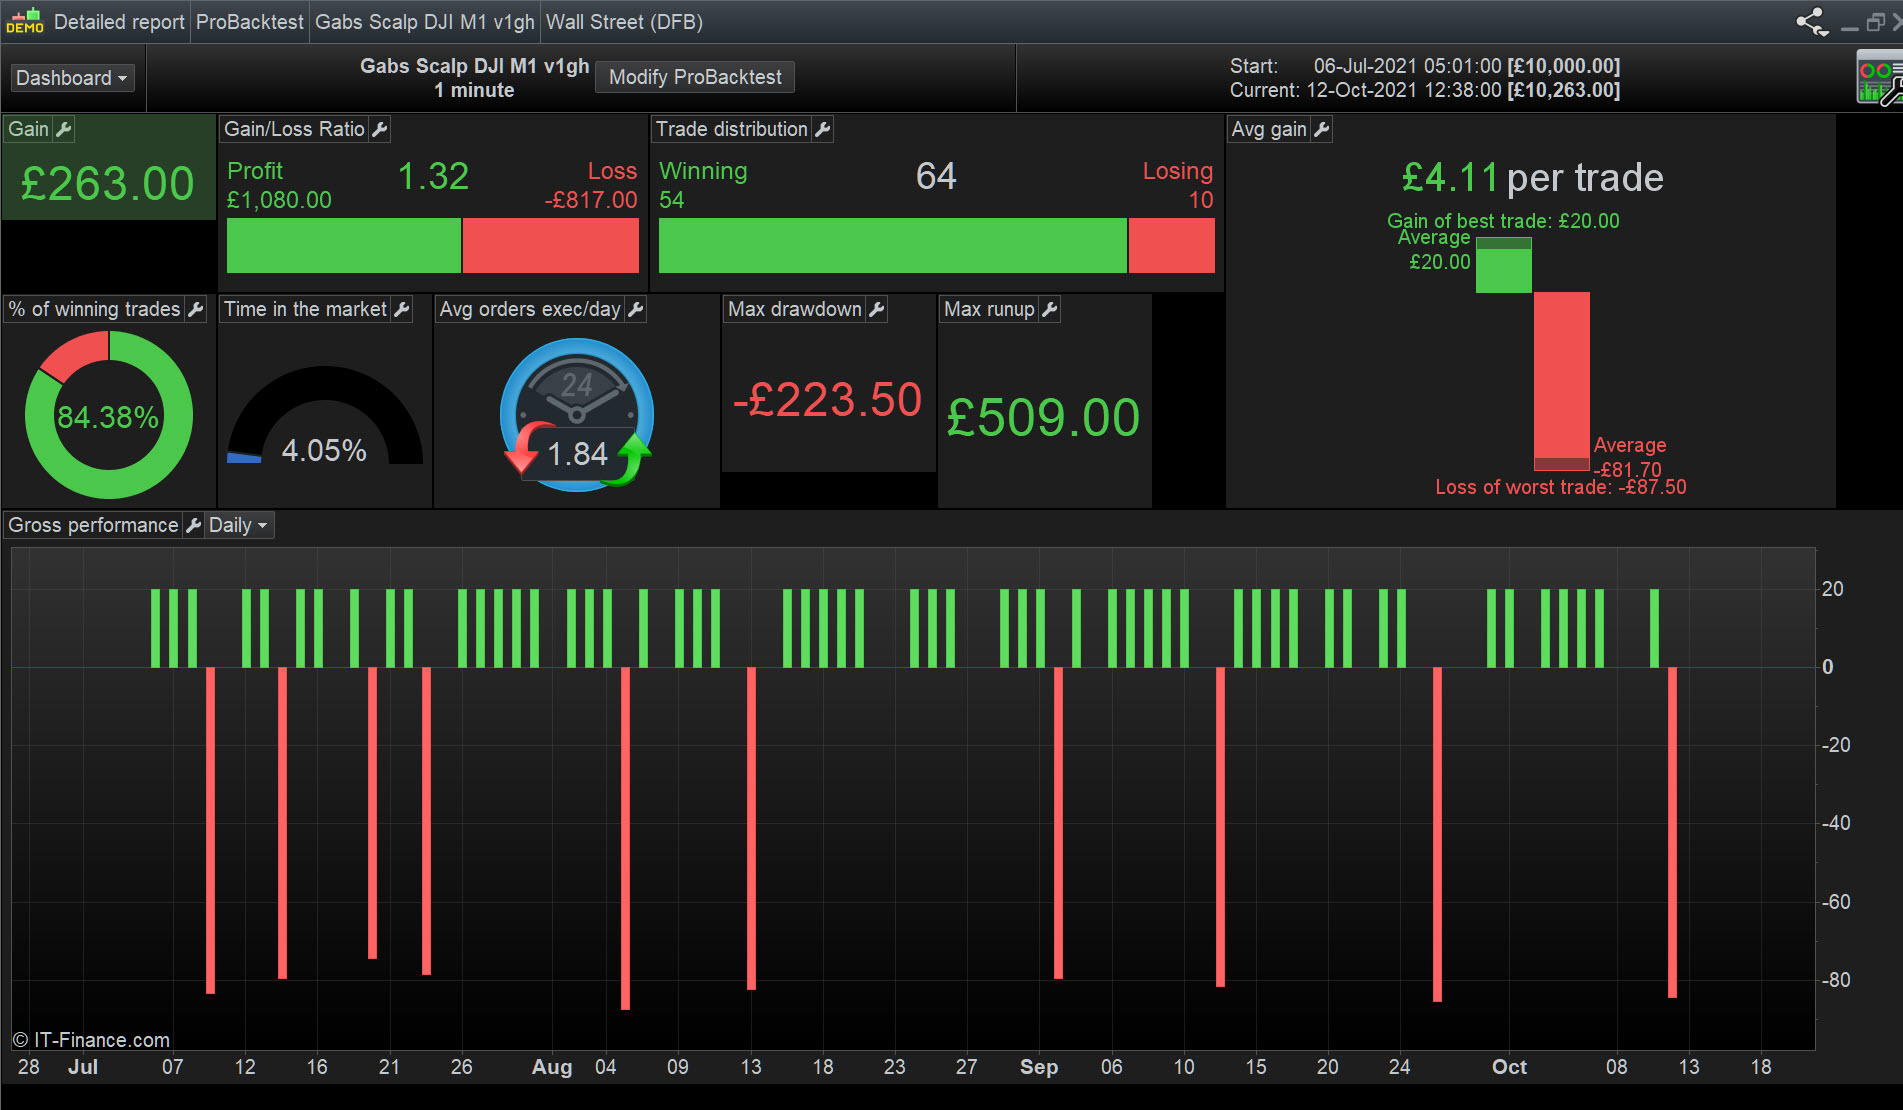
Attached results on equity curve and Detail Report are the same as the optimisation results.
My changes in attached may not align fully with your overall strategy? I wanted to get some Long trades (to prove the code works).
I’m sure attached can be improved further. Feel free to reverse any changes I made, I tend to make changes and run them rather than sit there working out what I expect to happen.
Let’s keep at it. I like scalpers as that is mostly how I manual trade.
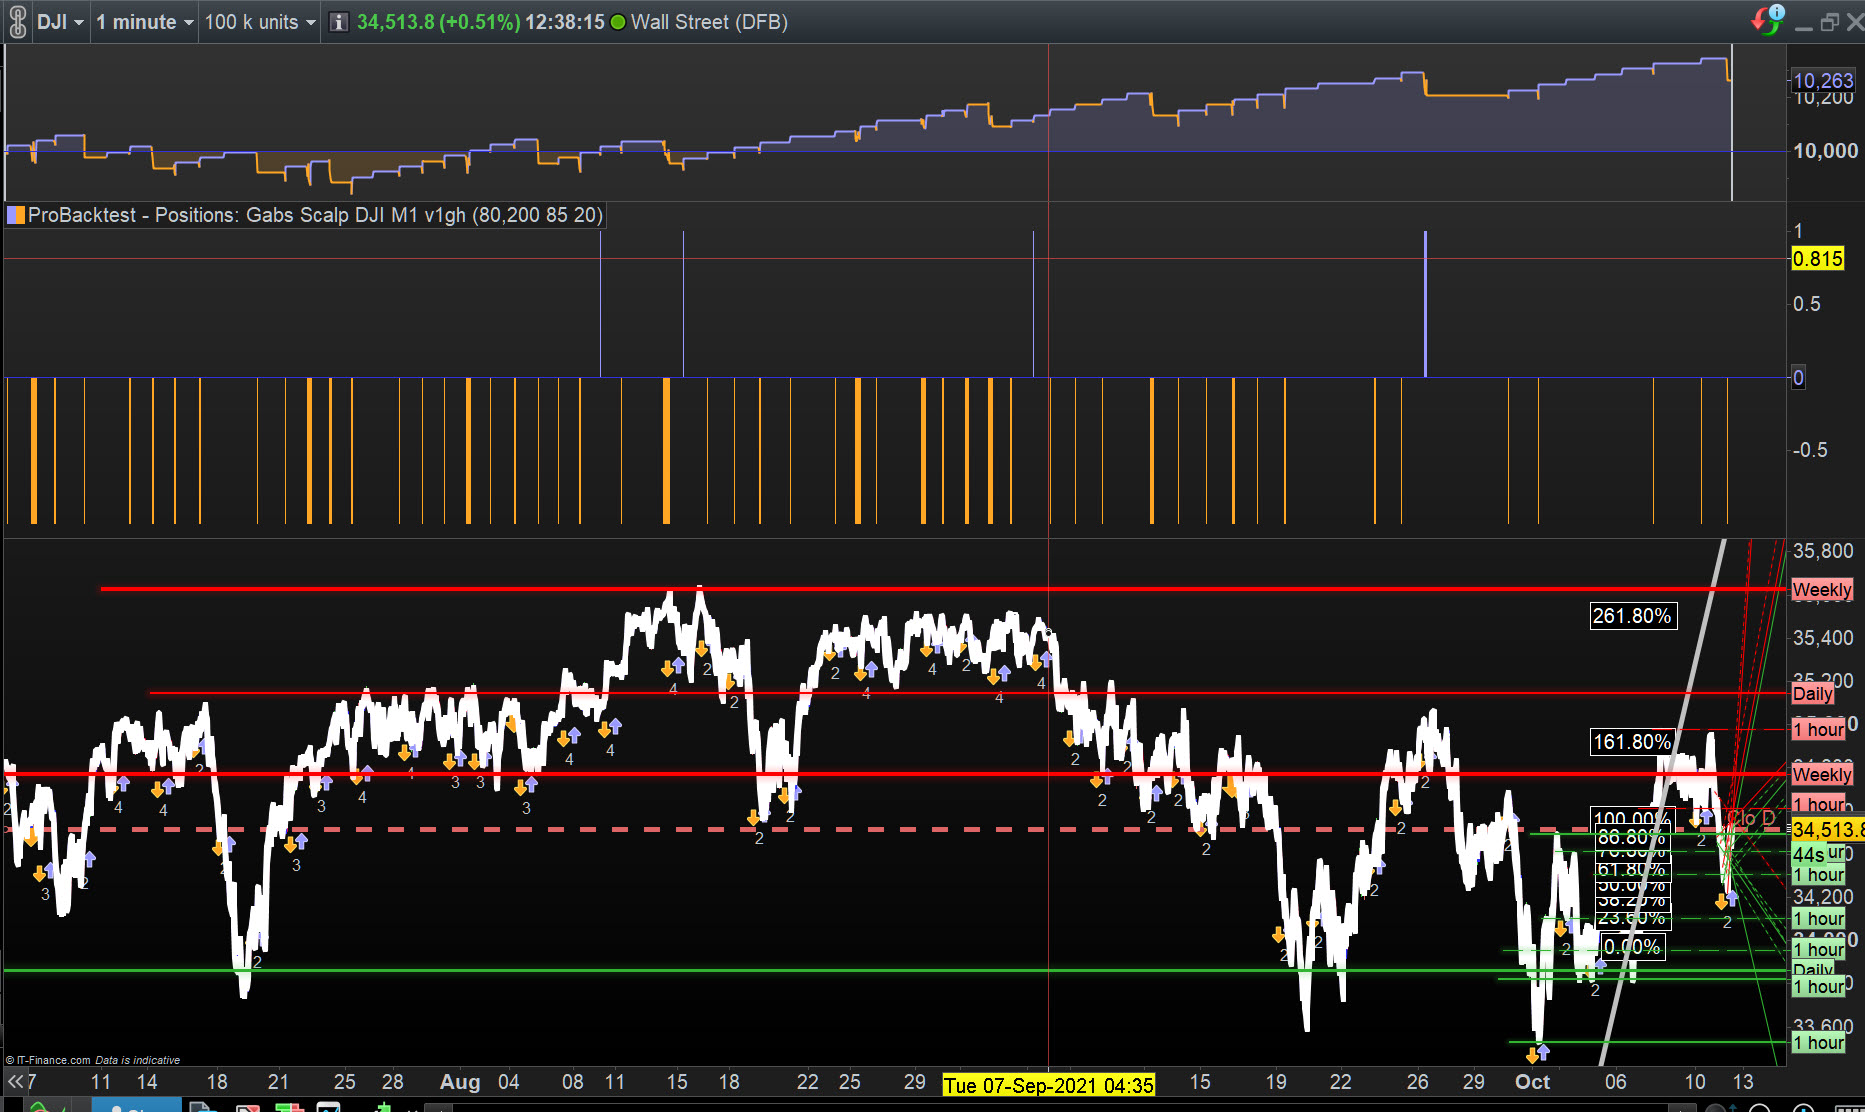
Btw, above was optimised over 10k bars (IS) and then run over 100k bars (OOS) so it might be a good basis for going forward?
Hey @GraHal
I think Nicolas explained this above actually.. But I am not sure I fully understand.
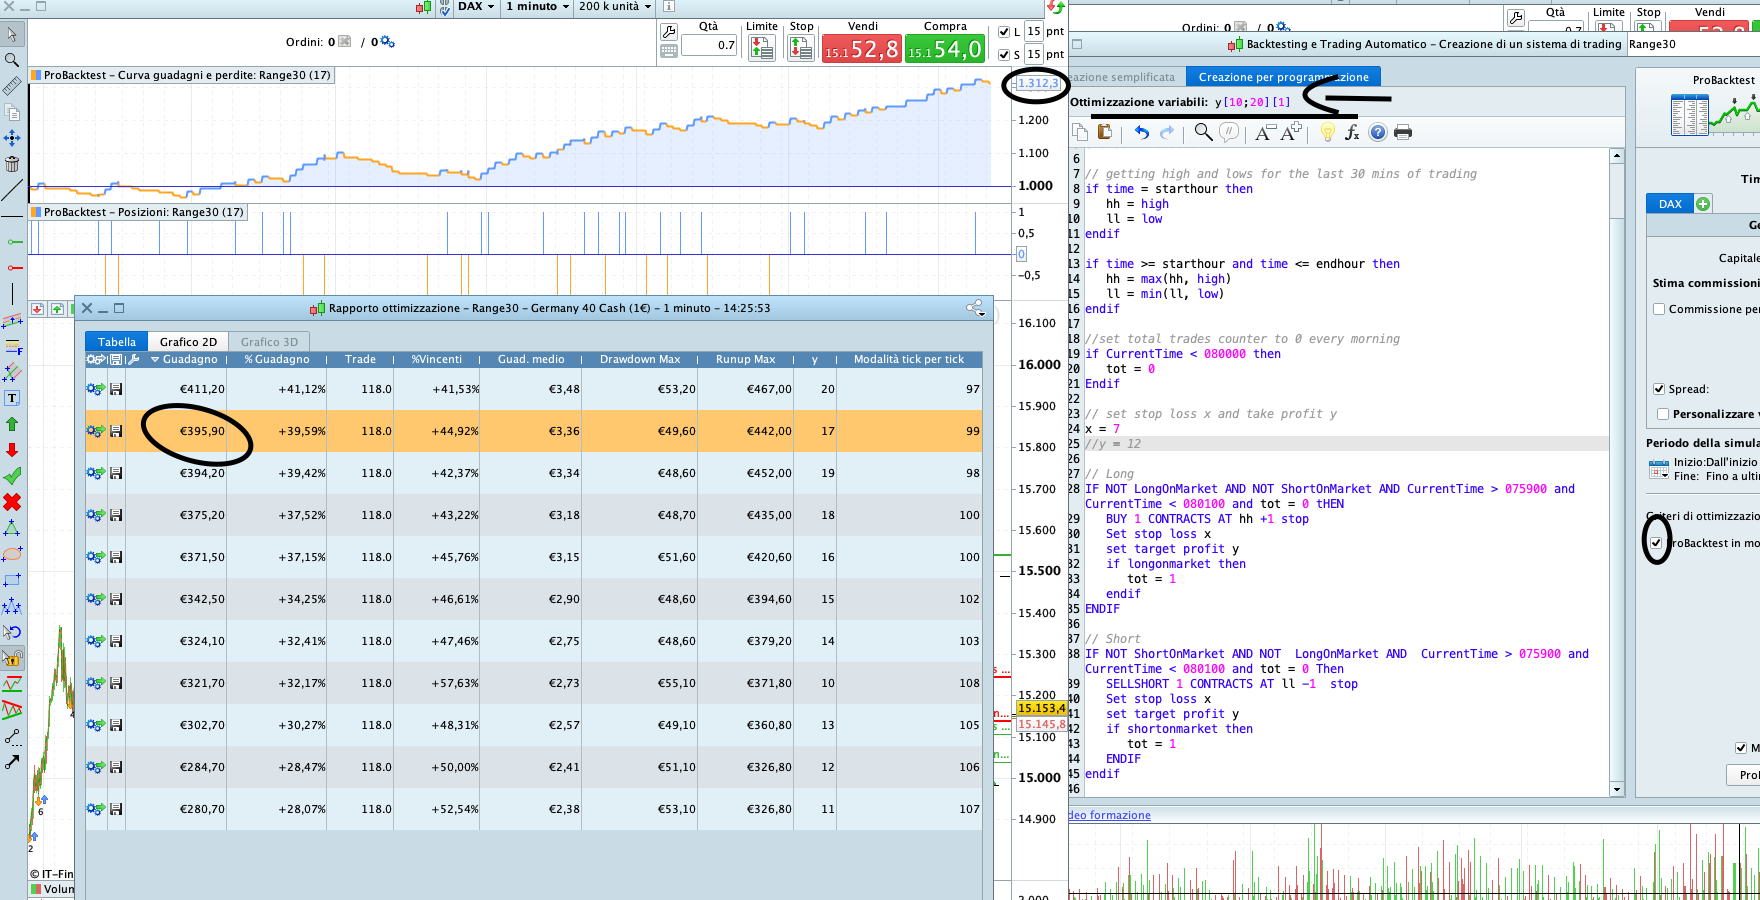
If you look at the filed attached I have run an optimisation to find the best value for my Take Profit (y).
One of the best optimisation is with Y=17.. and as you can see the expected gains are EUR 395.90 (see on the left in ‘Rapporto Ottimizzazione’ the row highlighted in orange!)
Once I click on this, I would expect to see the latest equity value (on the equity line above) to be EUR 395.90 added to the starting capital… so I am expecting: EUR 1395.90, however this is not the case and the final equity value is EUR 1312.3 instead. There is a difference of EUR 83.6… why?
@Nicolas stated:
Optimization had never used tick by tick (intrabar) precision while ordinary backtest do. That’s why there is a “Modalita tick by tick” column that shows you on how many bars some checking should be made in a normal backtest, more bars = more differences possible.
But if this is the case, what would be the point of having optimized variables if these don’t apply to tick-by-tick mode.. I am rather confused.
Nice stuff – I can see you ran the code on DJI!! I wanted to test this too.. But I would adjust the times to the Dow opening (14:30)
Same as you I scalp manually, hence why I am interesting in building an simple code for scalping 😀