Saving full output of backtesting into Excel

Viewing 2 posts - 1 through 2 (of 2 total)
  • Author
    Posts
  • #191803 quote
    alfredocuaresmaalfredocuaresma
    Participant
    New
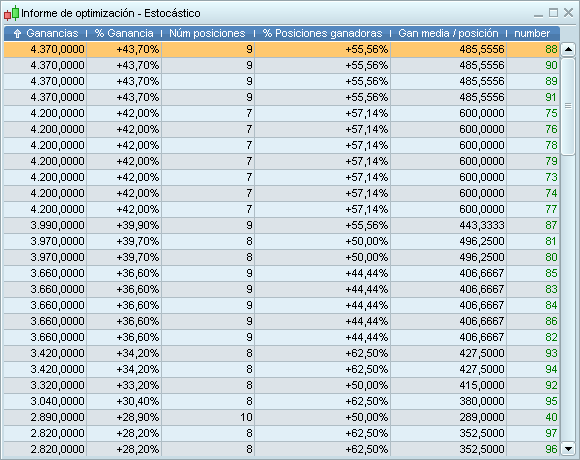
    Hello everyone, When we backtest 10,000 combinations, the results window only shows the top 100. This can be misleading because we haven’t a complete vision of the profitability generated by the system with the variables used, we only have the vision of the 100 best combinations, a bias. We can copy the first 100 results (combinations) from the “Results” window of a backtest into Excel. But how can we copy the 10,000? Thank you.
    trading-systems-3_c1440665609c.png trading-systems-3_c1440665609c.png
    #191811 quote
    JSJS
    Participant
    Master

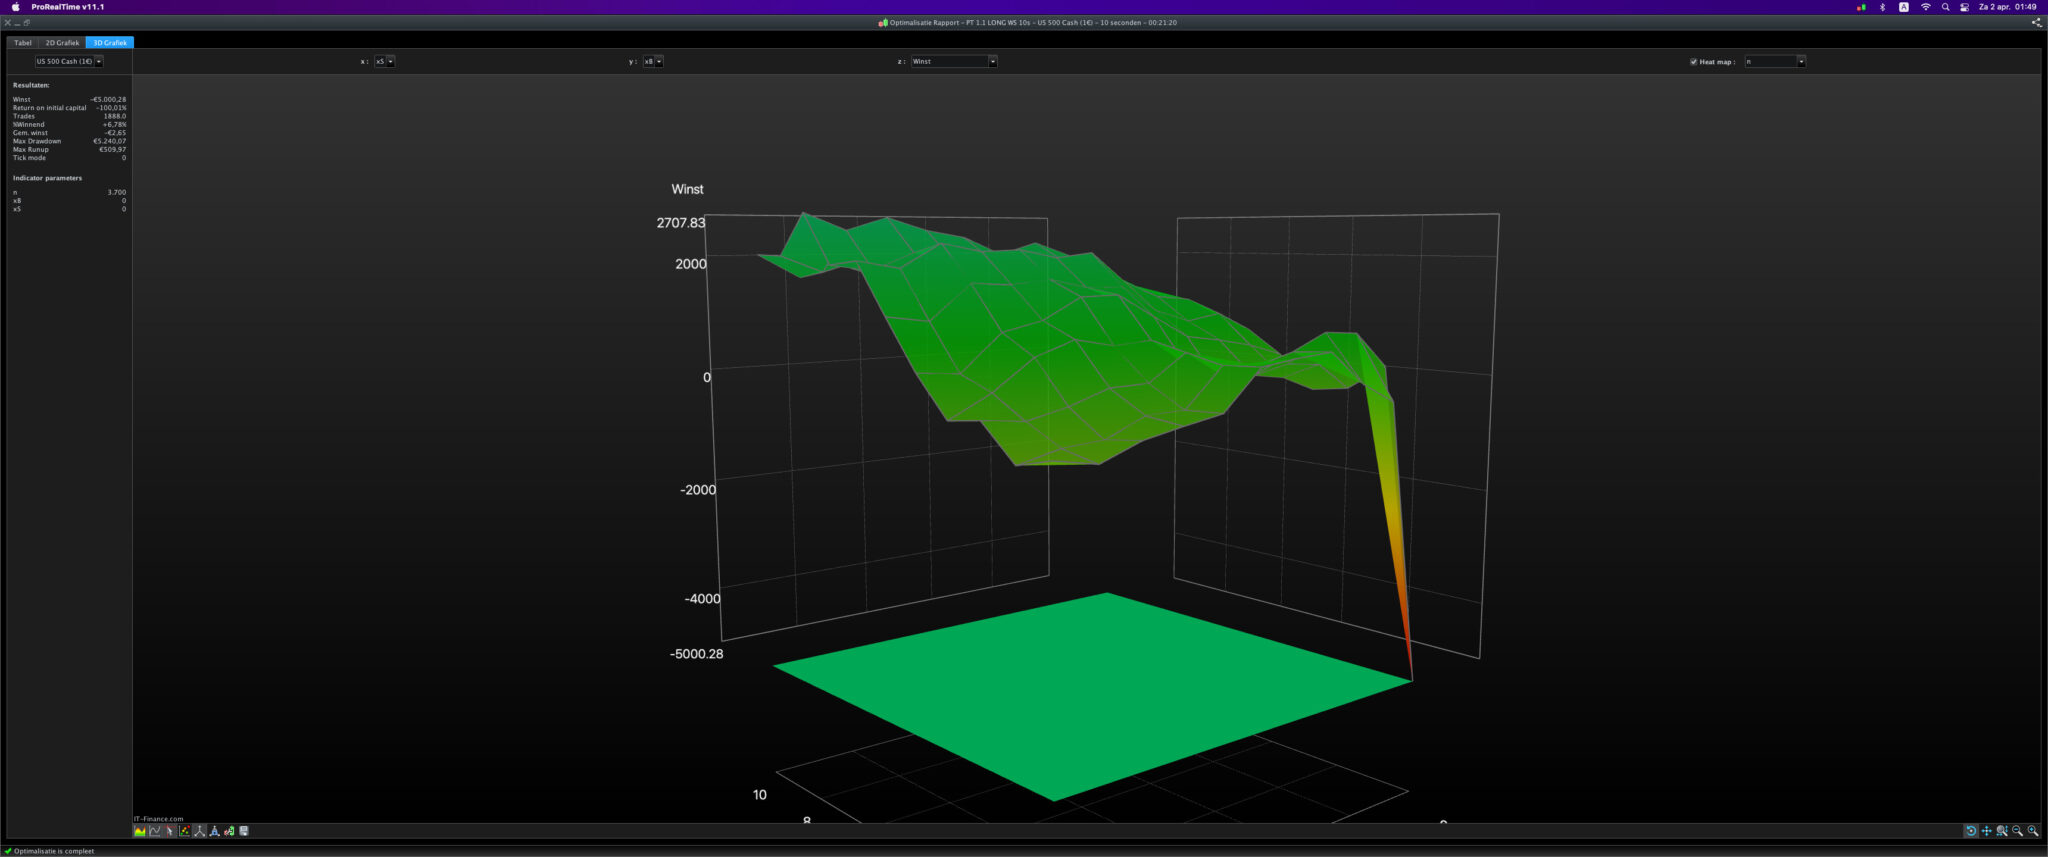
    You can use the 3D graph, which shows all optimization results.

    In the 3D graph, parameters from the back test are shown on the X and Y axis. The Z-axis shows things like profit, drawdown of runup.

    The flatter the curve, the more robust the system.

    Nicolas thanked this post
    Schermafbeelding-2022-04-02-om-01.49.45-1.jpg Schermafbeelding-2022-04-02-om-01.49.45-1.jpg
Viewing 2 posts - 1 through 2 (of 2 total)
  • You must be logged in to reply to this topic.

ProRealAI ProRealAI New

Stuck on this ProBuilder code?

Describe what this topic is trying to build, in plain English, and ProRealAI writes the ProRealTime™ indicator, screener or system for you.

Available in 7 languages
Try ProRealAI

Saving full output of backtesting into Excel


ProOrder: Automated Strategies & Backtesting

New Reply
Author
Summary

This topic contains 1 reply,
has 2 voices, and was last updated by JSJS

4 years, 5 months ago.

Topic Details
Forum: ProOrder: Automated Strategies & Backtesting
Language: English
Started: 04/15/2022
Status: Active
Attachments: 2 files
ProRealCode ProRealCode
Loading...