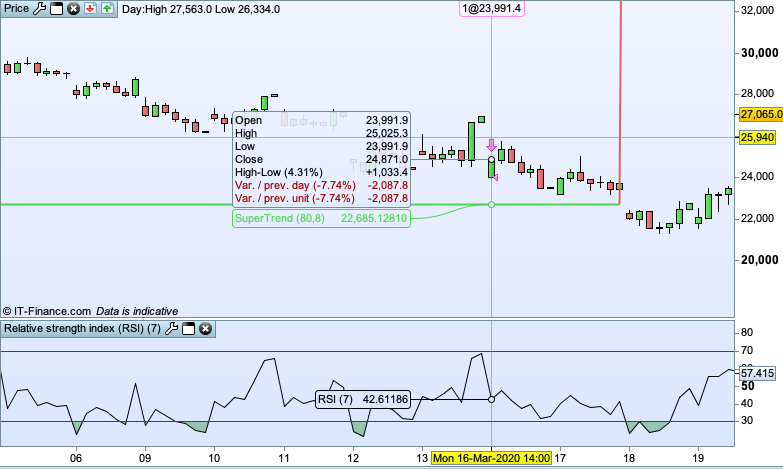
Hi guys, hope you’re all well! I’m seeing issues when using RSI as a pullback entry e.g. if RSI[7] crosses under 70 then short. When backtesting I saw an entry even though the condition was not met. Another thing is that I’ve put in a supertrend indicator to only enter short trade if close below the supertrend [80,8] – if there was just an issue with the RSI, this should have prevented the entry but it didnt. I also removed the supertrend just to see if it made any difference, but alas, still the same issue. So I am really bamboozled – apologies in advance if this is something that is really simple and I’ve just been silly. I tested on ‘mastercard’ stock 1 hour timeframe. Can someone please help/advise. Many thanks
The code is
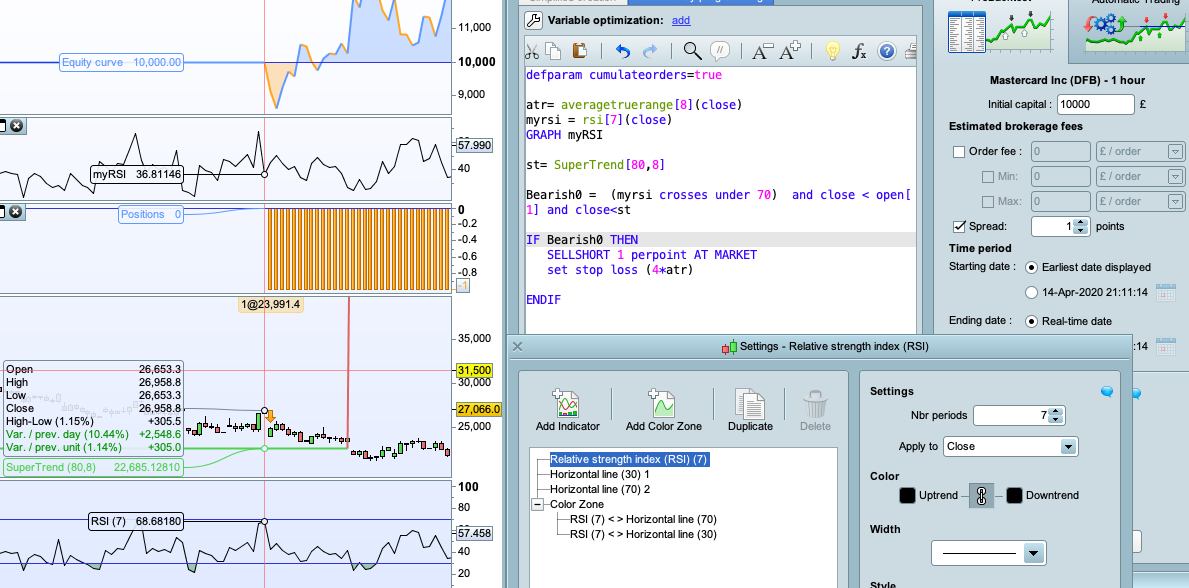
atr= averagetruerange[8](close)
myrsi = rsi[7](close)
st= SuperTrend[80,8]

Bearish0 =  (myrsi crosses under 70)  and close < open[1] and close<st

IF Bearish0 THEN
SELLSHORT 1 perpoint AT MARKET
set stop loss (4*atr)

ENDIF
Double check that the RSI on your chart is being calculated on close in its settings.
Also add GRAPH myRSI to the bottom of your code to check the values.
Hi Vonasi, thanks for the advice, I checked – yes it is set as on close in the chart settings. Also did GRAPH myRSI and it goes from RSI value of 67.8 to 36.8; so doesn’t cross 70….
Those RSI values do not match the ones in your image in your first post. The image shows 42.61 and you say the GRAPHed value is 36.8. So not only did it not cross but you are now also saying that the values are different.
What instrument and time frame so others can test it?
Hi Vonasi, the values I was referring to were from the ‘graph myRSI’ as opposed to the chart RSI. That said I don’t know why they are different from each other??
The stock was mastercard 1 hour timeframe
I did a quick test and it is definitely something weird on that instrument. On the DJI and DAX I get exactly the same RSI value in the strategy and in the indicator but on Mastercard it is all wrong and it opens positions when it shouldn’t. I just checked Vodafone and the RSI values are also not the same.
I’ll highlight this to Nicolas in the morning off forum and maybe he can contact PRT about it.
Thank you Vonasi, that would be great. Much appreciated. I also saw this with a few of other instruments (can’t remember which ones now) but they were not showing entries when they should and entries when they shouldn’t.
I don’t see any candlestick on your example, is it the same for all the issues?
Did it happened only on Mondays?
Did you change the trading hours for this market? (custom trading hours menu).
There is a candlestick there but it is a small one and hidden under the crosshairs. My platform is run with no timezone changes or hidden candles so it is not that.
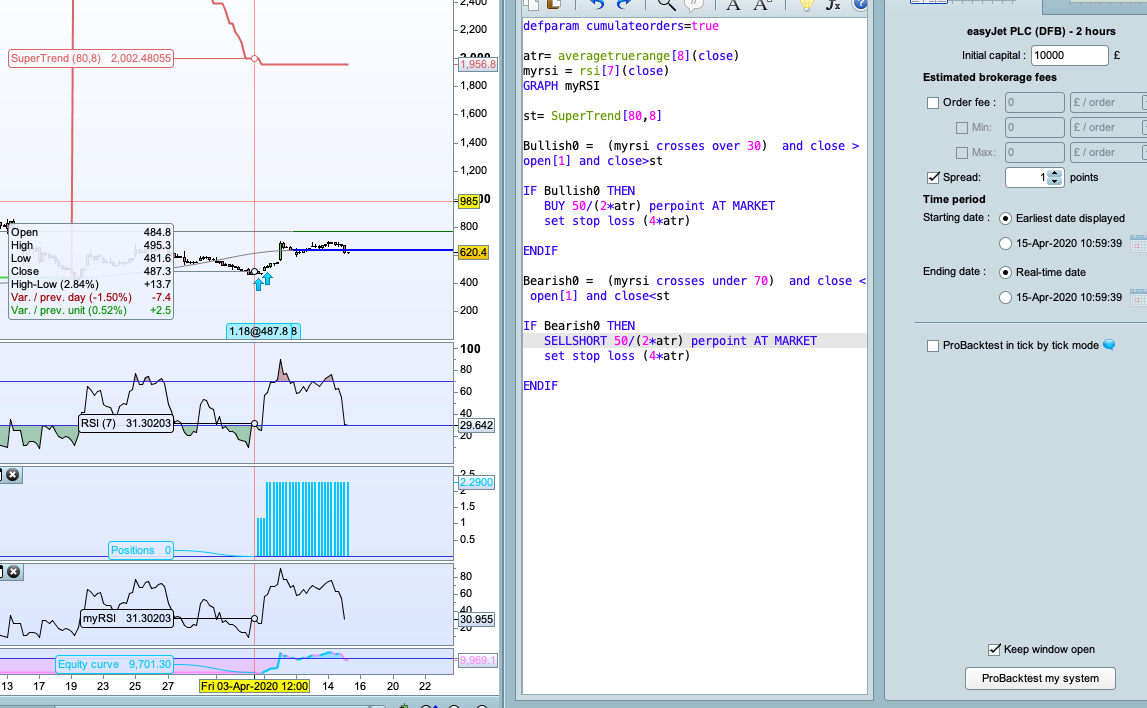
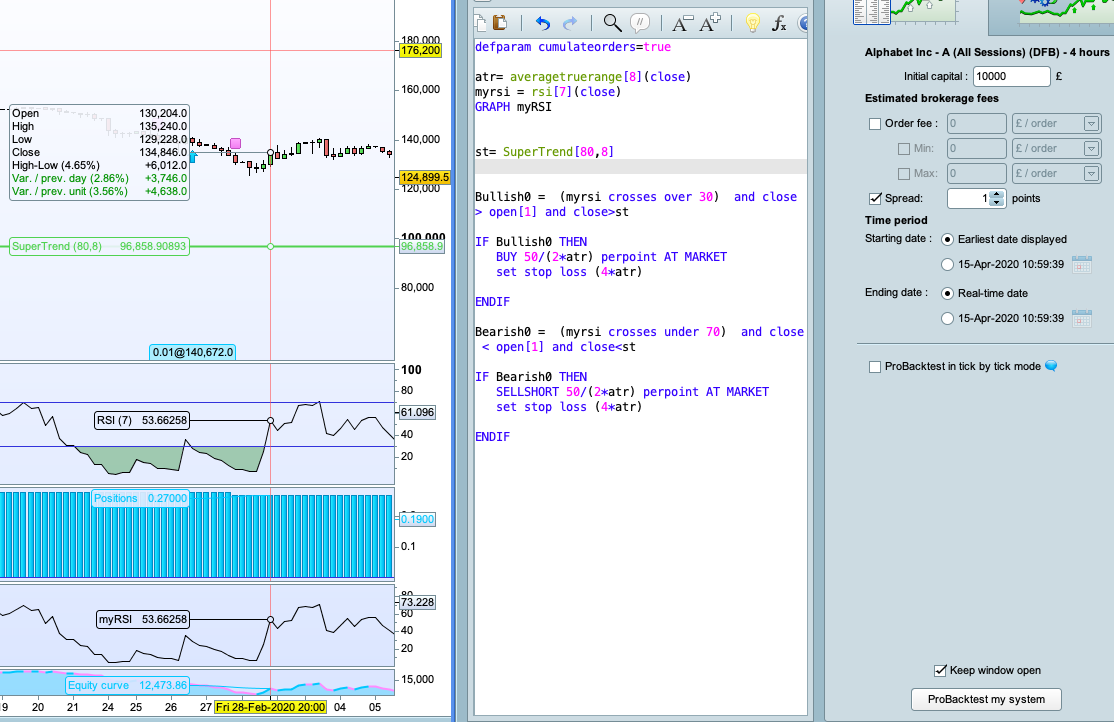
Here are another couple of examples
- Easyjet stock 2 hours: long entry occurs even though close below supertrend (RSI condition fine here) so maybe something to do with supertrend indicator in this case??
- Alphabet stock 4 hours: Entry should have taken place where cursor line is as meets long conditions but doesn’t
Please GRAHPONPRICE the supertrend to see why it does not match. I suggest you make a technical report with a link to this topic to close the loop.
Thanks Nicolas and Vonasi. I’ll report it. I added the graphonprice for supertrend – for some reason it doesn’t track in line correctly with ‘easyjet’ 2 hour time frame – hence the entry, seems fine in some of the other cases – not sure how widespread the issue is…
Might be a rounding issue, as Vonasi discovered it, in this topic: https://www.prorealcode.com/topic/inconsistency-bug-between-probuilder-and-proorder-please-advise/#post-126349
I’ll try to get more infos on that problem and get back here.
Hi Nicolas, hope you’re well. Just wanted to find out if you did get any more information on this?
Having played around a bit more, I’ve noticed that when you change the number of units at the top from say 10000 down to 100 the supertrend becomes weird. For example ‘facebook’ stock 4 hours – the supertrend switches from being on top of the price (i.e. the stock is in downtrend when looking at 10000 units) to being underneath the price (i.e. stock is in uptrend when looking at 100 units).
This shouldn’t be the case should it? Your insight would be greatly appreciated.
Since the calculation of the indicator begin at first candlestick, it might be different depending of the units loaded. The Supertrend is changing its direction based only on a cross of a candlestick through its line, so it seems a normal situation for me.
As for the RSI issue, did you ever get any reply from the support? Are you with IG?