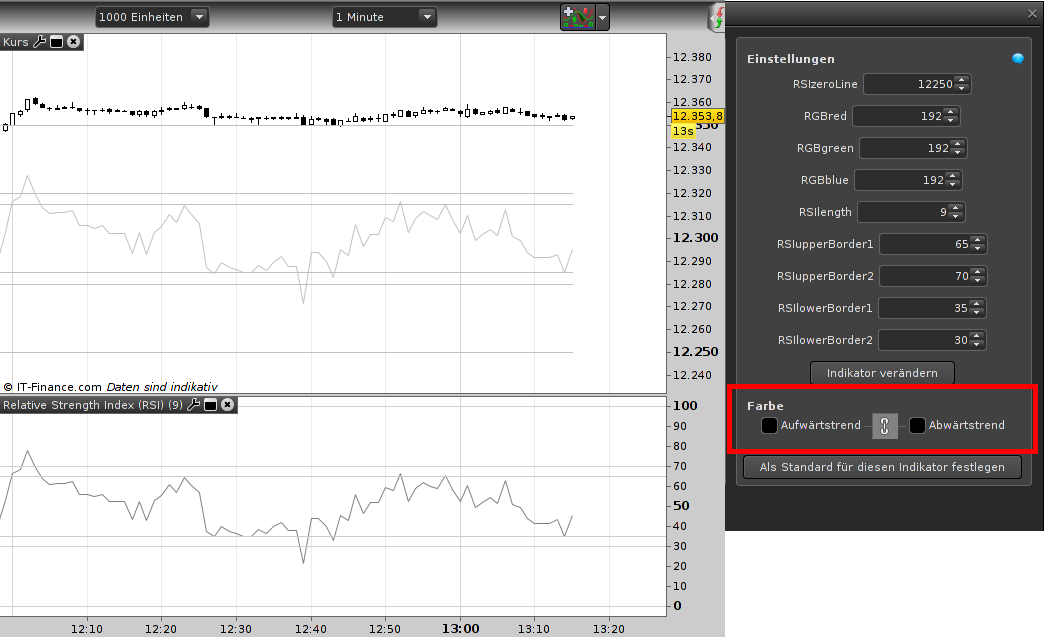
This puts the RSI into the chart window; works on GDI and DJI (position has still a heavy thinking mistake, I will do this later). I have 2 questions with regard to user color adjustments – maybe they are related :
- What in the code is causing the “color adjustment” (the red mark in the picture). I am defining the RGB values separately and playing with it does not have any effect (kind of useless).
- I made the RGB values separately with this kind of variable: RGBred[128] (type: integer). So far so good but never underestimate what users do, I simulated a user pushing the down-arrow in the adjustment menu for the red color until (the RGB value below zero) – the whole indicator crashed out of the window with “Color parameter outside of expected rang: Red”. Setting the color to default if the RGBred is out of limit did not work.
- I already tried this: simply go without all color statements and the coloured(r,g,b). This results in a “color adjustment” menu for the user but does not have any effect – just like in 1.
Here is the code (sorry for my heavy commenting):
// --- we want it in the chart, so the zero-line must be somewhere near the bars
// !!! TODO: see below
// --- does not work: color change of line dependend on RSI exeeding borders
// drawsegment begins coloring too early (prev bar to bar), so draw simple line

// === Variables Begin
// --- variables for calculation
// RSIlenth: although strategy fixed (default: 9), added changing option
// RSIupperBoder and RSIlowerBorder: fixed by strategy but added option
UpperRSIband1 = RSIupperBorder1 // default: 65 fixed
UpperRSIband2 = RSIupperBorder2 // default: 75 added
LowerRSIband1 = RSIlowerBorder1 // default: 35 fixed
LowerRSIband2 = RSIlowerBorder2 // default: 30 added
// --- variables for painting
// RSIzeroLine: MUST be user adjustable, NOT type integer in case it's used for forex
// !!! TODO: heavy thinking mistake: just +/- 100 does not work in markets with low price (fx,shares..)
// !!! TODO: maybe make it percent of price
// --- colors: user must be able to change them (depending on chart background)
// !!! this does not help against user crashing with exeeding the values
IF ColorR < 0 OR ColorR > 255 THEN
ColorR = 128
ELSE
ColorR = RGBred
ENDIF
IF ColorG < 0 OR ColorG > 255 THEN
ColorG = 128
ELSE
ColorG = RGBgreen
ENDIF
IF ColorB < 0 OR ColorB > 255 THEN
ColorB = 128
ELSE
ColorB = RGBblue
ENDIF
// === Variables End

// === Calculation Begin
RSIval = RSI[RSIlength](close) // MUST be close, otherwise a mess with drawsegment
prevRSI = RSI[RSIlength](close[1]) // drawsegment needs a begin
// === Calculation End

// === Drawing Begin
// --- the rsi line
DRAWSEGMENT(barindex-1,rsiZeroLine+prevRSI,barindex,rsiZeroline+RSIval) coloured(ColorR,ColorG,ColorB)
// --- for orientation: zero line and the limit 100 (can not be more than this)
// !!! TODO: see above
DRAWSEGMENT(barindex-1,rsiZeroLine,barindex,rsiZeroline) coloured(ColorR,ColorG,ColorB)
DRAWSEGMENT(barindex-1,rsiZeroLine+100,barindex,rsiZeroline+100) coloured(ColorR,ColorG,ColorB)
// --- the border lines
// !!! TODO: see above
DRAWSEGMENT(barindex-1,rsiZeroLine+UpperRSIband1,barindex,rsiZeroline+UpperRSIband1) coloured(ColorR,ColorG,ColorB)
DRAWSEGMENT(barindex-1,rsiZeroLine+UpperRSIband2,barindex,rsiZeroline+UpperRSIband2) coloured(ColorR,ColorG,ColorB)
DRAWSEGMENT(barindex-1,rsiZeroLine+LowerRSIband1,barindex,rsiZeroline+LowerRSIband1) coloured(ColorR,ColorG,ColorB)
DRAWSEGMENT(barindex-1,rsiZeroLine+LowerRSIband2,barindex,rsiZeroline+LowerRSIband2) coloured(ColorR,ColorG,ColorB)
// === Drawing End
RETURN
// === Program End
Thanks for your help.