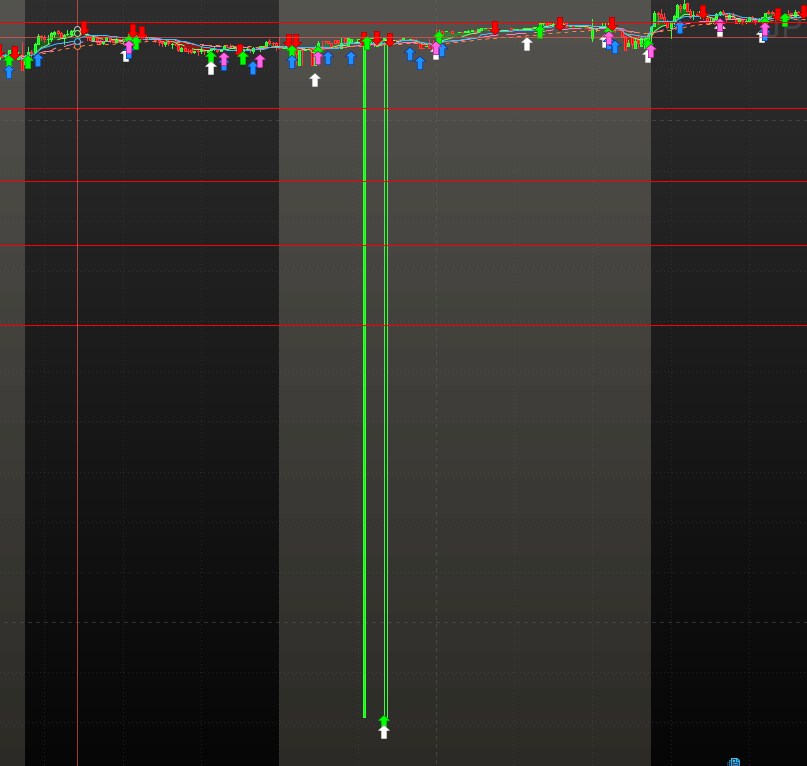
I have literally seen probably 100 candles over the last month, where PRT prints candles that not only has no other software identified, but even when I look back on PRT in different timeframes, they are sometimes also not there. Average daily ranges are drastically skewed and unreliable, and most attempts at accurate levels identification are useless with so many bad prints. I’ve emailed tech several times, and they’ve corrected the identified candles, but reviewing 100 stocks for weekly planning, I probably identified 20-30 rogue candles. This is JPM from 2/26/25 and NFLX 5/7/25. The NFLX candle is a 200pt/$ candle. Anyone else notice this often? Hopefully a fix in new version? Might have already been addressed and I missed. Thanks.
LLY after the bell yesterday is attached.
Hi! What you’re describing are indeed data anomalies that can occasionally appear in the form of “rogue” candles (extreme spikes not confirmed by broader market data). These tend to occur more frequently during Extended Trading Hours (ETH), especially on US stocks, where liquidity is thinner and price variations can be more erratic or even erroneous due to how trades are reported or aggregated.
There are two interpretations:(1)These candles could be legitimate prints that occurred during ETH, even if they are illiquid or outliers.(2)Could be spikes to be corrected.
PRT Data team has to review these cases. That’s why, as you’ve noticed, support may correct them on a case-by-case basis when reported.
Thanks for your feedback.
These tend to occur more frequently during Extended Trading Hours (ETH), especially on US stocks, where liquidity is thinner and price variations can be more erratic or even erroneous due to how trades are reported or aggregated.
Hey @Iván,
I think a more decent response is required;
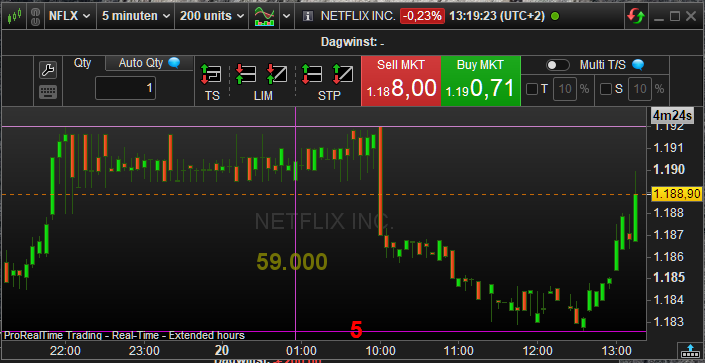
Attached is Netflix from the OP example. So … 200 points ? that is impossible. This is 100% UNrelated to ETH. Also, and worst hence super dangerous, PRT’s ordering system will be triggered by it. Look at the examples from gp38super. I can’t tell whether this is Live or Demo, but I can tell you : both trigger on it.
Maybe some kind of inside information :
A self-respecting broker / data provider, filters out such spikes in advance. They HAVE to, because all sorts of serious problems will emerge if they wouldn’t. Like the OP earning virtually 100K on LLY – would that have gone out at its peak (and depending on the number of contracts of course).
PRT does not apply this filter, while they DO have their own data. This is (also) how they can filter the data in aftermath (and they do indeed).
Someone should really do something about this (make that filter so it is active before the data reaches us).
Raw data is full with anomalies (like glitches).
What you talk about Iván, exists too : during ETH, and especially premarket USA in our afternoon (say from of 13:00 AMST), prices can be way way off because bid and ask don’t work yet for the non-volatile equities. BUT, PRT assumes them, and the spread now can be … Infinite (I am serious). You can observe that when looking through IB’s TWS because there the bid and ask really show (which PRT can’t do). But once you know the behavior, you can trade on it in PRT just the same (and may lose xxx right at the entry because reality appeared to be different than you could see (you are the first with a bid and Boom)).
Kind regards,
Peter
Yes, thank you Peter. All are live, and they occur frequently. And I rely most heavily on my price action levels. With PRT, it can be very much garbage in, garbage out, rendering it useless to rely on. Currently, I spend additional time interpreting data from TOS or TWS to verify/validate PRT. I’ve grown plenty fond of PRT charting, so I’m hoping this can be fixed, but at some point, it may be one of the reasons that lead me away from it. Thanks again for your input.
Gary
Thank you. Yes, support has been responsive to repair. But if I were to report all that I identify, I’d be willing to bet that I could easily find an average of 4-5 per ticker, just amongst my total watchlists of about 100 tickers, and all within the last roughly 90days. Thats a LOT of bad data to have to report, or worse, to expect to rely on, I think. I thought about possibly somehow excluding ETH from my data reporting, but being a scalp/day trader, especially, those hours are just as important to anyone’s price action study. Even longer term traders that study levels of support and resistance would be getting bad info if they don’t notice these. Lastly, my profit potential study when choosing option strikes relies heavily on ADR, and these values are more often(pretty much all) skewed as a result of these rogue candles reporting. In some cases, choosing CBOE vs say NASDAQ data makes a difference, but I only checked a few and only a portion of those actually made a difference. And, I believe it was the CBOE data that excluded a rogue candle or 2, but CBOE also reports fewer price action movements, especially post/premkt, also not proving the most accurate data available. Support has reached out specifically addressing the issue, and I hope they can figure out a fix/filter, as it would provide one more reason to choose PRT, rather than a reason to avoid. As always, your attention and input are greatly appreciated, Ivan, Thank you.
Gary
For a prime example of useless data, look at BRK.B More than 50% of the candles are bad data. Thats crazy.
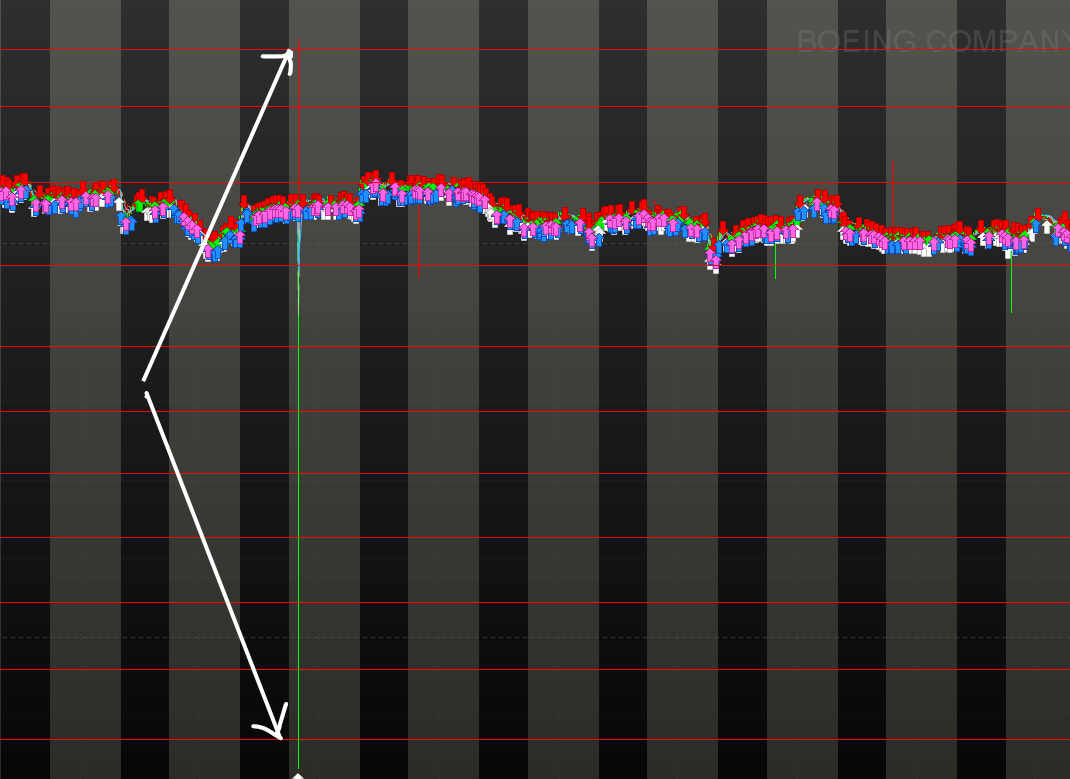
here’s a $100 BA candle. $133-$226, roughly.
Update on another dangerous example, AAPL yesterday. AAPL finished the day up about 1.95%, by PRT watchlist data feed, and others like Webull, Thinkorswim and TradingView. HOWever, the PRT daily candle printed for AAPL represents a 3% LOSS. As someone who relies heavily on levels of support and resistance, this kind of bad data makes PRT absolutely useless. If I traded a few tickers, it’d be easy enough to work around, but I review around 100 daily. Need a fix for these rogue candles, either with PRT or a different trading platform.