Hi Nils,
I’ve been working on something that seemed straightforward at first but turned into a much deeper rabbit hole than I expected, so I figured I’d share the journey in case anyone else wants to try something similar.
Most of us use oscillators the normal way, price comes in, indicator value comes out. I wanted to flip that around. Specifically for Constance Brown’s Composite Index, I wanted to know: where would the current bar need to close for the Composite to hit a specific value, say 100?
For those unfamiliar, the Composite is built like this:
- Take a 14-period RSI, then apply a 9-period Momentum to it
- Take a 3-period RSI, then smooth it with a 3-period simple moving average
- Add the two together
Simple enough to calculate forward. Turns out inverting it is a different story entirely.
So I thought it would be easy, but there’s a well-known technique for reverse-engineering a plain RSI, originally by Giorgos Siligardos. You unpack the Wilder smoothing one step, do some algebra, and out comes the price. I figured I’d just apply the same idea to the Composite. I was wrong 🙁
In fact, it’s actually hard!
Here’s the problem. When you try to invert the Composite, you end up with two RSI calculations that both depend on the same unknown price X:
- RSI14(X) appears in the Momentum component
- RSI3(X) appears in the moving average component
Each of them runs through its own Wilder smoothing chain with a different period. And because they’re both non-linear functions of the same unknown, you can’t separate them algebraically. Every time I tried to isolate X on one side of the equation, I’d end up with a mess of nested fractions that just couldn’t be untangled. There is genuinely no closed-form solution here. I’m not missing a trick, it just doesn’t exist.
So, instead, since Composite(X) always increases as price increases (higher price → higher RSI14 and RSI3 → higher Composite), the function is strictly monotonic. That means there’s exactly one price that hits any given target, and bisection will always find it.
The approach is:
- Freeze the Wilder state from the previous bar (those historical averages are known and fixed)
- For any trial price, manually compute what RSI14 and RSI3 would be after one Wilder update step
- Use that to evaluate the full Composite at any hypothetical price
- Run a bisection loop, halving the search bracket 50 times until the result converges
Fifty iterations gives precision far beyond anything meaningful for a price level, so convergence is not the issue.
The part that’s genuinely tricky to communicate on a chart
This is where it gets interesting, and honestly where I spent most of my time.
When you ask “where does price need to go to hit 100 on the Composite?”, there’s an implicit assumption that the answer is always some nearby, reachable price. That assumption is often wrong.
Because RSI14 uses 14-period Wilder smoothing, each new bar only shifts the running average by 1/14th. RSI3 is more reactive at 1/3 per bar, but still bounded between 0 and 100. The consequence is that on any given bar, the Composite has a hard floor and a hard ceiling, determined entirely by the current state of those two Wilder averages. And those bounds are often much tighter than you’d expect.
If the Composite is sitting at 20 and you ask for a target of 100, that might simply be impossible on the current bar. Not unlikely. Not impractical. Mathematically impossible, no matter how far price moves. The indicator can only move so far in a single bar.
My first attempt just let the bisection run anyway in those cases. It would find the bracket ceiling and return that as the answer, which on a DAX chart at 24,000 meant numbers like 120,000 showing up on the price axis. Not great.
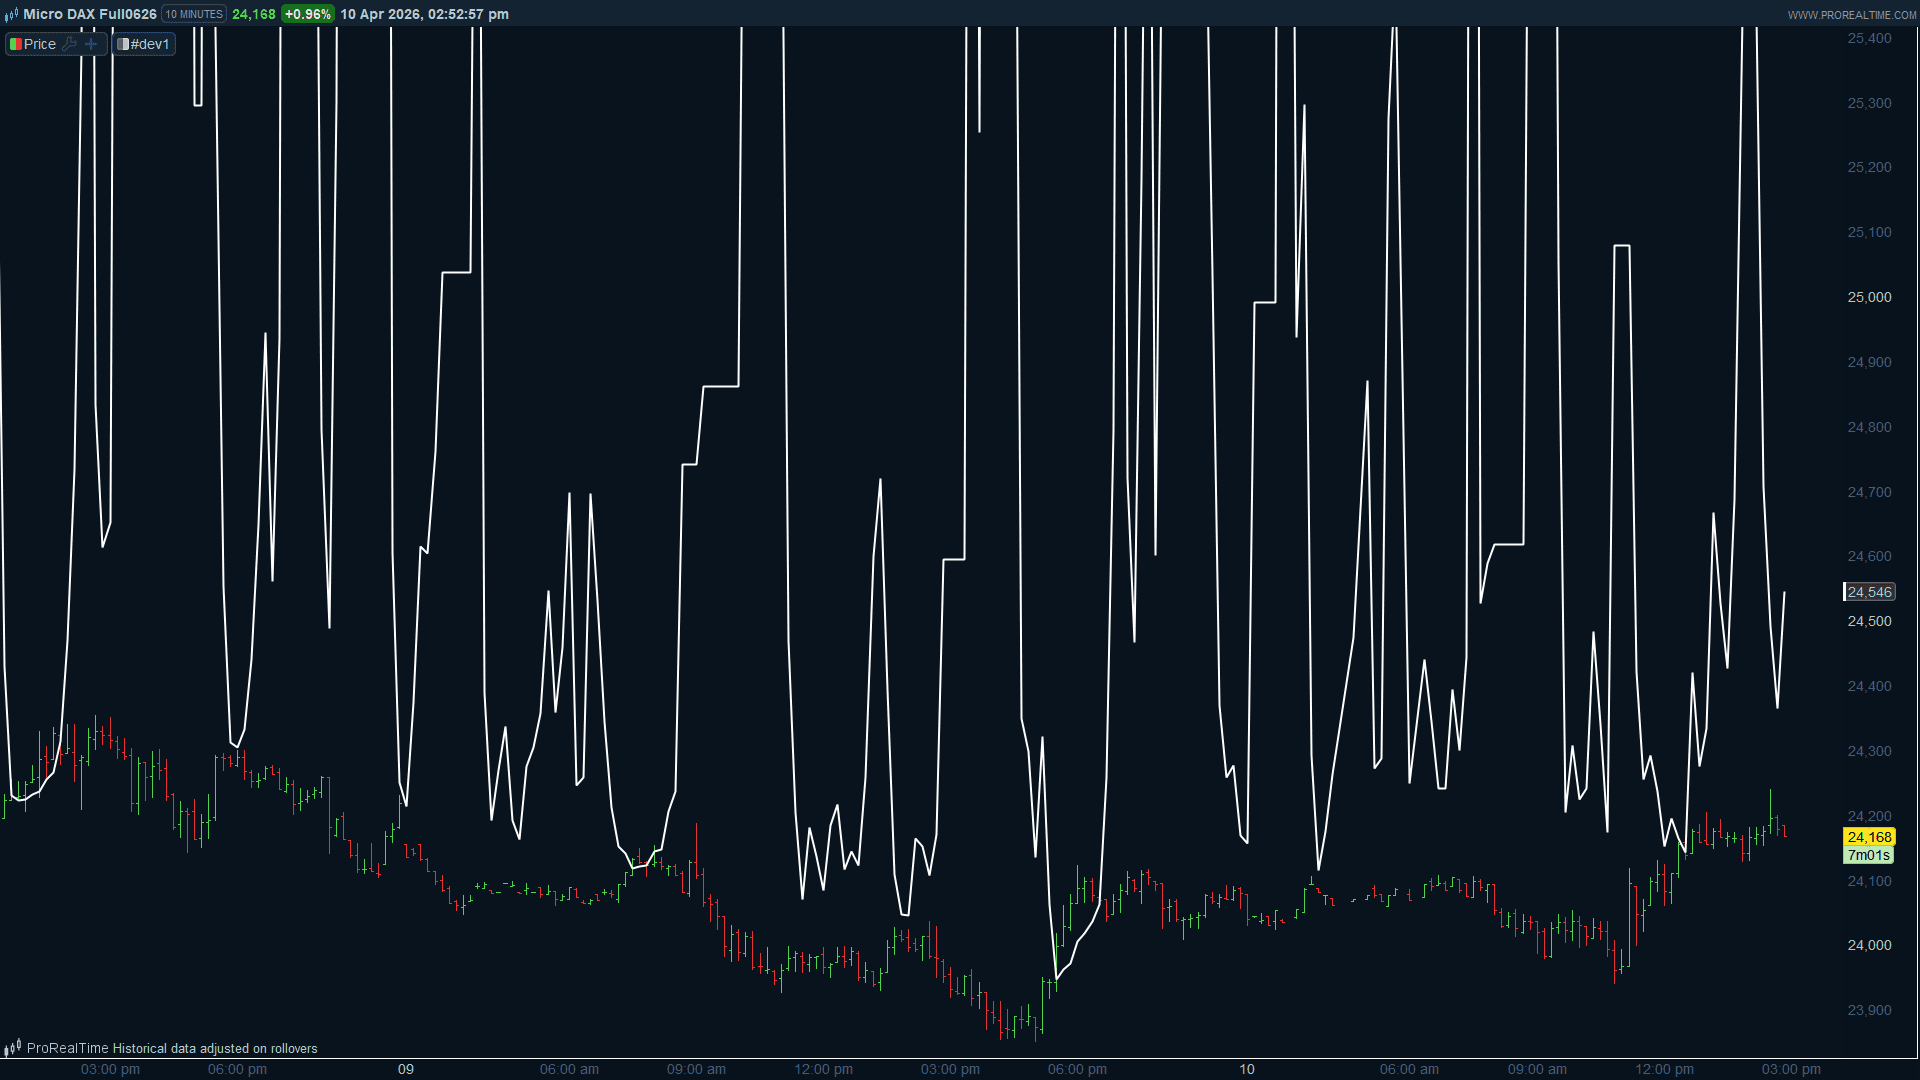
The fix was to stop pretending the target is reachable and instead show the closest the Composite can physically get. I evaluate the Composite at ±50% of the previous close (which covers any realistic single-bar move for a liquid instrument) and use those as the practical floor and ceiling. If the target falls outside that range, the indicator plots a dotted grey line at the boundary price instead of a solid white line at the target price. The dotted line is telling you: “your target is out of reach today, and this is as close as the market can get.”
The visual logic ends up being pretty clean:
- Solid white line → exact price needed to hit your target
- Dotted grey line → target is unreachable on this bar, here’s the physical limit
// Reverse Engineering Constance Brown's Composite Index
// Returns the price needed to hit CompTarget.
// If target is out of reach, ClampedPrice shows the nearest practically
// achievable price boundary, always within a realistic range of current price.

// ---- Parameters ----
CompTarget  = 100
RSI14Period = 14
RSI3Period  = 3
SMA3Period  = 3

// ---- Wilder coefficients ----
k14 = 1 / RSI14Period
k3  = 1 / RSI3Period

// ---- Frozen Wilder state entering the current bar ----
upOri14      = MAX(0, close - close[1])
downOri14    = MAX(0, close[1] - close)
upMA14       = WilderAverage[RSI14Period](upOri14)
downMA14     = WilderAverage[RSI14Period](downOri14)
upMA14prev   = upMA14[1]
downMA14prev = downMA14[1]

upOri3      = MAX(0, close - close[1])
downOri3    = MAX(0, close[1] - close)
upMA3       = WilderAverage[RSI3Period](upOri3)
downMA3     = WilderAverage[RSI3Period](downOri3)
upMA3prev   = upMA3[1]
downMA3prev = downMA3[1]

// ---- Fixed historical values ----
RSI14ago9 = RSI[RSI14Period](close)[9]
RSI3bar1  = RSI[RSI3Period](close)[1]
RSI3bar2  = RSI[RSI3Period](close)[2]

// ---- Practical bisection bracket ----
// close[1] * 0.5 to close[1] * 1.5 covers any realistic single-bar move.
// CompMin and CompMax are evaluated AT these boundaries, not at theoretical
// infinity, so clamped prices are always on scale.
loPrice = close[1] * 0.5
hiPrice = close[1] * 1.5

// ---- Composite at loPrice ----
upMoveL14   = MAX(0, loPrice - close[1])
downMoveL14 = MAX(0, close[1] - loPrice)
upMAL14     = upMA14prev*(1-k14) + upMoveL14*k14
downMAL14   = downMA14prev*(1-k14) + downMoveL14*k14
RSI14L      = 100 * upMAL14 / (upMAL14 + downMAL14)
upMoveL3    = MAX(0, loPrice - close[1])
downMoveL3  = MAX(0, close[1] - loPrice)
upMAL3      = upMA3prev*(1-k3) + upMoveL3*k3
downMAL3    = downMA3prev*(1-k3) + downMoveL3*k3
RSI3L       = 100 * upMAL3 / (upMAL3 + downMAL3)
CompAtLo    = (RSI14L - RSI14ago9) + (RSI3L + RSI3bar1 + RSI3bar2) / 3

// ---- Composite at hiPrice ----
upMoveH14   = MAX(0, hiPrice - close[1])
downMoveH14 = MAX(0, close[1] - hiPrice)
upMAH14     = upMA14prev*(1-k14) + upMoveH14*k14
downMAH14   = downMA14prev*(1-k14) + downMoveH14*k14
RSI14H      = 100 * upMAH14 / (upMAH14 + downMAH14)
upMoveH3    = MAX(0, hiPrice - close[1])
downMoveH3  = MAX(0, close[1] - hiPrice)
upMAH3      = upMA3prev*(1-k3) + upMoveH3*k3
downMAH3    = downMA3prev*(1-k3) + downMoveH3*k3
RSI3H       = 100 * upMAH3 / (upMAH3 + downMAH3)
CompAtHi    = (RSI14H - RSI14ago9) + (RSI3H + RSI3bar1 + RSI3bar2) / 3

// ---- Seed CompLoB for bisection ----
CompLoB = CompAtLo

// ---- Route: clamp or bisect ----
ExactPrice   = undefined
ClampedPrice = undefined

IF CompTarget <= CompAtLo THEN
   ClampedPrice = loPrice

ELSIF CompTarget >= CompAtHi THEN
   ClampedPrice = hiPrice

ELSE
   loB   = loPrice
   hiB   = hiPrice
   midB  = close
   iterB = 0

   WHILE iterB < 50 DO
      midB = (loB + hiB) / 2

      upMoveMid14   = MAX(0, midB - close[1])
      downMoveMid14 = MAX(0, close[1] - midB)
      upMAMid14     = upMA14prev*(1-k14) + upMoveMid14*k14
      downMAMid14   = downMA14prev*(1-k14) + downMoveMid14*k14
      RSI14Mid      = 100 * upMAMid14 / (upMAMid14 + downMAMid14)

      upMoveMid3    = MAX(0, midB - close[1])
      downMoveMid3  = MAX(0, close[1] - midB)
      upMAMid3      = upMA3prev*(1-k3) + upMoveMid3*k3
      downMAMid3    = downMA3prev*(1-k3) + downMoveMid3*k3
      RSI3Mid       = 100 * upMAMid3 / (upMAMid3 + downMAMid3)

      compMidB = (RSI14Mid - RSI14ago9) + (RSI3Mid + RSI3bar1 + RSI3bar2) / 3

      IF (compMidB - CompTarget) * (CompLoB - CompTarget) <= 0 THEN
         hiB = midB
      ELSE
         loB     = midB
         CompLoB = compMidB
      ENDIF

      iterB = iterB + 1
   WEND

   ExactPrice = midB
ENDIF

// ---- Live Composite for reference / verification ----
RSI14now  = RSI[RSI14Period](close)
RSI3now   = RSI[RSI3Period](close)
RSI3sma   = Average[SMA3Period](RSI3now)
RSIMO9now = RSI14now - RSI14ago9
CompNow   = RSIMO9now + RSI3sma

RETURN ExactPrice AS "Target Price (exact)" COLOURED(255,255,255), ClampedPrice AS "Target Price (clamped)" STYLE(dottedline) COLOURED(128,128,128), CompNow AS "Composite Now"