Hello,
In the following code, I am trying to obtain the current volume ratio to the average volume at the same hour.
The problem is that the indicator returns the ratio for the last bar. I want to return the ratio for each 5-minute intraday bar.
Do you have any solution ideas?
Instant volume ratio : Zratio3 indicator
mytime = 153000 // 15 hours 30 minutes

FOR i = 0 to IntradayBarIndex DO
mytime = mytime + 500 // add 5 minutes

if (myTime >= 156000 and myTime < 160000) then
myTime = 160000
endif
if (myTime >= 166000 and myTime < 170000) then
myTime = 170000
endif
if (myTime >= 176000 and myTime < 180000) then
myTime = 180000
endif
if (myTime >= 186000 and myTime < 190000) then
myTime = 190000
endif
if (myTime >= 196000 and myTime < 200000) then
myTime = 200000
ENDIF
if (myTime >= 206000 and myTime < 210000) then
myTime = 210000
ENDIF
if (myTime >= 216000 and myTime < 220000) then
myTime = 220000
endif

zratio = CALL "Zhisto3"[myTime]
$ZArray[i] = zratio

//DRAWSEGMENT(barindex[1], zratio, barindex, zratio )
NEXT

TIMEFRAME(5 minutes)

ratio = $ZArray[IntradayBarIndex ]

RETURN ratio
Zhisto3 indicator, called below :
TIMEFRAME(5 minutes)

hourstart=153000
hourend=varhourend

if opentime=hourstart then
vol20=vol19
vol19=vol18
vol18=vol17
vol17=vol16
vol16=vol15
vol15=vol14
vol14=vol13
vol13=vol12
vol12=vol11
vol11=vol10
vol10=vol9
vol9=vol8
vol8=vol7
vol7=vol6
vol6=vol5
vol5=vol4
vol4=vol3
vol3=vol2
vol2=vol1
vol1=vol0
vol0=volume
endif

if opentime>hourstart  and opentime<hourend  then
vol0=vol0[1]+volume
endif

if vol20<>0 then
averagevol =(vol1+vol2+vol3+vol4+vol5+vol6+vol7+vol8+vol9+vol10+vol11+vol12+vol13+vol14+vol15+vol16+vol17+vol18+vol19+vol20) / 20
hratio = (vol0 / averagevol ) * 100
hratio = round(hratio, 0)
endif

return hratio
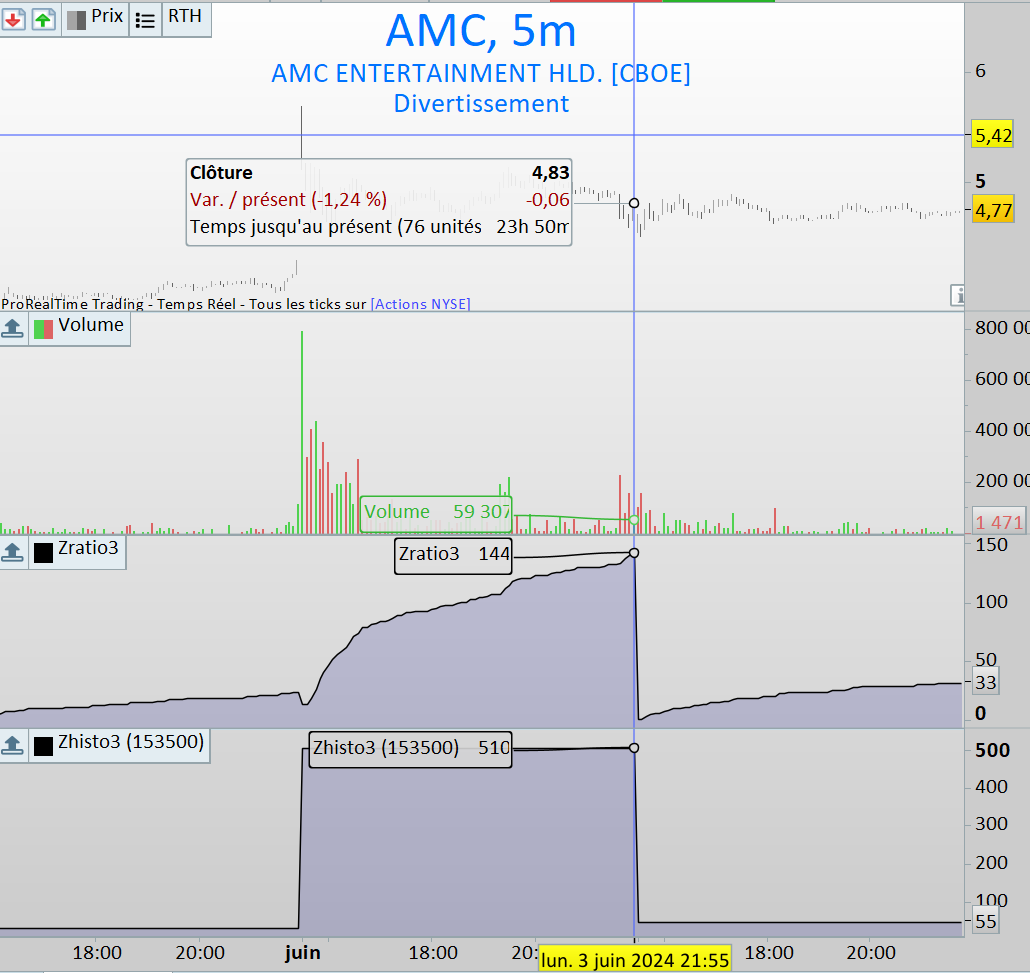
On the first 5 minutes bar, I’m expecting a 510 ratio value, which is the result of the Zhisto3 indicator with 153500 hour parameter
But I obtain 15 on the Zratio3 indicator for this first bar.
 JS
JSParticipant
Veteran
Hi,
The calculation of the “Instant Volume Ratio” with the “For” loop makes no sense, in the end you only calculate the last values… 🙂
The “Zhisto3 Indicator” has a time frame of 5 minutes, and the calculation is with 20 volumes…
Why 20 and not, for example, 12 (1 hour = 12 * 5 minutes) …
Can you also show some more values in the graph, for example first, middle and last values…
Hi
Thank you for your interest.
I use the FOR loop to store data in an array. I want to display each data on each bar but I don’t know how to do this.
You are right saying that in the end, it calculate the last values. I wish to calculate one for each bar.
The calculation is not on 20 volumes but on 20 days because of this instruction :
if opentime=hourstart then (reset each historical volume)
JSParticipant
Veteran
Can you indicate which values you use to arrive at a Ratio of 510?
I now have a “DailyVolume” which starts at 153000…
And I calculated an “AvgVolume” over 20 days…
AvgVolume=6,724,476.9 (153000) …?
AvgVolume=6,401,719.6 (153500) …?
JSParticipant
Veteran
I end up with these numbers…
Hi,
The average volume is calculated at the current hour.
The ratio of 510 is obtained on AMC US Stock at time 15:35, cumulating the first bar volume and the second bar on 5 minutes timeframe.
then this cumulative volume is divided by the average20days which is calculated à the same time, so 15:35 and x 100 to obtain a % value.
So 510 means 5,10 : the actual cumulative volume is 5 x greater than its average.
So the cumulative ratio is updated every 5 minutes but I wish to store its value on each 5m bar instead of having only the value for the last bar
Thank you again for your help
JSParticipant
Veteran
Hi Alex,
Try this indicator… (minimum 21 days of historical data needed)
TimeFrame(Daily)
Avg20DailyVolume=Average[20](Volume)

TimeFrame(5 minutes)
If OpenTime=153000 then
DailyVolume=Volume
EndIf

If OpenTime=>153500 then
DailyVolume=DailyVolume+Volume
EndIf

Ratio=(DailyVolume/Avg20DailyVolume)*100
Ratio=Round(Ratio,0)

Return DailyVolume as "DailyVolume",Avg20DailyVolume as "Avg20DailyVolume", Ratio as "Ratio"
Hi JS
Thank you, JS, for your proposal.
However, it doesn’t quite match what I’m looking for.
With your indicator, the 20-day average is calculated over the entire day.
I want to calculate the 20-day average at the same instant as the current 5-minute bar.
I can achieve this with the previous code.
What I can’t do is store the historical ratio for each 5-minute bar.
In fact, with each new bar, the new cumulative value overwrites the old one.
It’s this previous value that I want to assign to each bar in my ideal indicator.
That’s why I used an array to try to store each value. But it doesn’t work.
Do you think it’s possible to meet these rules in Probuilder?
JSParticipant
Veteran
Hi Alex,
Let’s take it one step at a time… 🙂
Does this calculation of the average correspond to what you expect…?
TimeFrame(5 minutes)

Avg20DailyVolume=Average[20](Volume)

//If OpenTime=153000 then
//DailyVolume=Volume
//EndIf
//
//If OpenTime=>153500 then
//DailyVolume=DailyVolume+Volume
//EndIf
//
//Ratio=(DailyVolume/Avg20DailyVolume)*100
//Ratio=Round(Ratio,0)

Return Avg20DailyVolume as "Avg20DailyVolume" //,DailyVolume as "DailyVolume", Ratio as "Ratio"
Hi JS,
No it doesn’t correspond to what I expect
In your last code, the average is calculated on 20 bars on 5m timeframe.
I want to calculate the average of CurrentDailyVolume on 20 days
TimeFrame(5 minutes)

If OpenTime=153000 then
CurrentDailyVolume=Volume
EndIf

If OpenTime>153000 then
CurrentDailyVolume = CurrentDailyVolume + Volume
EndIf

// HOW TO CALCULATE THE AVERAGE OF 20 DAYS OF CurrentDailyVolume ?
// my Zhisto3 indicator does, but I can't store the value it returns
JSParticipant
Veteran
Hi,
The average of 20 days of CurrentDailyVolume:
TimeFrame (5 min)
Avg20CurrentDailyVolume=Average[20*78](CurrentDailyVolume)
(78 x 5 min = 6,5 hour x 20 days)
Hi JS,
Thank you for your proposal and for helping me
Let me explain what it doesn’t meet my requirements
Instead of 20 days, let’s say I’ll calculate the average over the previous 3 days, to simplify.
TimeFrame(5 minutes)
Current day: it’s 16:00 June, the 7th
vol0 = CurrentDailyVolume = Cumulative volume of bars 0 to 5 (there are 6 five-minute bars between 15:30 and 16:00)
Day D-1 June, the 6th, always at 16:00
vol1 = CurrentDailyVolume(D-1) = Cumulative volume of bars 0 to 5 of day D-1
Day D-2
vol2 = CurrentDailyVolume(D-2) = Cumulative volume of bars 0 to 5 of day D-2
Day D-3
vol3 = CurrentDailyVolume(D-3) = Cumulative volume of bars 0 to 5 of day D-3
Average3daysCurrentDailyVolume = (vol1 + vol2 + vol3) / 3
This average must be displayed on 16:00 bar of actual day
Each bar must have its own average, so that the indicator curve does not constantly rise but reflects the average at instant t.
JSParticipant
Veteran
I am sorry Alex, but I really don’t understand what you’re looking for …
JSParticipant
Veteran
Hi Alex,
In the example below, the “red spikes” are the cumulative daily volume, at 16:00, of the last three volumes (as an example) and the green lines are the three-day average of the last three cumulative daily volumes (at 16:00)…
Is this what you’re looking for?
Hi,
This June 4th initial post feels the same as the question you asked on french forum before. If that’s the case, too late to delete it as “double post / double thread” (one of the forum guidelines in the yellow box at bottom of this page), but instead I’ll just take this opportunity to explain the main reason behind avoiding double posting even accross different languages forums is to have a single conversation instead of several parallel ones, and make users’ forum searches point to complete threads rather than parallel simultaneous-in-the-past ones. I understand not receiving an immediate reply in one language forum can generate desire to post it again as international, but without the no double- (or more) posting rule the forum would be a big mess, so the moderators volunteering in the community are asked to remind of that rule when it happens.
Moderation point aside, I see you posted here yesterday afternoon so I guess you didn’t see my reply on your french forum first post yesterday morning, here’s the link just in case:
Comparaison des volumes à une heure donnée
Have a good weekend