Voyons si cela peut aider :
//----------------------------------------------------------------------------//
//PRC_ZigZag & Fibonacci levels
//version = 0
//26.06.24
//Iván González @ www.prorealcode.com
//Sharing ProRealTime knowledge
//----------------------------------------------------------------------------//
//-----Inputs-----------------------------------------------------------------//
ZZpercent=1 //Boolean//Method for pivot points calculation
prd=15 //Periods for Donchian Channel and pivot calculation
percent=5 //Percentage for zigzag calculation
showpastFib=1 //Boolean//shows all zigzag and Fibo levels
showDN=1 //Boolean//shows fibo levels in a Uptrend
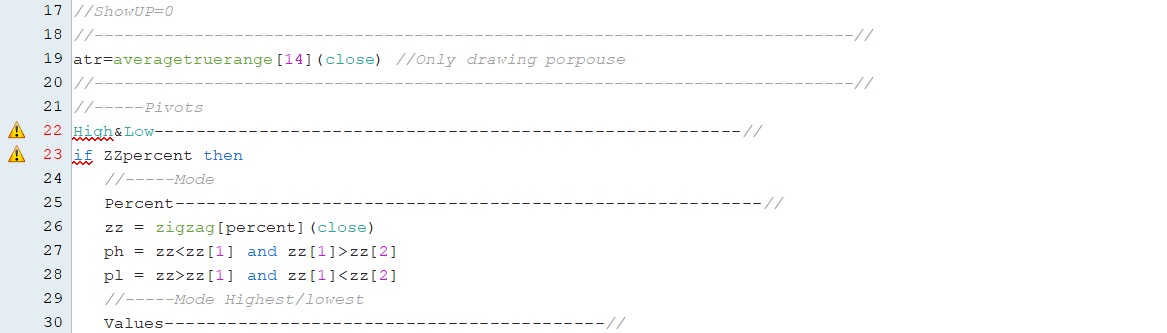
ShowUP=0 //Boolean//shows fibo levels in a Downtrend
//----------------------------------------------------------------------------//
atr=averagetruerange[14](close) //Only drawing porpouse
//----------------------------------------------------------------------------//
//-----Pivots High&Low--------------------------------------------------------//
if ZZpercent then
//-----Mode Percent--------------------------------------------------------//
zz = zigzag[percent](close)
ph = zz<zz[1] and zz[1]>zz[2]
pl = zz>zz[1] and zz[1]<zz[2]
//-----Mode Highest/lowest Values------------------------------------------//
else
ph = high=highest[prd](high)
pl = low=lowest[prd](low)
endif
//----------------------------------------------------------------------------//
//-----Direction Calculation--------------------------------------------------//
if ph and pl=0 then
dir=1
elsif pl and ph=0 then
dir=-1
else
dir=dir
endif
dirchanged=dir<>dir[1]
//----------------------------------------------------------------------------//
//-----Calculate Arrays for each pivot----------------------------------------//
if ph or pl then
if dirchanged then
if dir=1 and not ZZpercent then
$zigzag[t+1]=highest[prd](high)
$zigzagidx[t+1]=barindex
$dir[t+1]=1
t=t+1
elsif dir=-1 and not ZZpercent then
$zigzag[t+1]=lowest[prd](low)
$zigzagidx[t+1]=barindex
$dir[t+1]=-1
t=t+1
elsif dir=1 and ZZpercent then
$zigzag[t+1]=zz[1]
$zigzagidx[t+1]=barindex[1]
$dir[t+1]=1
t=t+1
elsif dir=-1 and ZZpercent then
$zigzag[t+1]=zz[1]
$zigzagidx[t+1]=barindex[1]
$dir[t+1]=-1
t=t+1
endif
else
if not ZZpercent then
if dir=1 and highest[prd](high)> $zigzag[t] then
$zigzag[t]=highest[prd](high)
$zigzagidx[t]=barindex
elsif dir=-1 and lowest[prd](low)< $zigzag[t] then
$zigzag[t]=lowest[prd](low)
$zigzagidx[t]=barindex
endif
endif
endif
endif
//----------------------------------------------------------------------------//
//-----Drawing conditions-----------------------------------------------------//
if islastbarupdate then
//-----Last Zig and Fibonacci Levels---------------------------------------//
drawsegment($zigzagidx[max(0,t-1)],$zigzag[max(0,t-1)],$zigzagidx[t],$zigzag[t])
if $dir[t]=1 then
//-----Calculation when trend Up----------------------------------------//
fib0=$zigzag[max(0,t-1)]
fib100=$zigzag[t]
diff=fib100-fib0
fib0236=fib100-diff*0.236
fib0382=fib100-diff*0.382
fib0500=fib100-diff*0.500
fib0618=fib100-diff*0.618
fib0786=fib100-diff*0.786
drawsegment($zigzagidx[max(0,t-1)],fib0,barindex+10,fib0)style(line,2)coloured("grey")
drawsegment($zigzagidx[max(0,t-1)],fib0236,barindex+10,fib0236)style(dottedline,1)coloured("grey")
drawsegment($zigzagidx[max(0,t-1)],fib0382,barindex+10,fib0382)style(dottedline,1)coloured("grey")
drawsegment($zigzagidx[max(0,t-1)],fib0500,barindex+10,fib0500)style(dottedline,2)coloured("blue")
drawsegment($zigzagidx[max(0,t-1)],fib0618,barindex+10,fib0618)style(dottedline,2)coloured("red")
drawsegment($zigzagidx[max(0,t-1)],fib0786,barindex+10,fib0786)style(dottedline,1)coloured("grey")
drawsegment($zigzagidx[max(0,t-1)],fib100,barindex+10,fib100)style(line,2)coloured("grey")
drawtext("Fib 0%: #fib0#",barindex+10,fib100+0.05*atr)
drawtext("Fib 50%: #fib0500#",barindex+10,fib0500+0.05*atr)
drawtext("Fib 100%: #fib100#",barindex+10,fib0+0.05*atr)
elsif $dir[t]=-1 then
//-----Calculation when trend Down--------------------------------------//
fib0=$zigzag[t]
fib100=$zigzag[max(0,t-1)]
diff=fib100-fib0
fib0236=fib0+diff*0.236
fib0382=fib0+diff*0.382
fib0500=fib0+diff*0.500
fib0618=fib0+diff*0.618
fib0786=fib0+diff*0.786
drawsegment($zigzagidx[max(0,t-1)],fib0,barindex+10,fib0)style(line,2)coloured("grey")
drawsegment($zigzagidx[max(0,t-1)],fib0236,barindex+10,fib0236)style(dottedline,1)coloured("grey")
drawsegment($zigzagidx[max(0,t-1)],fib0382,barindex+10,fib0382)style(dottedline,1)coloured("grey")
drawsegment($zigzagidx[max(0,t-1)],fib0500,barindex+10,fib0500)style(dottedline,2)coloured("blue")
drawsegment($zigzagidx[max(0,t-1)],fib0618,barindex+10,fib0618)style(dottedline,2)coloured("red")
drawsegment($zigzagidx[max(0,t-1)],fib0786,barindex+10,fib0786)style(dottedline,1)coloured("grey")
drawsegment($zigzagidx[max(0,t-1)],fib100,barindex+10,fib100)style(line,2)coloured("grey")
drawtext("Fib 0%: #fib0#",barindex+10,fib0+0.05*atr)
drawtext("Fib 50%: #fib0500#",barindex+10,fib0500+0.05*atr)
drawtext("Fib 100%: #fib100#",barindex+10,fib100+0.05*atr)
endif
//-----Draw all Fibonacci levels and ZigZag-----------------------------------------//
if showpastFib then
for i=t-1 downto 1 do
//----------------------------------------------------------------------------//
drawsegment($zigzagidx[max(0,i-1)],$zigzag[max(0,i-1)],$zigzagidx[i],$zigzag[i])
//-----Show Fibonacci when trend Up-------------------------------------------//
if $dir[i]=1 and showDN then
fib0=$zigzag[i-1]
fib100=$zigzag[i]
diff=fib100-fib0
fib0236=fib100-diff*0.236
fib0382=fib100-diff*0.382
fib0500=fib100-diff*0.500
fib0618=fib100-diff*0.618
fib0786=fib100-diff*0.786
drawsegment($zigzagidx[i-1],fib0,$zigzagidx[i+1],fib0)style(line,2)coloured("grey")
drawsegment($zigzagidx[i-1],fib0236,$zigzagidx[i+1],fib0236)style(dottedline,1)coloured("grey")
drawsegment($zigzagidx[i-1],fib0382,$zigzagidx[i+1],fib0382)style(dottedline,1)coloured("grey")
drawsegment($zigzagidx[i-1],fib0500,$zigzagidx[i+1],fib0500)style(dottedline,2)coloured("blue")
drawsegment($zigzagidx[i-1],fib0618,$zigzagidx[i+1],fib0618)style(dottedline,2)coloured("red")
drawsegment($zigzagidx[i-1],fib0786,$zigzagidx[i+1],fib0786)style(dottedline,1)coloured("grey")
drawsegment($zigzagidx[i-1],fib100,$zigzagidx[i+1],fib100)style(line,2)coloured("grey")
drawtext("Fib 0%",$zigzagidx[i],fib100+0.05*atr)
drawtext("Fib 50%",$zigzagidx[i],fib0500+0.05*atr)
drawtext("Fib 100%",$zigzagidx[i],fib0+0.05*atr)
//-----Show Fibonacci when trend Down-----------------------------------------//
elsif $dir[i]=-1 and ShowUP then
fib0=$zigzag[i]
fib100=$zigzag[i-1]
diff=fib100-fib0
fib0236=fib0+diff*0.236
fib0382=fib0+diff*0.382
fib0500=fib0+diff*0.500
fib0618=fib0+diff*0.618
fib0786=fib0+diff*0.786
drawsegment($zigzagidx[i-1],fib0,$zigzagidx[i+1],fib0)style(line,2)coloured("grey")
drawsegment($zigzagidx[i-1],fib0236,$zigzagidx[i+1],fib0236)style(dottedline,1)coloured("grey")
drawsegment($zigzagidx[i-1],fib0382,$zigzagidx[i+1],fib0382)style(dottedline,1)coloured("grey")
drawsegment($zigzagidx[i-1],fib0500,$zigzagidx[i+1],fib0500)style(dottedline,2)coloured("blue")
drawsegment($zigzagidx[i-1],fib0618,$zigzagidx[i+1],fib0618)style(dottedline,2)coloured("red")
drawsegment($zigzagidx[i-1],fib0786,$zigzagidx[i+1],fib0786)style(dottedline,1)coloured("grey")
drawsegment($zigzagidx[i-1],fib100,$zigzagidx[i+1],fib100)style(line,2)coloured("grey")
drawtext("Fib 0%",$zigzagidx[i],fib0+0.05*atr)
drawtext("Fib 50%",$zigzagidx[i],fib0500+0.05*atr)
drawtext("Fib 100%",$zigzagidx[i],fib100+0.05*atr)
endif
next
endif
endif
return
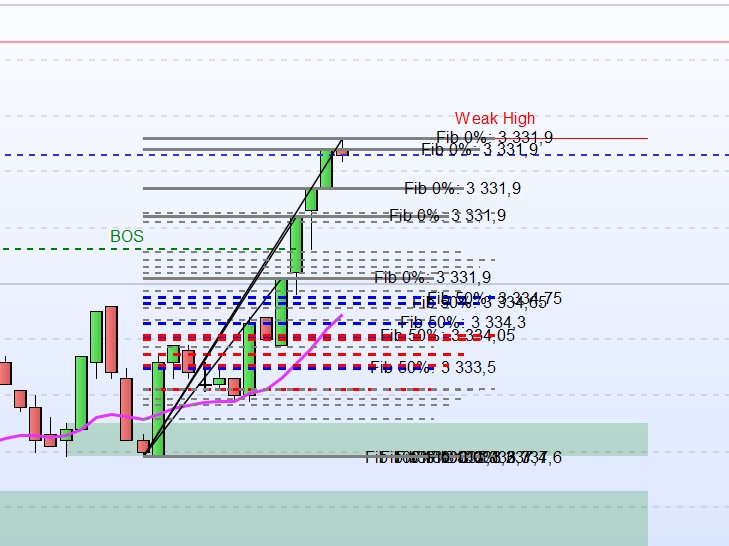
vous avez le code itf ici :
Zigzag & Fibonacci Levels: Indicator for Detecting Key Market Levels