Copy/paste of the description found:
As you may have noticed, a number of rather complicated indicators are available to measure trend strength. None of these indicators, unfortunately, is perfect. You could use J. Welles Wilder’s average directional index (ADX) as an indicator of trend strength, or perhaps the r² value from linear regression analysis. Or you could even use the vertical horizontal filter (VHF) to help determine whether the market is trending.
Each of these indicators requires the user to determine how many days’ data should be used in the calculations. As you vary the indicator length or number of days used in the calculation, however, the result of the calculation changes also. Thus, there is no unambiguous answer. If the market were about to enter or leave a trading range, you could get a different indication of trend strength every day — a frustrating set of circumstances.
RATING THE TREND
Here is my way of rating a trend, a method I call trendscore. If today’s close is greater than or equal to the close x days ago, score one point. If today’s close is less than the close x days ago, the trend’s rating loses one point. Next, compare today’s close to the close x+1 days ago. If today’s close is greater than or equal to that close, score another point. Deduct one point if the close is lower than the prior close.
If (today’s close >= close x days ago) then score = 1
If (today’s close < close x days ago) then score = -1
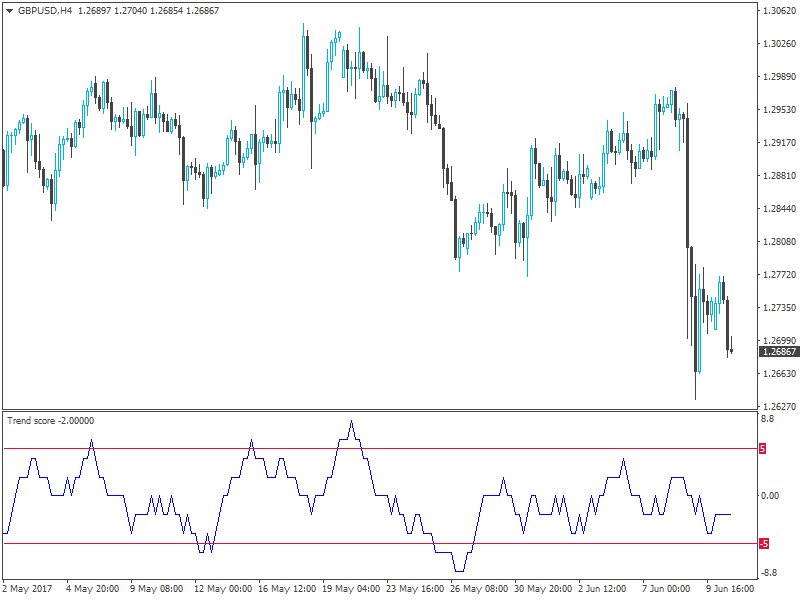
Add up the score for 10 comparisons; the score varies from + 10 to -10. If today’s close is greater than all the previous closes, then the trend’s score is +10; if today’s close is less than all the previous closes, the score is -10. You could smooth? the data by adding fewer than 10 days or more than 10 days. Trendscore = 10-day sum of scores from days 11 to 20 I begin my calculations at 11 days back from the present and go back another 10 days. Thus, I compare today’s close to the closes from 11 to 20 days ago. If today’s close is greater than all 10 closes, then the trend’s score is +10. If today’s close is less than the closes from 11 to 20 days ago, then the trend’s score is -10. In sideways markets, the score ranges from +10 to -10. A positive score shows an upward trend bias. Similarly, a negative score shows a downward bias. I prefer the 11- to 20-day period because it fits my trading horizon. A shorter time of comparison may be too volatile, producing frequent trend change signals, while a longer comparison time is slow to respond. During long trends, the trendscore remains at the outer limits, +10 or -10, for the duration of the trend. In sideways markets, the score doesn’t remain at +10 or -10 for long, oscillating between these limits.
How to Use this Indicator
You could trade the trendscore many ways. You could use the zero crossing as an early signal. You would then buy when the trendscore becomes positive and sell when it becomes negative. Or you could wait one to three days after the trendscore reaches +10 or -10 before buying (+ 10) or selling (-10) . Or you could combine the trendscore with a moving average, trading an upward or downward cross over.
Another variation would be to go long after the trendscore crosses from -10 to above +5 and go short after the trendscore falls from +10 to below 5. The approach you choose depends on your trading style. You could also smooth the trendscore with more or fewer days than I used in my calculations. You could, for example, use fewer than 10 days for short-term and 20 to 30 days for intermediate-term trading. You could also combine trendscore with other indicators of trend strength. For example, if you combined it with the VHF indicator, trendscore would provide an indication of direction, while the VHF could provide additional information about the trend’s strength. You could also substitute intraday data in the trendscore method for short-term trading, using hourly data to calculate a trend’s score instead of daily data. Trendscore is a simple way to rate trend strength. It indicates both the direction and strength of the trend and can be easily combined with various trend-following strategies.
I will have a look at the Amibroker code, thanks @petrus.