I expect the problem is with the trail
//trailing stop function
trailingstart = 13 //15.7 //trailing will start @trailinstart points profit
trailingstep = 2.9 //trailing step to move the "stoploss"
if it starts at 13 points but adds 2.9 to the open it’s too close to the 10 minimum.
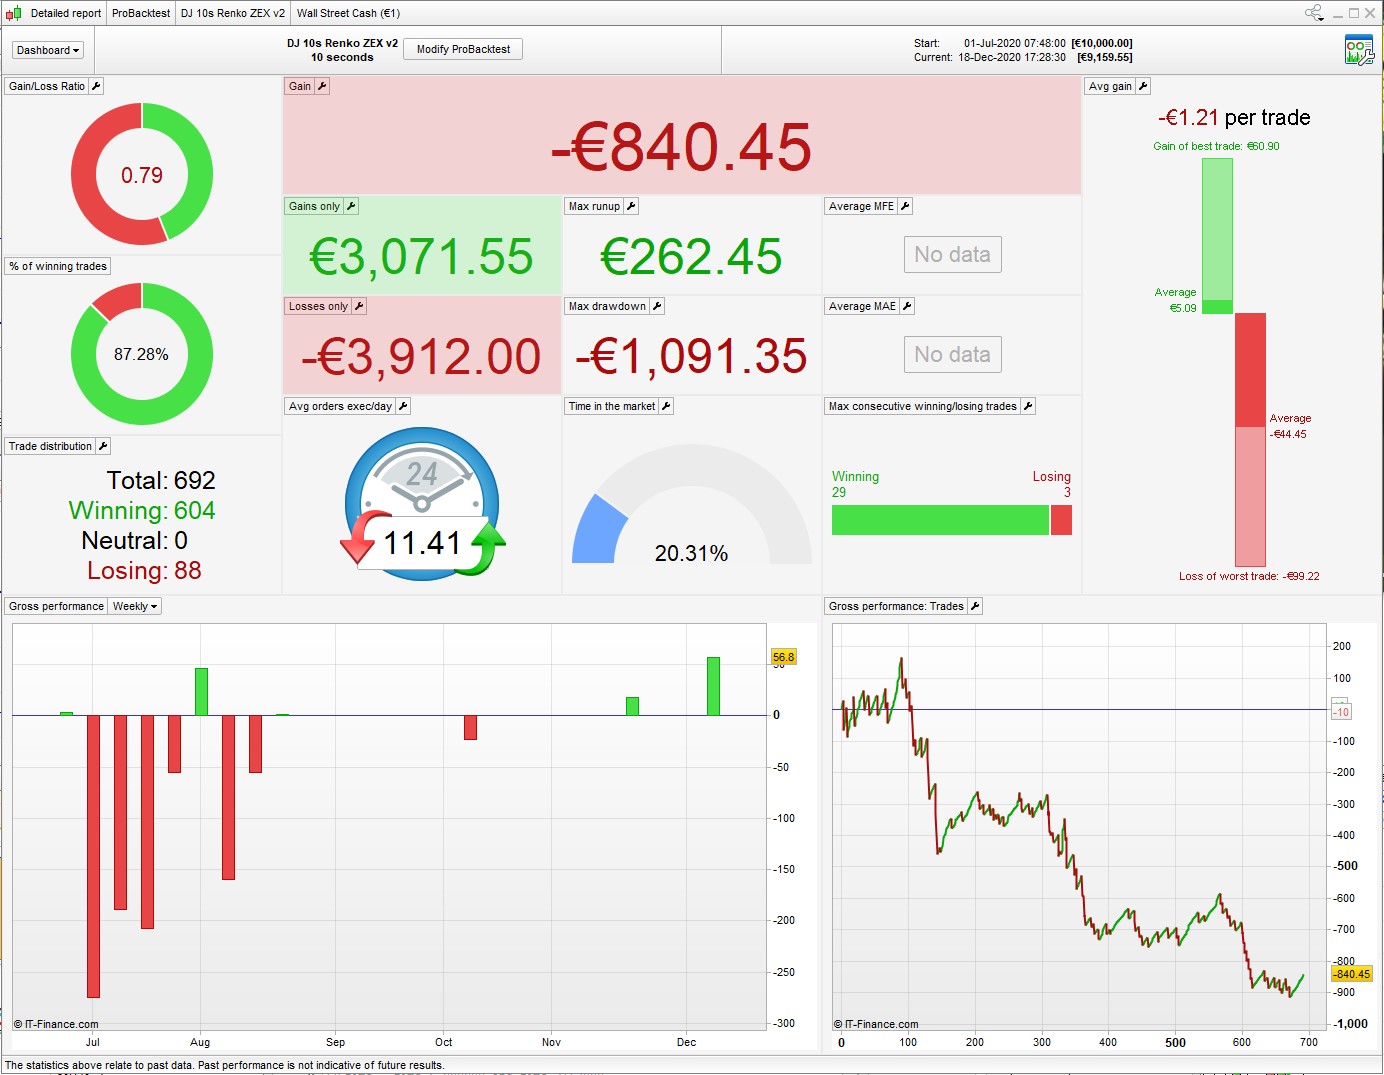
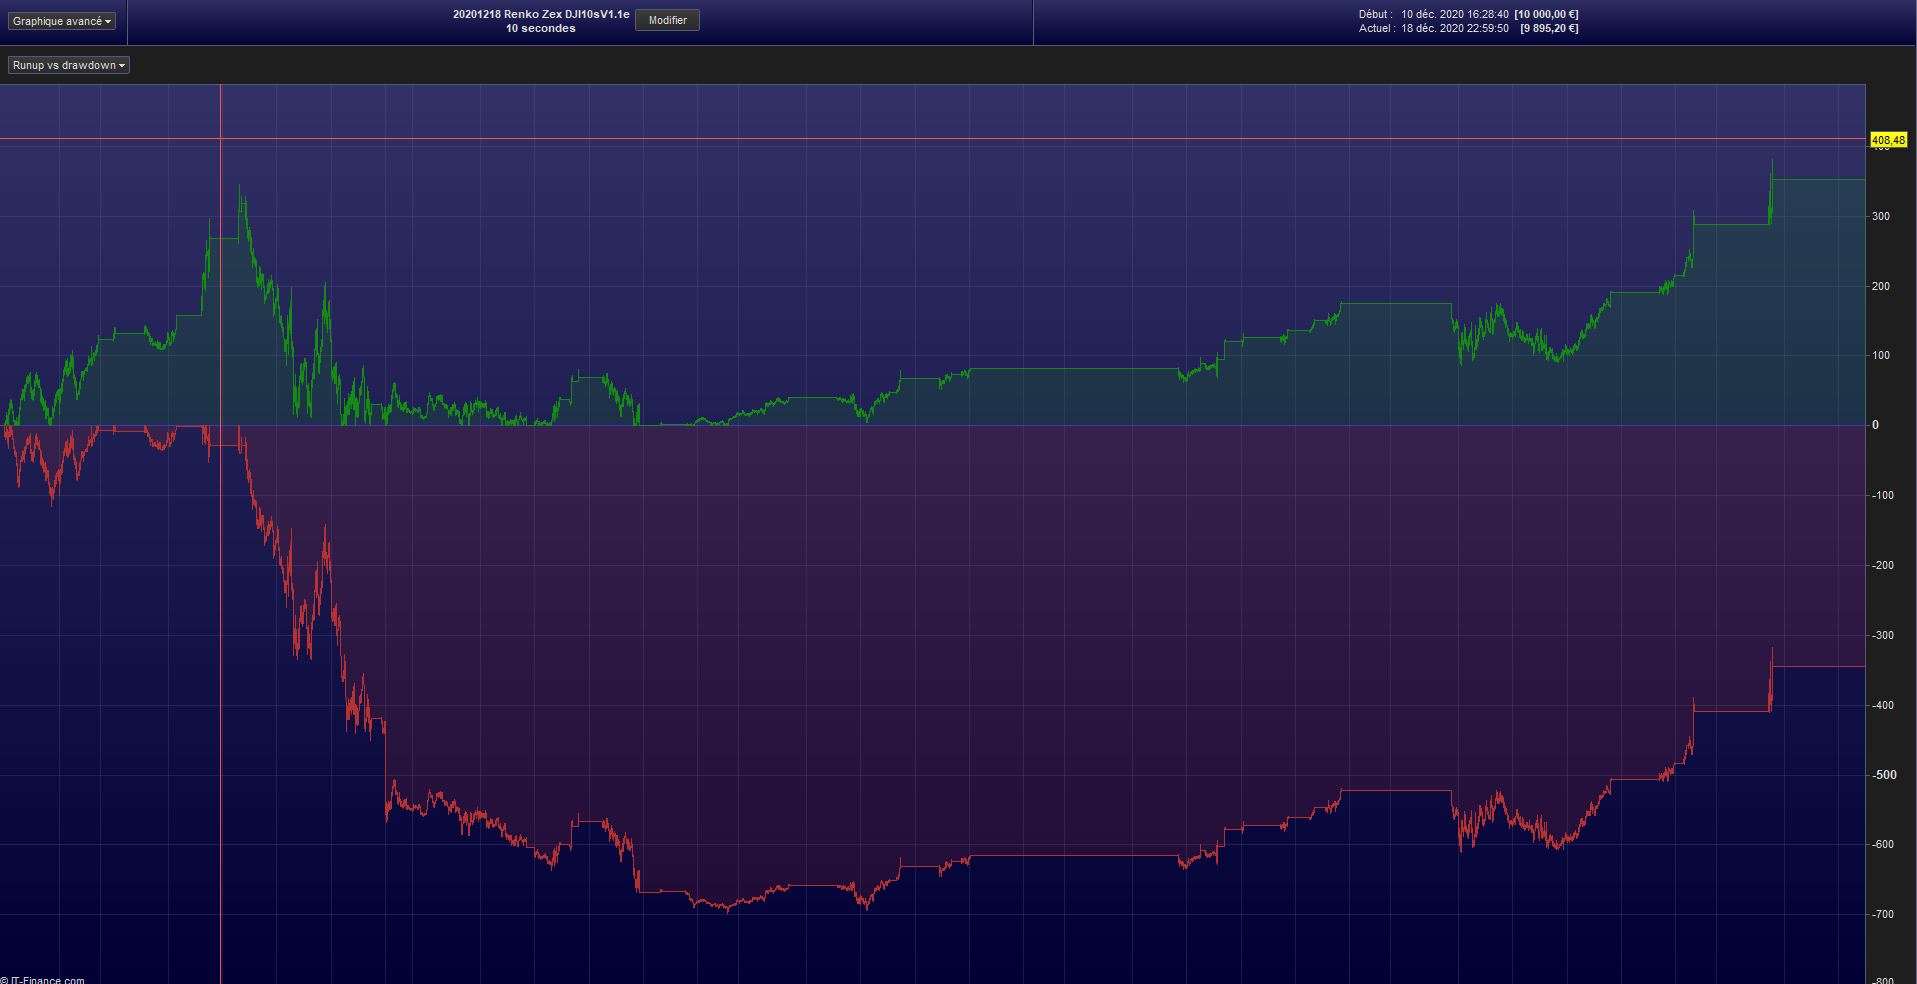
But there’s a bigger problem, see attached 6 month backtest. These 10 sec algos almost never work for any length of time.
(this is snucke’s MySystem1 – I renamed it)
That makes sense, I set the trailingstart = 20 now just to be sure. The results of the backtest certainly don’t look great. The average loss per losing trade is really high compared to the average gain of winning trades.
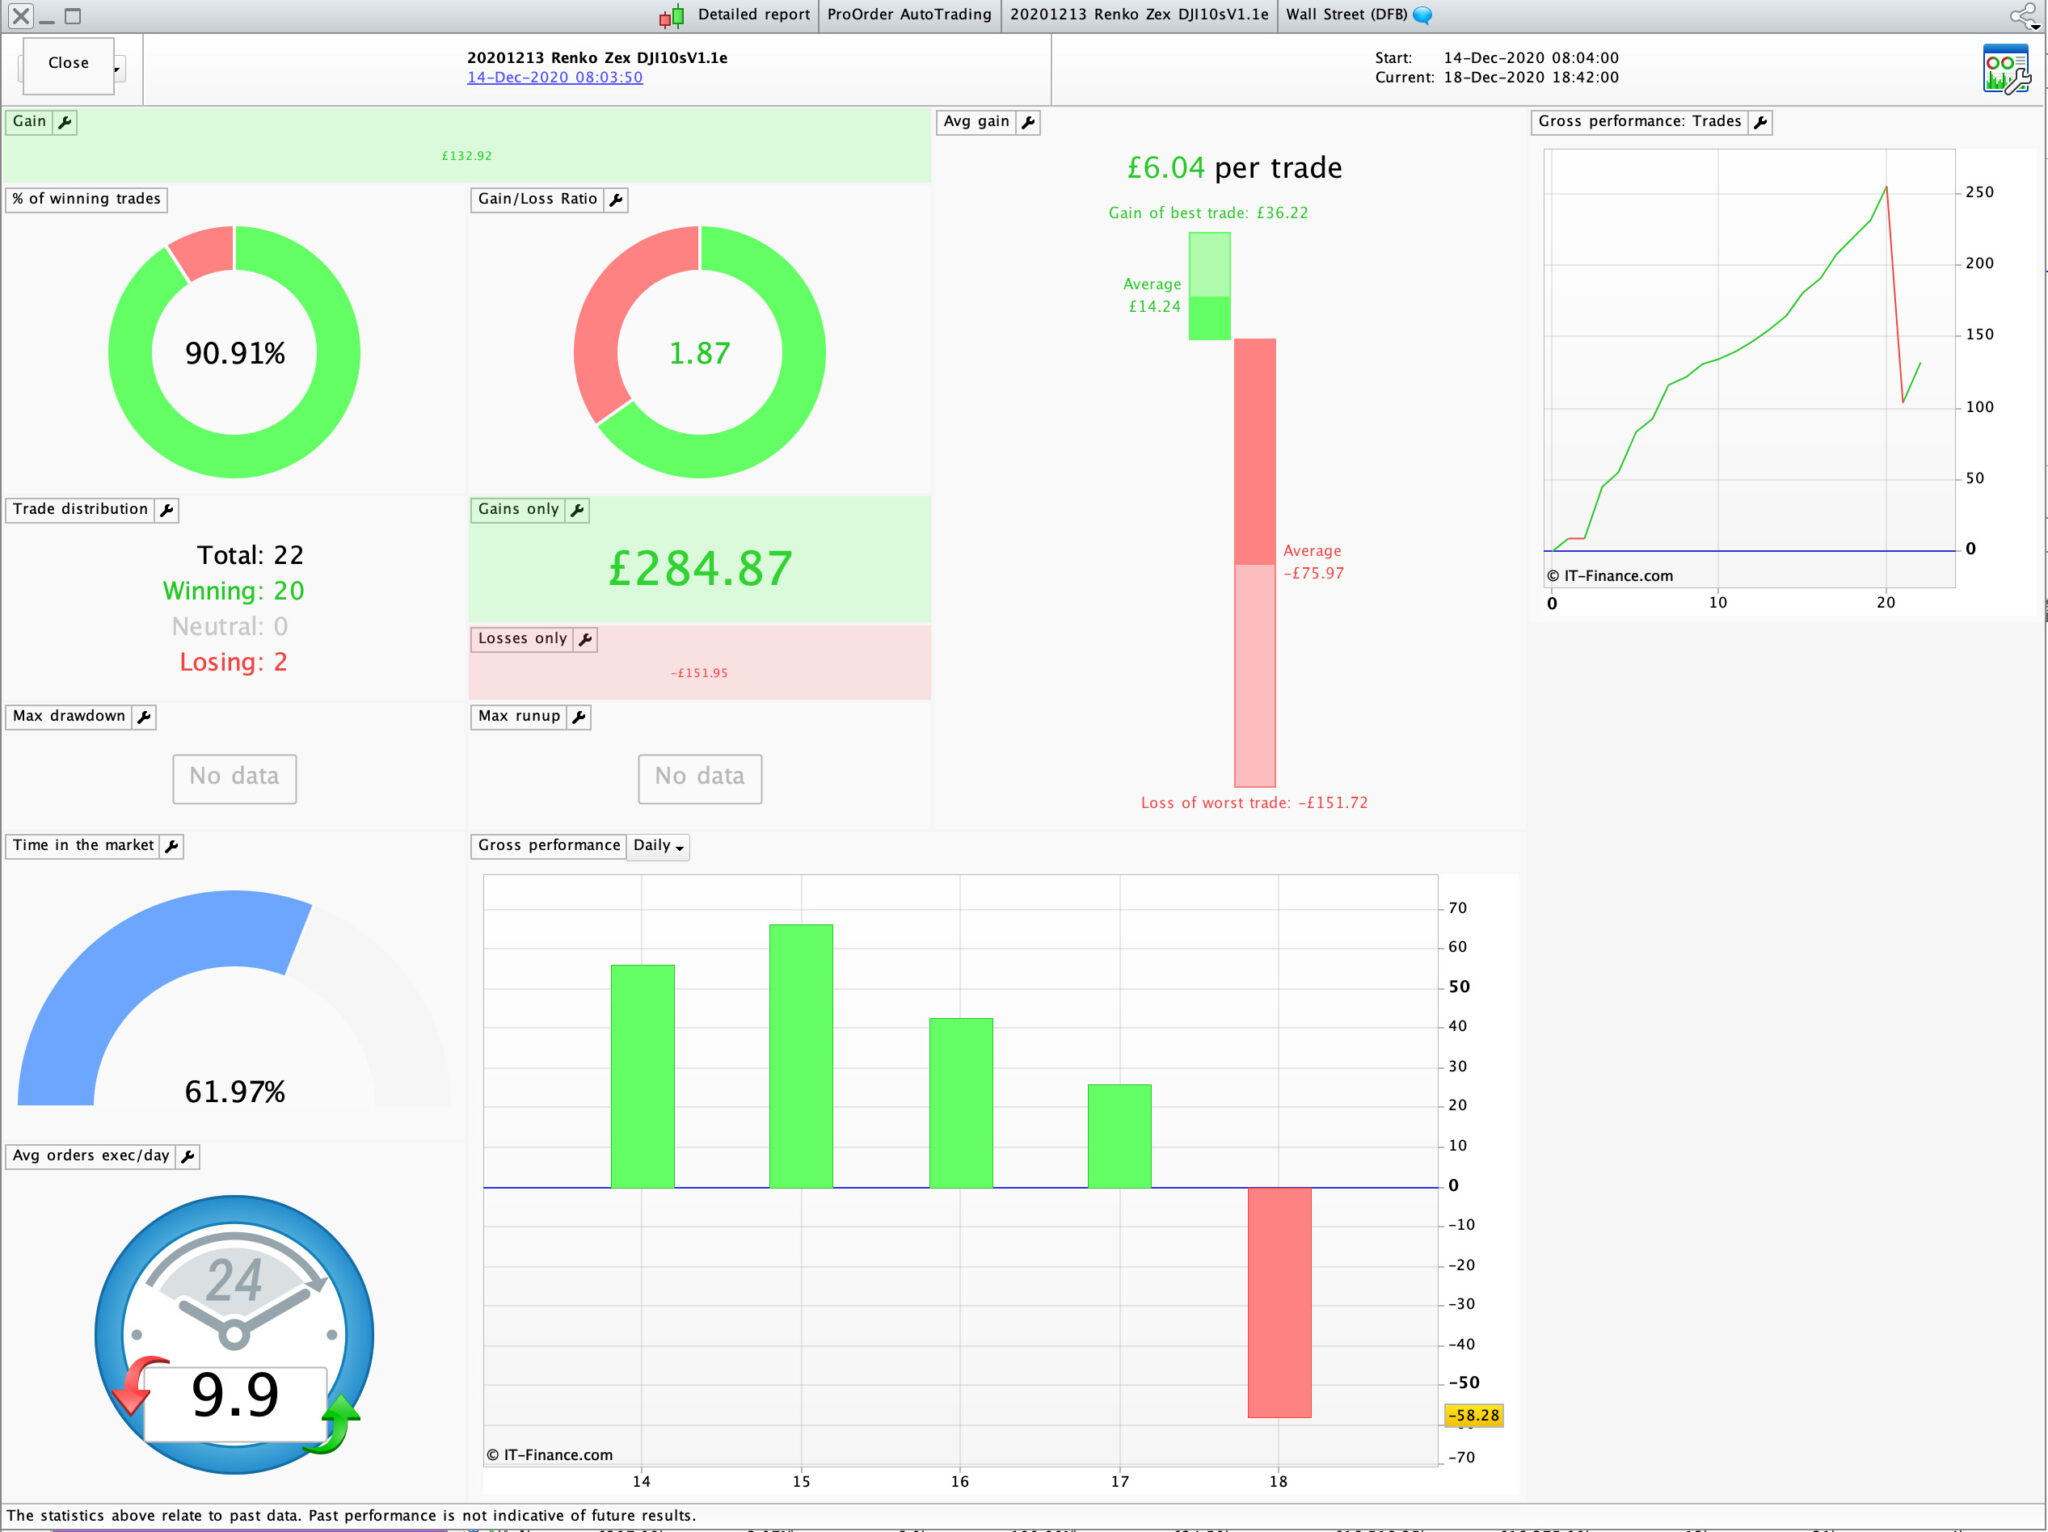
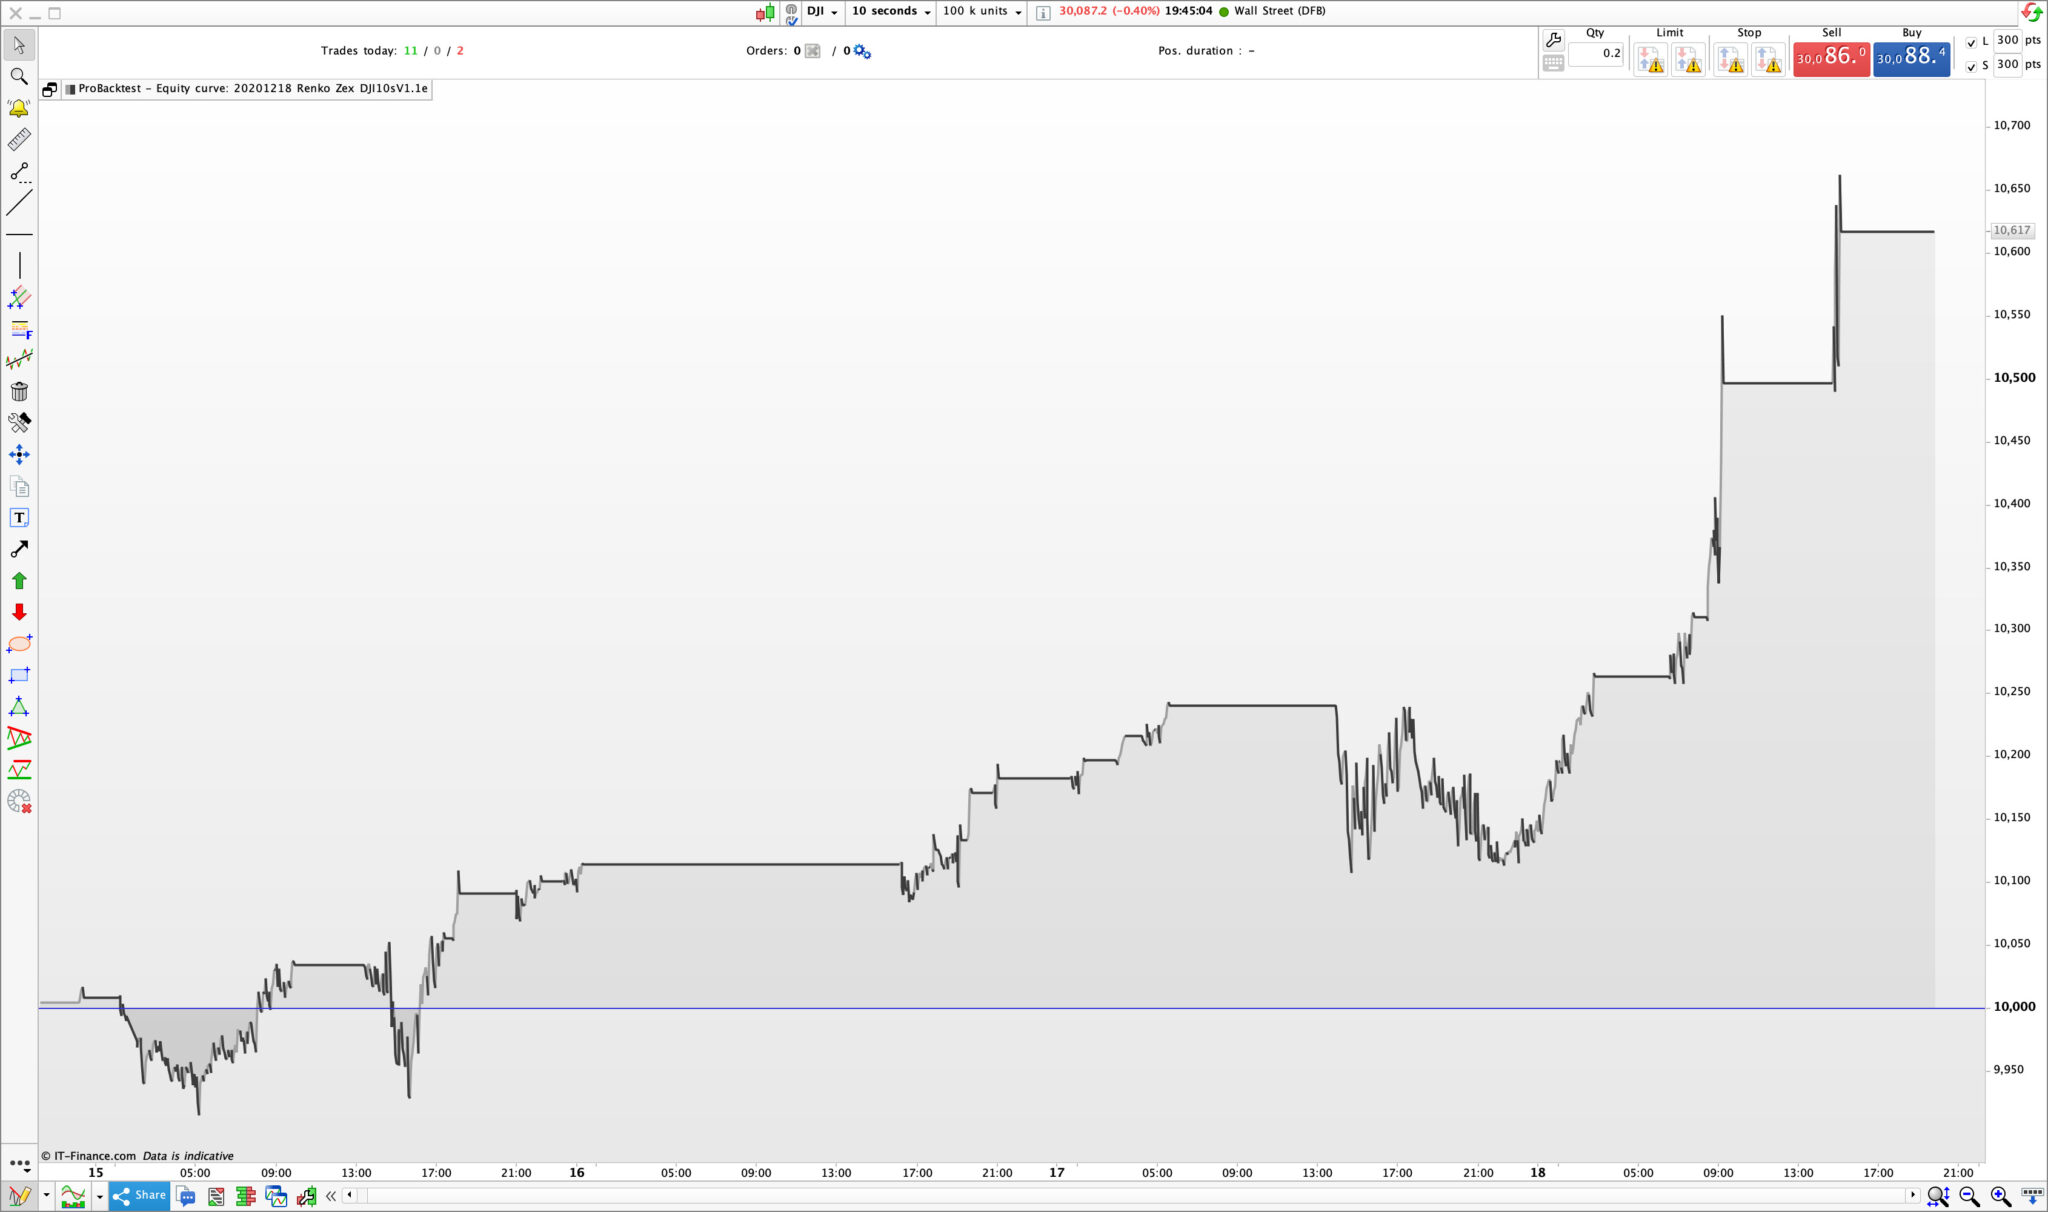
Here’s my result in live trading first 5 days. I agree with Nonetheless that these 10s systems are bound to fail after certain amount of days. But then as Grahal has previously mentioned, one would expect to have to re-optimise the system within a certain timeframe, as much as you would with any other system. Just that you have to re-optimise sooner, maybe after 1-2 weeks rather than every few months. My goal is to come up with a 10s system that only needs 1 parameter optimised to give good results. I need to work on the stop loss, as although this system has a high win rate it loses big when it loses.
Interestingly the backtest performed just now with the same parameters as my live code didn’t show the big loss that happened today. Does anyone know what could cause that?
Sorry, I should replace the custom indicator so that it will run without having this installed. I will work on that and re-post if I can get same results.
To add to my comment above, the system I’m running now seem to work well when 12:1 filter #2 is optimised. All other settings stays the same, renko box size etc. I will be experimenting with the machine learning code posted on these forums to see if it could work, but I have to say that I’m not 100% sure I know how to come up with the right values for the ML code.
That’s really nice to see eckaw! The re-optimization one could definitely live with. I guess the next thing would be to find out which of the parameters need to be re-optimized each week but it is really interesting that so far you only had to optimize one of the variables.
The one I’m running failed again on demo. eckaw, don’t you have minimum stop distance limits with your broker? If you do, which parameters do you tune for that limit to be respected? I tried the suggestion of nonetheless but it didn’t work.
Hej @DjungelJarl (Jag är också svensk!)
To be really honest I don’t know what my minimum stop distance is with IG, however I am aware that there is one. I simply ran the code as it was presented here – The stop loss is defined in the Van Tharp’s money management code at the top.
As I mentioned previously, I will replace the trend filter so that the version I post can be modified by others here, if anyone would like to collaborate on it.
Hej! Seems we swedes are all over the place even though you’re flying the wrong flag 🙂
That’s really odd! That it’s working for you without failure but not for me. Perhaps the stops behave slightly differently depending on if you run on live or demo. By the way, I was able to run your latest posted version without any problem, did you already replace the trend filter?
On the topic of machine learning, it’s a really exciting thought having a snippet of code simulate the algorithm itself every x days and re-optimizing. Surely someone must have done something similar before or perhaps the array limitations are what makes it difficult, although being able to index past bars with a variable (e.g. close[i]) should be enough.
Yes, born in Sweden but been living in London since 2004 and now I have dual nationality so I’m also British (due to the Brexit drama..)
I just went back to the code and realised this last version doesn’t have the custom indicator included, sorry for the confusion. I’m also not 100% sure if the price action filter under 60 minutes is correct. It seems to work but might need to be looked at.
My idea (hope) is that we only need to optimise “Period2” under 12:1 #2 on line 91.
I’m still puzzled to why the backtest doesn’t show the big loss that happened today. The settings are all the same.
Regarding ML, I believe @juanj is using it successfully when only optimising one parameter.
@eckaw Thank you for all the work!
@DjungelJarl Hey I actually meet the same issue as you do.
Runs well on live but will constantly crash on demo. I have an IG account.
I believe it’s to do with the stops as you said. Sometimes, on my demo account, the (guaranteed) stops have to be at least 1% when it’s maybe 10-12 on my live account. No idea why though
@eckaw Ah I see! That sounds pretty practical nonetheless, best of both worlds 🙂
About the loss not showing up, I guess you’re running it in tick by tick mode? Otherwise I don’t know.
@BobOgden That’s so strange. One would want them to behave the same otherwise it takes away some of the backtesting… I don’t use guaranteed stops when I run them on demo, do you think it would interfere despite of this??
@DjungelJarl Well I’ve tried both, with and without guaranteed stops on demo, with and without the readjustments of stoplosses and it just won’t work so no, I don’t think it’ll help
(except if for some reason unknown to me, the non-guaranteed stoplosses actually become guaranteed because… well idk… maybe the IG account does that? I’m confused tbh haha)
@BobOgden That’s very frustrating haha! I’ll just have to run everything live then 😉
@eckaw In what manner do you optimize “Period2”? WF, last 200k bars, etc. I’m also experimenting with your code now, trying different optimization setups. If I understood you correctly, since the two filters are working against each other, we only need to optimize one of them rather then both since we would anyway receive a similar effect optimizing both rather then only one of them?
As BobOgden also said, nice work!
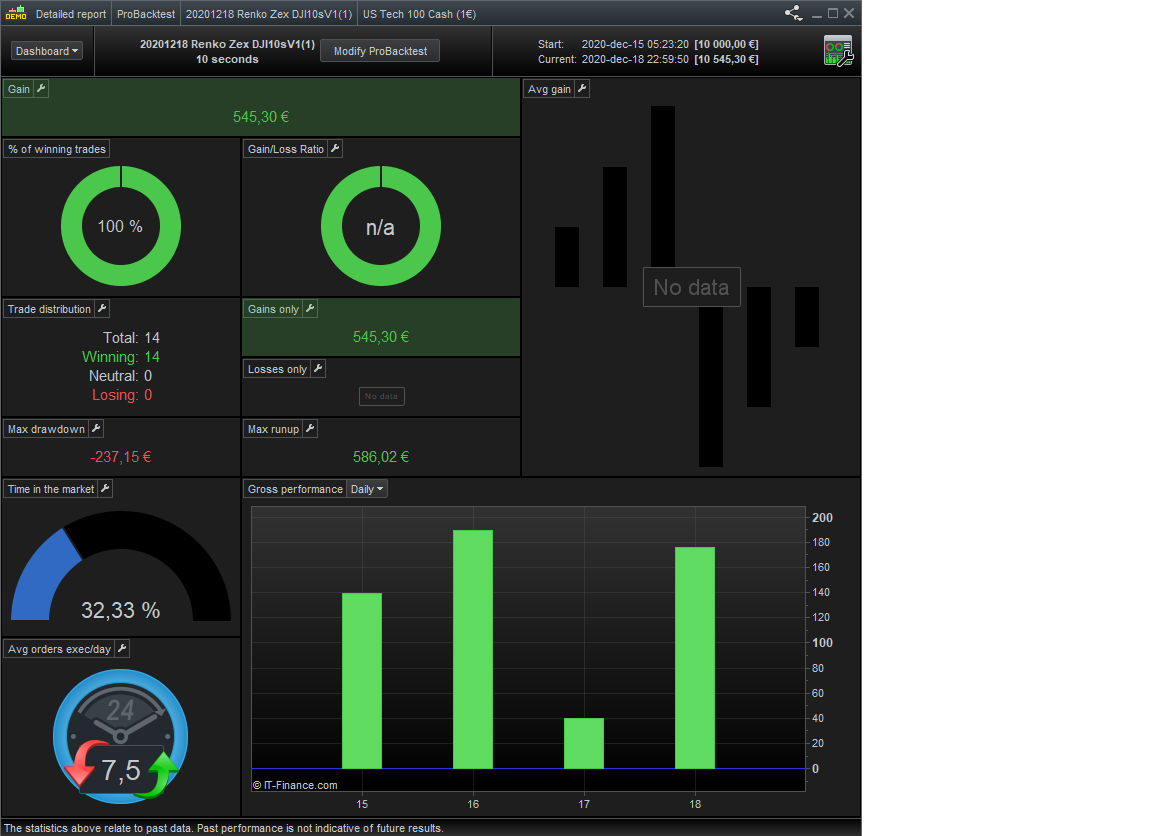
Running it on US TECH 100 while only optimizing Period2 also yields nice results for the last days albeit with a lower trade count than for wall street.
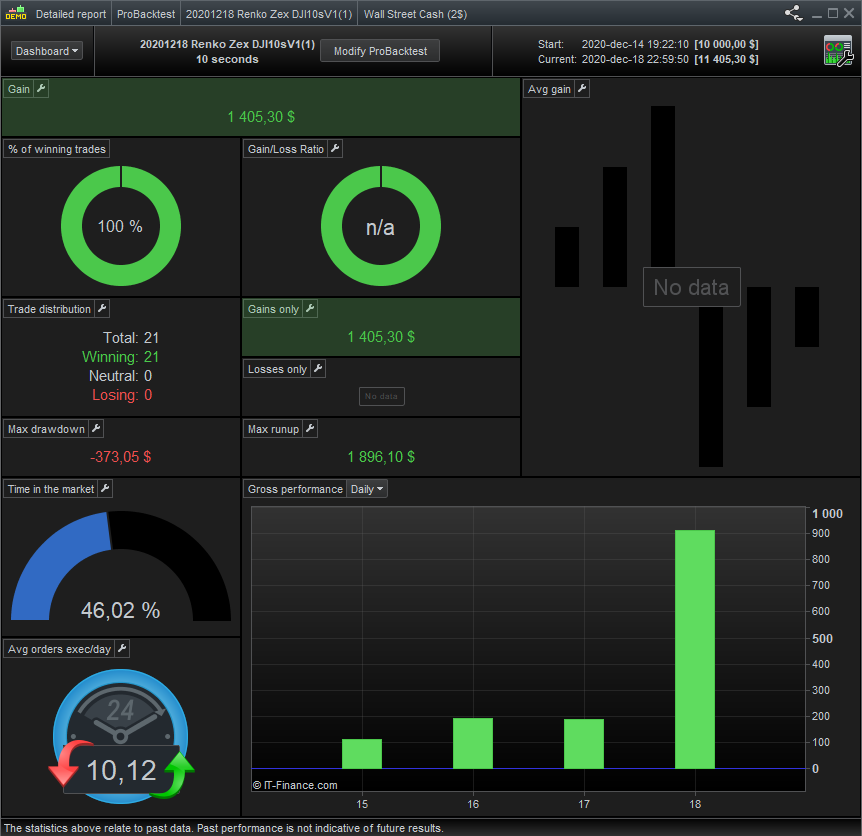
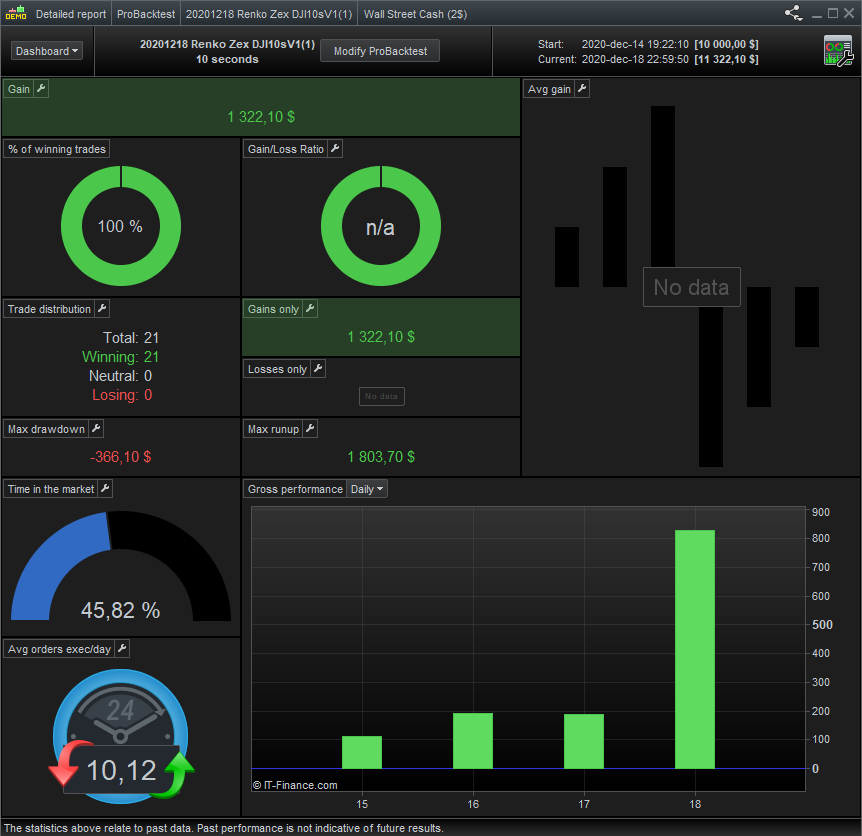
Another update, I tried it with the Machine Learning snippet of @juanj and leaving most of the settings at default produced slightly better results than using the latest optimized value of Period2 = 9.
The code that was inserted:
// Heuristics Algorithm Start

If onmarket[1] = 1 and onmarket = 0 Then
optimize = optimize + 1
EnDif

StartingValue = 9
ResetPeriod = 1 //Specify no of months after which to reset optimization
Increment = 1
MaxIncrement = 4 //Limit of no of increments either up or down
Reps = 6 //Number of trades to use for analysis
MaxValue = 100 //Maximum allowed value
MinValue = 1 //Minimum allowed value

once monthinit = month
once yearinit = year
If (year = yearinit and month = (monthinit + ResetPeriod)) or (year = (yearinit + 1) and ((12 - monthinit) + month = ResetPeriod)) Then
ValueX = StartingValue
WinCountB = 0
StratAvgB = 0
BestA = 0
BestB = 0
monthinit = month
yearinit = year
EndIf
once ValueX = StartingValue
once PIncPos = 1 //Positive Increment Position
once NIncPos = 1 //Neative Increment Position
once Optimize = 0 ////Initialize Heuristicks Engine Counter (Must be Incremented at Position Start or Exit)
once Mode = 1 //Switches between negative and positive increments
//once WinCountB = 3 //Initialize Best Win Count
//GRAPH WinCountB coloured (0,0,0) AS "WinCountB"
//once StratAvgB = 4353 //Initialize Best Avg Strategy Profit
//GRAPH StratAvgB coloured (0,0,0) AS "StratAvgB"

If Optimize = Reps Then
WinCountA = 0 //Initialize current Win Count
StratAvgA = 0 //Initialize current Avg Strategy Profit

For i = 1 to Reps Do
If positionperf(i) > 0 Then
WinCountA = WinCountA + 1 //Increment Current WinCount
EndIf
StratAvgA = StratAvgA + (((PositionPerf(i)*countofposition[i]*100000)*-1)*-1)
Next
StratAvgA = StratAvgA/Reps //Calculate Current Avg Strategy Profit
//Graph (PositionPerf(1)*countofposition[1]*100000)*-1 as "PosPerf1"
//Graph (PositionPerf(2)*countofposition[2]*100000)*-1 as "PosPerf2"
//Graph StratAvgA*-1 as "StratAvgA"
//once BestA = 300
//GRAPH BestA coloured (0,0,0) AS "BestA"
If StratAvgA >= StratAvgB Then
StratAvgB = StratAvgA //Update Best Strategy Profit
BestA = ValueX
EndIf
//once BestB = 300
//GRAPH BestB coloured (0,0,0) AS "BestB"
If WinCountA >= WinCountB Then
WinCountB = WinCountA  //Update Best Win Count
BestB = ValueX
EndIf

If WinCountA > WinCountB and StratAvgA > StratAvgB Then
Mode = 0
ElsIf WinCountA < WinCountB and StratAvgA < StratAvgB and Mode = 1 Then
ValueX = ValueX - (Increment*NIncPos)
NIncPos = NIncPos + 1
Mode = 2
ElsIf WinCountA >= WinCountB or StratAvgA >= StratAvgB and Mode = 1 Then
ValueX = ValueX + (Increment*PIncPos)
PIncPos = PIncPos + 1
Mode = 1
ElsIf WinCountA < WinCountB and StratAvgA < StratAvgB and Mode = 2 Then
ValueX = ValueX + (Increment*PIncPos)
PIncPos = PIncPos + 1
Mode = 1
ElsIf WinCountA >= WinCountB or StratAvgA >= StratAvgB and Mode = 2 Then
ValueX = ValueX - (Increment*NIncPos)
NIncPos = NIncPos + 1
Mode = 2
EndIf

If NIncPos > MaxIncrement or PIncPos > MaxIncrement Then
If BestA = BestB Then
ValueX = BestA
Else
If reps >= 10 Then
WeightedScore = 10
Else
WeightedScore = round((reps/100)*100)
EndIf
ValueX = round(((BestA*(20-WeightedScore)) + (BestB*WeightedScore))/20) //Lower Reps = Less weight assigned to Win%
EndIf
NIncPos = 1
PIncPos = 1
ElsIf ValueX > MaxValue Then
ValueX = MaxValue
ElsIf ValueX < MinValue Then
ValueX = MinValue
EndIF

Optimize = 0
EndIf
graph valuex
// Heuristics Algorithm End


p2 = valueX
Period2 is later set to p2, as this is the variable to be optimized.
See attachments for the difference in result over the last days. Unfortunately I only have access to 200k backtesting bars though.
@juanj Fantastic work with the Machine Learning!
are you comfortable with this DD ?