I want to make an indicator for Pro real time based on range of the London session the New York session and the Tokyo session from the opening and closes of their trading days and then I want to look at the previous 14 of those trading ranges so we look back at the London open and close 14 times in the past then give me the average range and then display it on the chart on over a daily 4 hour or one hour chart in a box in over the left or right hand corner showing the figures not only do I want the indicator to do that I also wanted to show me the range of the days so the last 14 Mondays average Range and then display that as a figure on the chart as well as the rest of the days of the week from Monday to Friday I want to be able to change the. I’ve looked back of those ranges from 14 to 20 to let’s say eight whatever I want to put in
I have had a try code with AI help lots of errors
// === INPUT PARAMETERS === Range SD
rangeLength = 14 // Lookback period (e.g., 14, 20, or 8 days)
showTopLeft = 1 // 1 = top-left corner, 0 = top-right
// === INITIALIZATION ===
once dayRangeMonday[] = 0
once dayRangeTuesday[] = 0
once dayRangeWednesday[] = 0
once dayRangeThursday[] = 0
once dayRangeFriday[] = 0
once tyoRanges[] = 0
once ldnRanges[] = 0
once nycRanges[] = 0
// === TIME FILTERS FOR SESSIONS (GMT) ===
// Tokyo: 00:00 - 09:00 GMT
inTokyoSession = (time >= 000000 and time < 090000)
// London: 07:00 - 16:00 GMT
inLondonSession = (time >= 070000 and time < 160000)
// New York: 12:00 - 21:00 GMT
inNewYorkSession = (time >= 120000 and time < 210000)
// === SESSION RANGE CALCULATION ===
if barindex > rangeLength * 24 then
// Store daily high/low per session
if inTokyoSession then
tyoHigh = max(tyoHigh, high)
tyoLow = min(tyoLow, low)
endif
if inLondonSession then
ldnHigh = max(ldnHigh, high)
ldnLow = min(ldnLow, low)
endif
if inNewYorkSession then
nycHigh = max(nycHigh, high)
nycLow = min(nycLow, low)
endif
// End of day (at 23:00 GMT) – commit range and reset
if time = 230000 then
// Session Ranges
if tyoHigh <> 0 and tyoLow <> 0 then
tyoRanges.append(tyoHigh - tyoLow)
endif
if ldnHigh <> 0 and ldnLow <> 0 then
ldnRanges.append(ldnHigh - ldnLow)
endif
if nycHigh <> 0 and nycLow <> 0 then
nycRanges.append(nycHigh - nycLow)
endif
// Weekday Ranges
dayRange = high - low
select dayofweek
case 1
dayRangeMonday.append(dayRange)
case 2
dayRangeTuesday.append(dayRange)
case 3
dayRangeWednesday.append(dayRange)
case 4
dayRangeThursday.append(dayRange)
case 5
dayRangeFriday.append(dayRange)
endselect
// Reset session high/low
tyoHigh = 0
tyoLow = 999999
ldnHigh = 0
ldnLow = 999999
nycHigh = 0
nycLow = 999999
endif
endif
// === AVERAGE RANGE CALCULATION FUNCTION ===
def calcAverage(array, length)
sum = 0
count = min(length, array.size)
for i = 0 to count - 1 do
sum = sum + array[i]
next
if count > 0 then
result = sum / count
else
result = 0
endif
return result
enddef
// === COMPUTE AVERAGES ===
avgTyo = calcAverage(tyoRanges, rangeLength)
avgLdn = calcAverage(ldnRanges, rangeLength)
avgNyc = calcAverage(nycRanges, rangeLength)
avgMon = calcAverage(dayRangeMonday, rangeLength)
avgTue = calcAverage(dayRangeTuesday, rangeLength)
avgWed = calcAverage(dayRangeWednesday, rangeLength)
avgThu = calcAverage(dayRangeThursday, rangeLength)
avgFri = calcAverage(dayRangeFriday, rangeLength)
// === DISPLAY TEXT OUTPUT ===
xOffset = 10
yOffset = 20
if showTopLeft then
posX = barindex - xOffset
else
posX = barindex + xOffset
endif
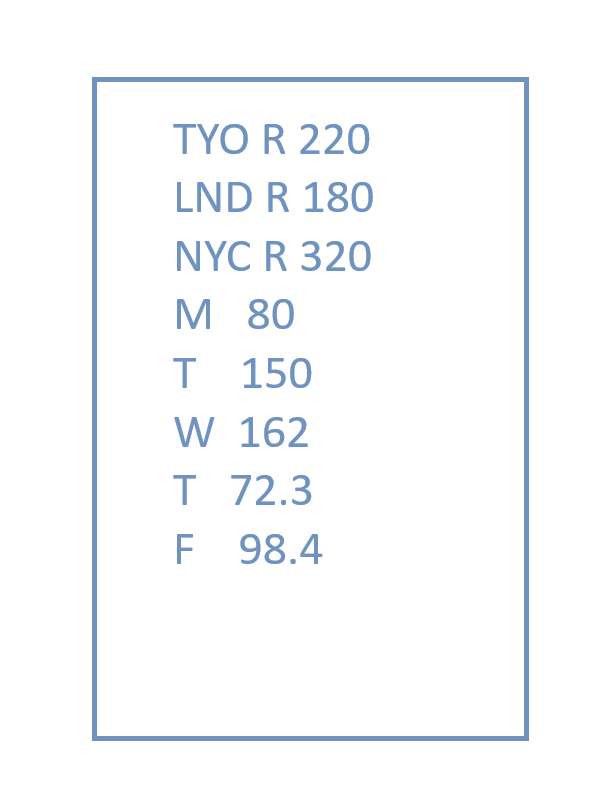
drawtext("TYO R " + round(avgTyo), posX, high + yOffset, dialog, "Arial", 12, standard, showTopLeft)
drawtext("LND R " + round(avgLdn), posX, high + yOffset - 10, dialog, "Arial", 12, standard, showTopLeft)
drawtext("NYC R " + round(avgNyc), posX, high + yOffset - 20, dialog, "Arial", 12, standard, showTopLeft)
drawtext("M " + round(avgMon), posX, high + yOffset - 40, dialog, "Arial", 12, standard, showTopLeft)
drawtext("T " + round(avgTue), posX, high + yOffset - 50, dialog, "Arial", 12, standard, showTopLeft)
drawtext("W " + round(avgWed), posX, high + yOffset - 60, dialog, "Arial", 12, standard, showTopLeft)
drawtext("T " + round(avgThu), posX, high + yOffset - 70, dialog, "Arial", 12, standard, showTopLeft)
drawtext("F " + round(avgFri), posX, high + yOffset - 80, dialog, "Arial", 12, standard, showTopLeft)