Bonjour, voici donc les deux indicateurs utilisés pour les graphiques (je mettrai à la suite la stratégie d’entrée en position) :
Indicateur n°1
// Original Script > @DonovanWall
// Adapted Version > @guikroth
//////////////////////////////////////////////////////////////////////////
// Settings for 5min chart, BTCUSDC. For Other coin, change the parameters
//////////////////////////////////////////////////////////////////////////
DefParam DrawOnLastBarOnly = true
xClose = (Open+High+Low+Close)/4
// Source
src = xclose
// Sampling Period
// Settings for 5min chart, BTCUSDC. For Other coin, change the paremeters
// per = defval=100, minval=1, “Sampling Period”
// Range Multiplier
// mult = defval=3.0, minval=0.1, “Range Multiplier”
PER = 100
MULT = 3
// Smooth Average Range
wper = per*2 -1
avrng = exponentialaverage[per](abs(src-src[1]))
smrng = mult * exponentialaverage[wper](avrng)
// Range Filter
rngfilt = src
If src > rngfilt[1] then
If rngfilt[1] > src-smrng then
rngfilt = rngfilt[1]
Else
rngfilt = src-smrng
endif
elsif rngfilt[1] < src+smrng then
rngfilt = rngfilt[1]
else
rngfilt = src+smrng
endif
filt = rngfilt
// Filter Direction
upward = 0
If filt > filt[1] then
upward = upward[1]+1
elsif filt < filt[1] then
upward = 0
else
upward = upward[1]
endif
downward = 0
If filt < filt[1] then
downward = downward[1]+1
elsif filt > filt[1] then
downward = 0
else
downward = downward[1]
endif
// Target Bands
hband = filt + smrng
lband = filt – smrng
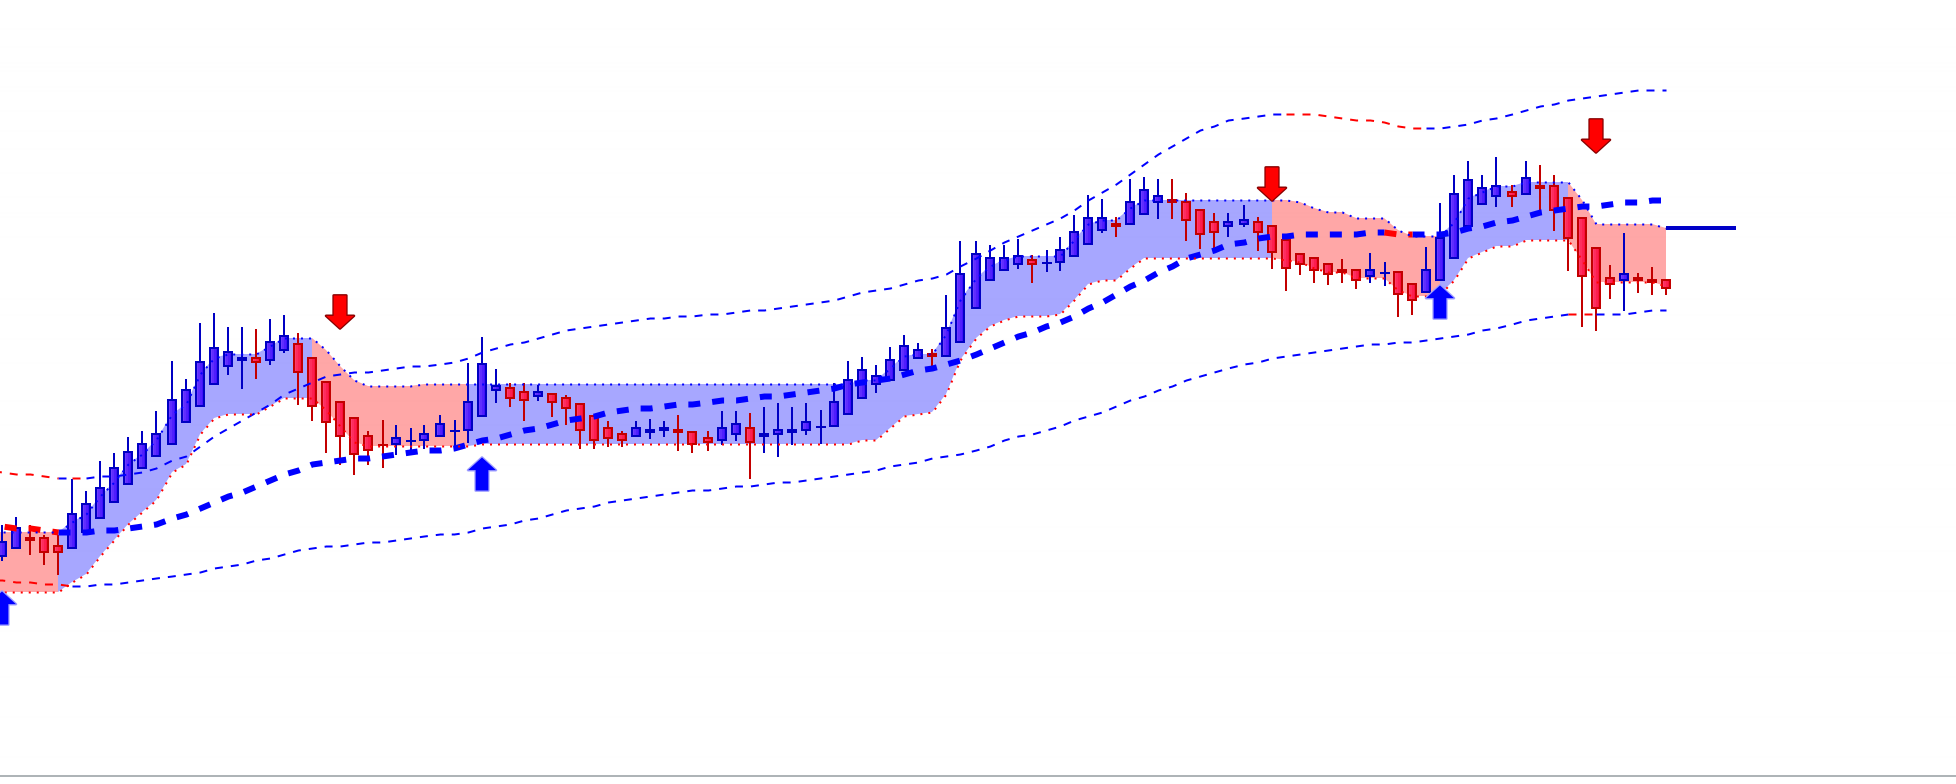
//// Zone de couleurs : selon des conditions
////////////////////////////////////////////////////////////////////////////
mbTendance = (Average[3](filt) + filt)/2
if mbTendance > mbTendance[1] then
red=0
green=0
blue=255
elsif mbTendance < mbTendance[1] then
red=255
green=0
blue=0
endif
colorbetween(lband,hband,red,Green,Blue,88)
if islastbarupdate then
if close<hband then
DRAWSEGMENT(barindex, hband, barindex+5, hband)style(line,2) coloured(0,0,200)
endif
if close>lband then
DRAWSEGMENT(barindex, lband, barindex+5, lband)style(line,2) coloured(0,0,200)
endif
endif
Return filt as “Range Filter”, hband as “High Target”, lband as “Low Target”, mbtendance as “tendance”
2ème indicateur :
/////////////////////////////////////KAMA 150
Period = 150
FastPeriod = 2
SlowPeriod = 50
Fastest = 2 / (FastPeriod + 1)
Slowest = 2 / (SlowPeriod + 1)
if barindex < Period+1 then
Kama=close
else
Num = abs(close-close[Period])
Den = summation[Period](abs(close-close[1]))
ER = Num / Den
Alpha = SQUARE(ER *(Fastest – Slowest )+ Slowest)
KAMA = (Alpha * Close) + ((1 -Alpha)* Kama[1])
endif
///////////////////////////////////////////////////////////////////: Distance Cours KAMA
xClose = (Open+High+Low+Close)/4
Distance = (xclose- kama)
moy = average[50]((distance))
if Moy<Moy[1] and Moy[1]>Moy[2] and Moy[1]>0 then
///RetB5=RetB4
///RetB4=RetB3
RetB3=RetB2
RetB2=RetB1
RetB1=Moy[1]
RetBmoy=(RetB1+RetB2+RetB3)/3
endif
if Moy>Moy[1] and Moy[1]<Moy[2] and Moy[1]<0 then
///RetH5=RetH4
///RetH4=RetH3
RetH3=RetH2
RetH2=RetH1
RetH1=Moy[1]
RetHmoy=(RetH1+RetH2+RetH3)/3
endif
for i=0 to 49
$montab[i]=distance[i]
Next
arraysort($montab,ascend)
moy3plusBas = ($montab[0] + $montab[1] + $montab[2]) / 3
moy3plusHauts = ($montab[49] + $montab[48] + $montab[47]) / 3
if (distance > moy3plushauts) then
drawcandle (0,0, distance, distance) COLOURED (32, 0, 192)
endif
if (distance < moy3plusbas) then
drawcandle (0,0, distance, distance) COLOURED (235,0,0)
endif
if (distance > moy) and (distance < moy3plushauts) and (distance > 0) then
drawcandle (0, 0, distance, distance) coloured (0, 204, 255)
endif
if (Distance < moy) and (distance > moy3plusbas) and (distance < 0) then
drawcandle (0, 0, distance, distance) coloured (255, 204, 153)
endif
Return distance as “Distance”, moy as “Distance Moy”, RetBmoy as “Bande Haute”, RetHmoy as “Bande Basse”, moy3plusHauts as “FilterUp”, moy3plusBas as “FilterDn”
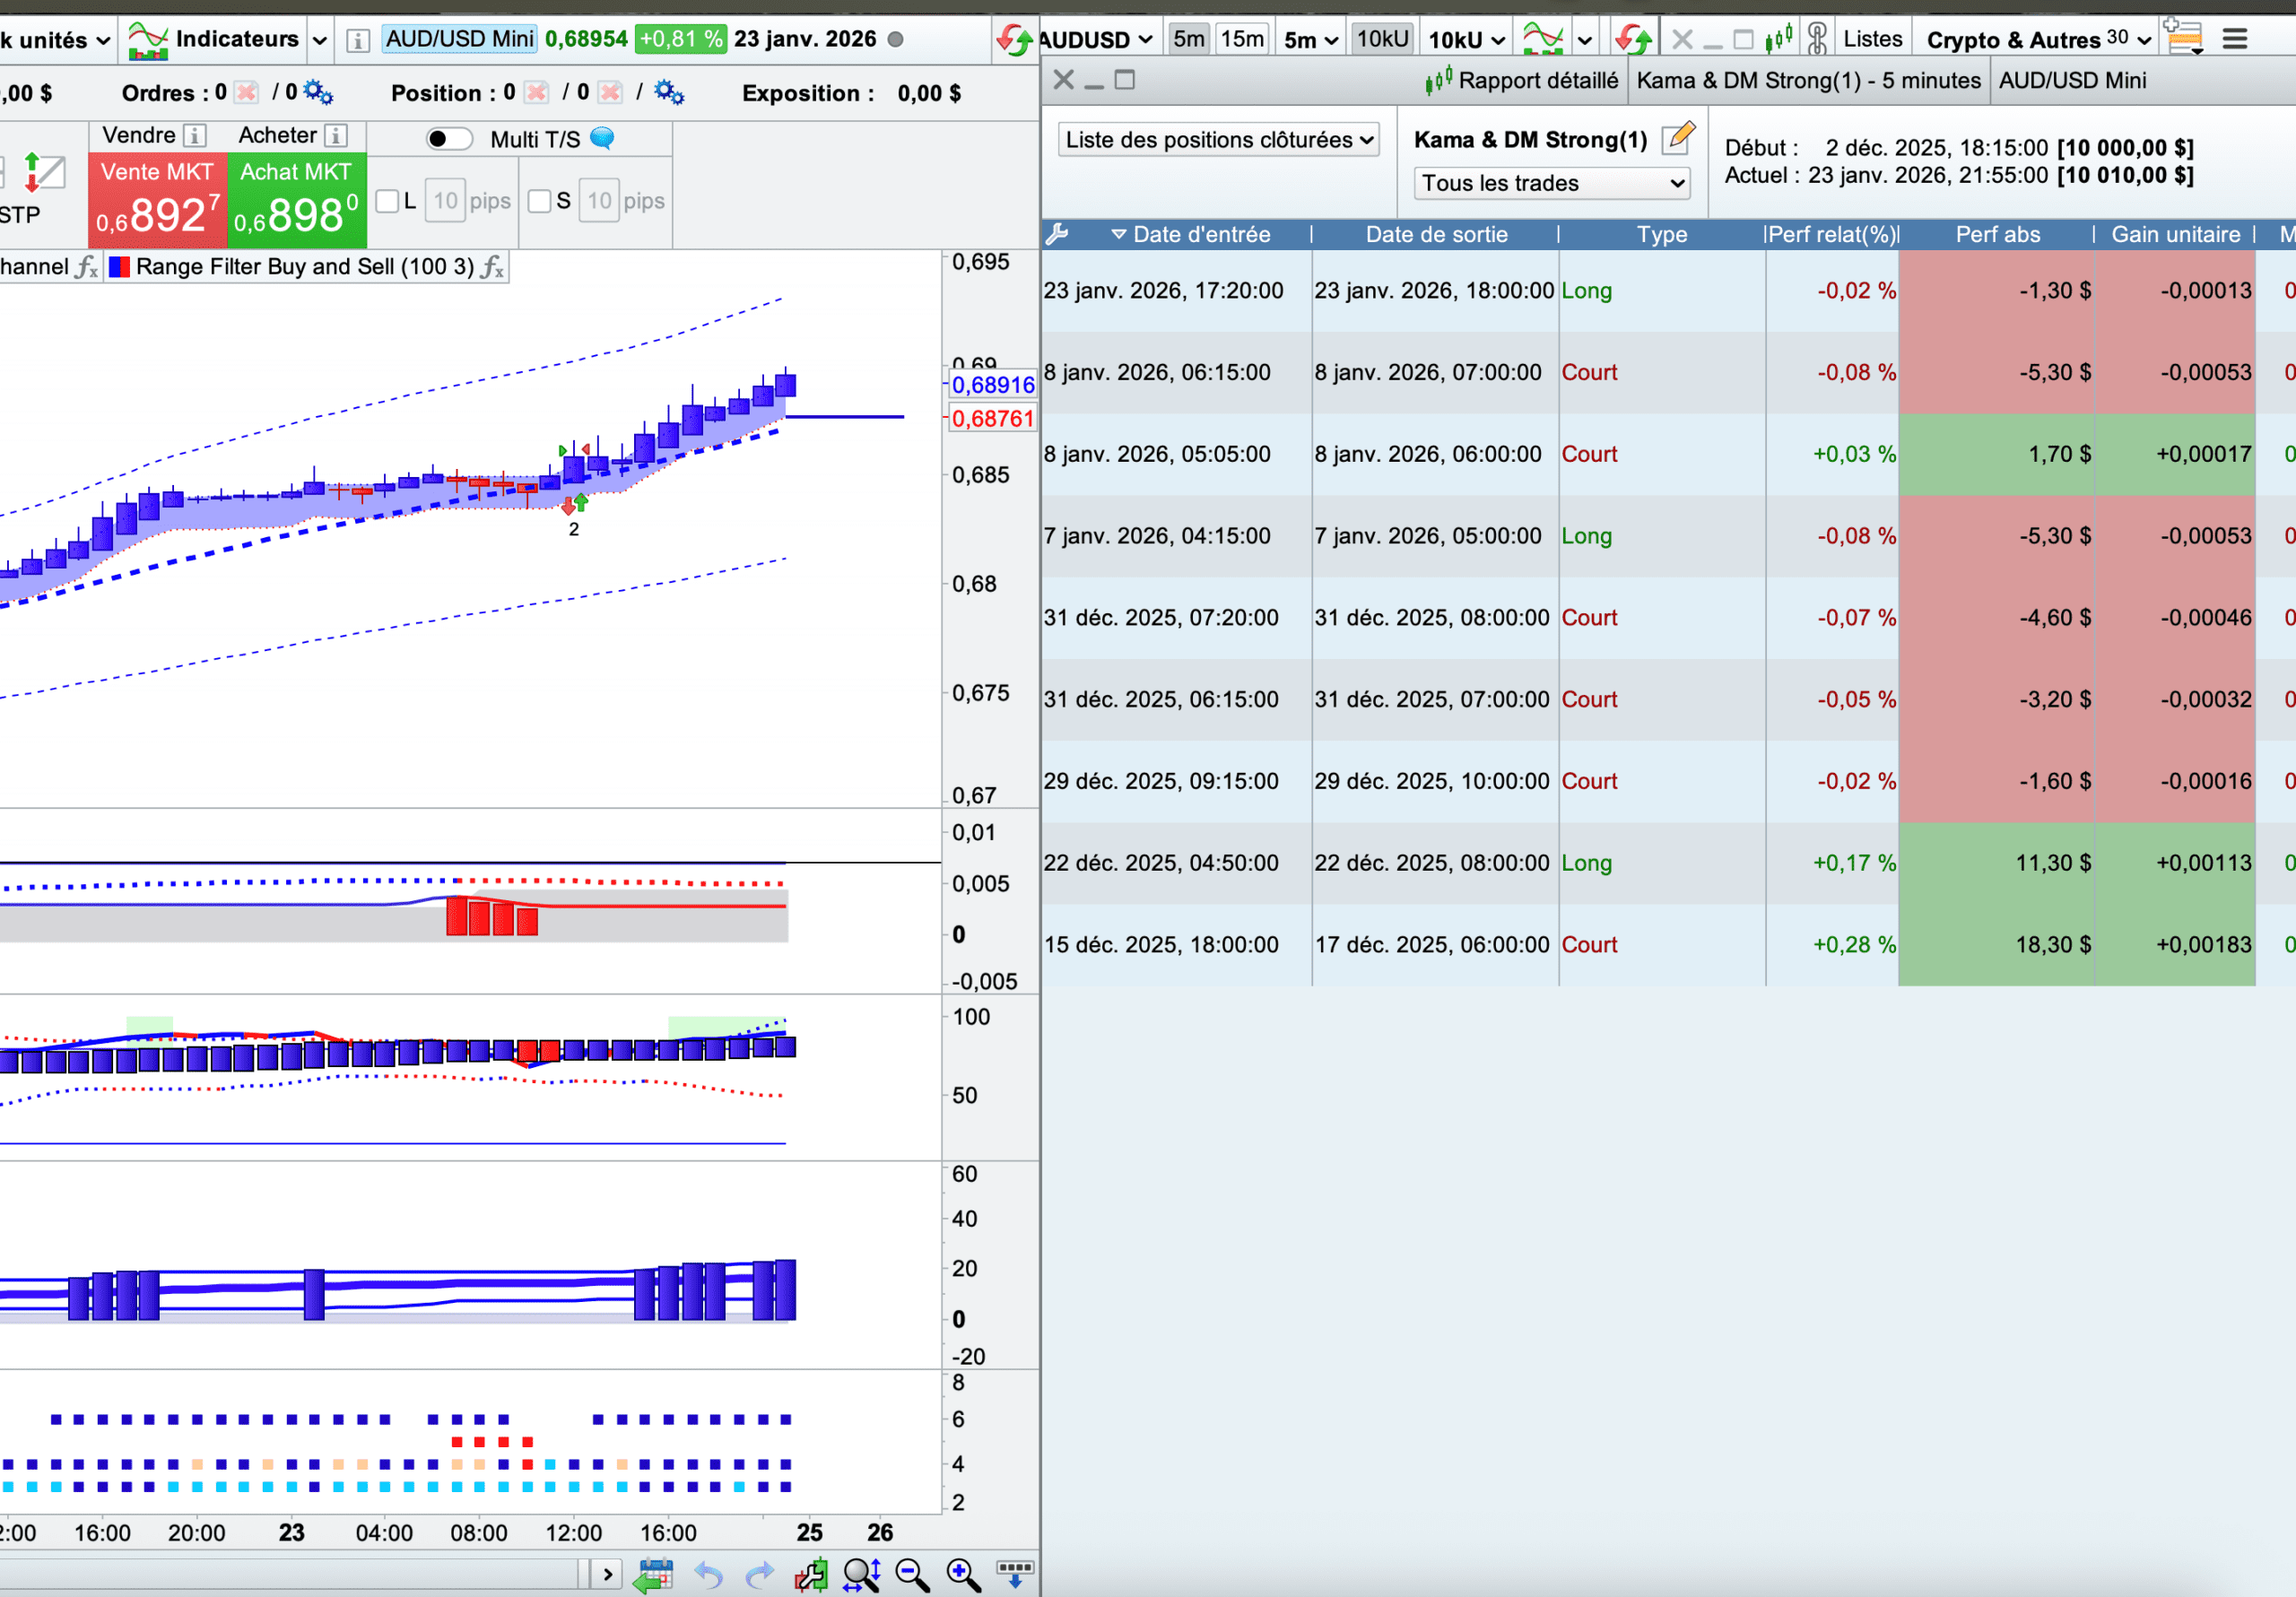
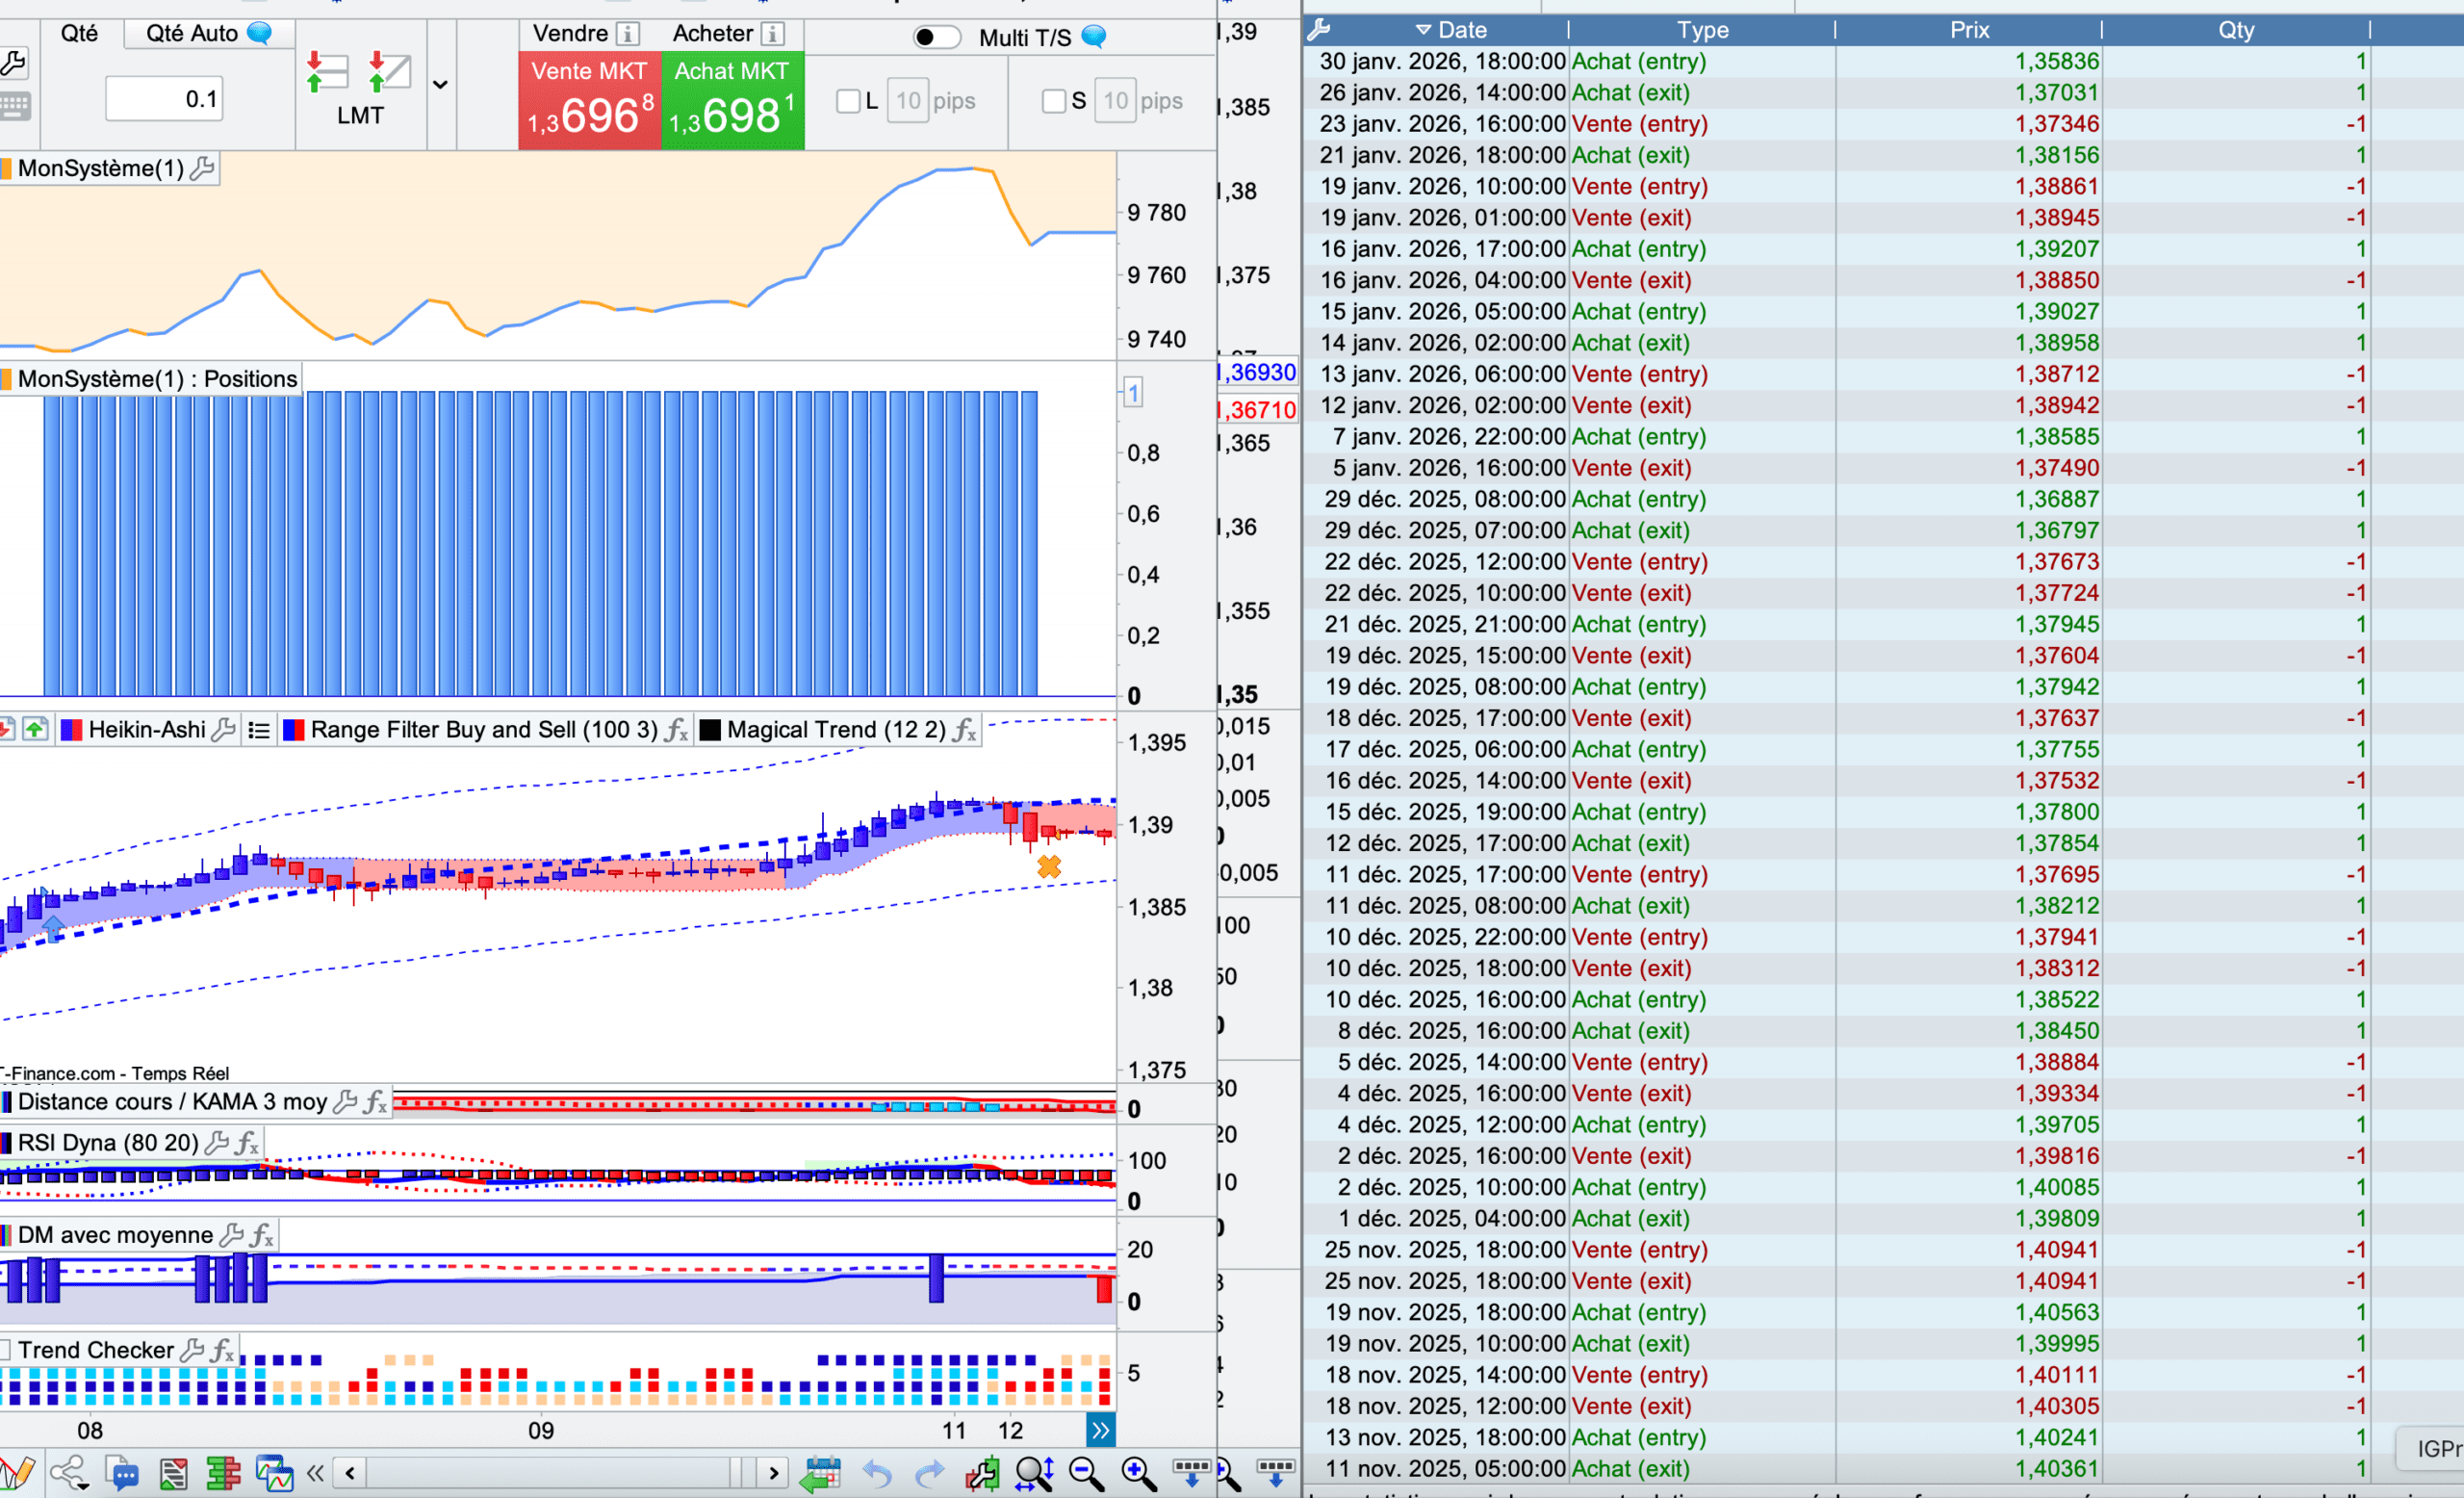
Et voici la stratégie d’entrée en position (longue dans le cas présenté)
/////////////////////////////////////////////////////////////KAMA 150
Period = 150
FastPeriod = 2
SlowPeriod = 50
Fastest = 2 / (FastPeriod + 1)
Slowest = 2 / (SlowPeriod + 1)
if barindex < Period+1 then
Kama=close
else
Num = abs(close-close[Period])
Den = summation[Period](abs(close-close[1]))
ER = Num/ Den
Alpha= SQUARE(ER *(Fastest – Slowest)+ Slowest)
KAMA1= (Alpha* Close) + ((1 -Alpha)* Kama[1])
endif
///////////////////////////////////////////////////////////////////: Distance Cours KAMA
DistanceKAMA = (xclose- kama)
for i=0 to 49
$montab[i]=distanceKAMA[i]
Next
arraysort($montab,ascend)
moy3plusBas = ($montab[0] + $montab[1] + $montab[2]) / 3
moy3plusHauts = ($montab[49] + $montab[48] + $montab[47]) / 3
FilterKAMAUp = (DistanceKAMA > Moy3plushauts)
if FilterKAMAUp then
buy 1 contract at market
endif
Mon problème est la sortie de cette position : je voudrais qu’elle intervienne lorsque le “ruban” (codé dans le 1er indicateur) passe de la couleur bleue à la couleur rouge.
Merci.