Bonjour, serait il possible d’avoir la version PRT de l’indicateur QQE THRESHOLD de TradingView SVP?
Je suis désolé je n’ai pas le fichier .MQ4 mais simplement le code présent dans TradingView ci-dessous :
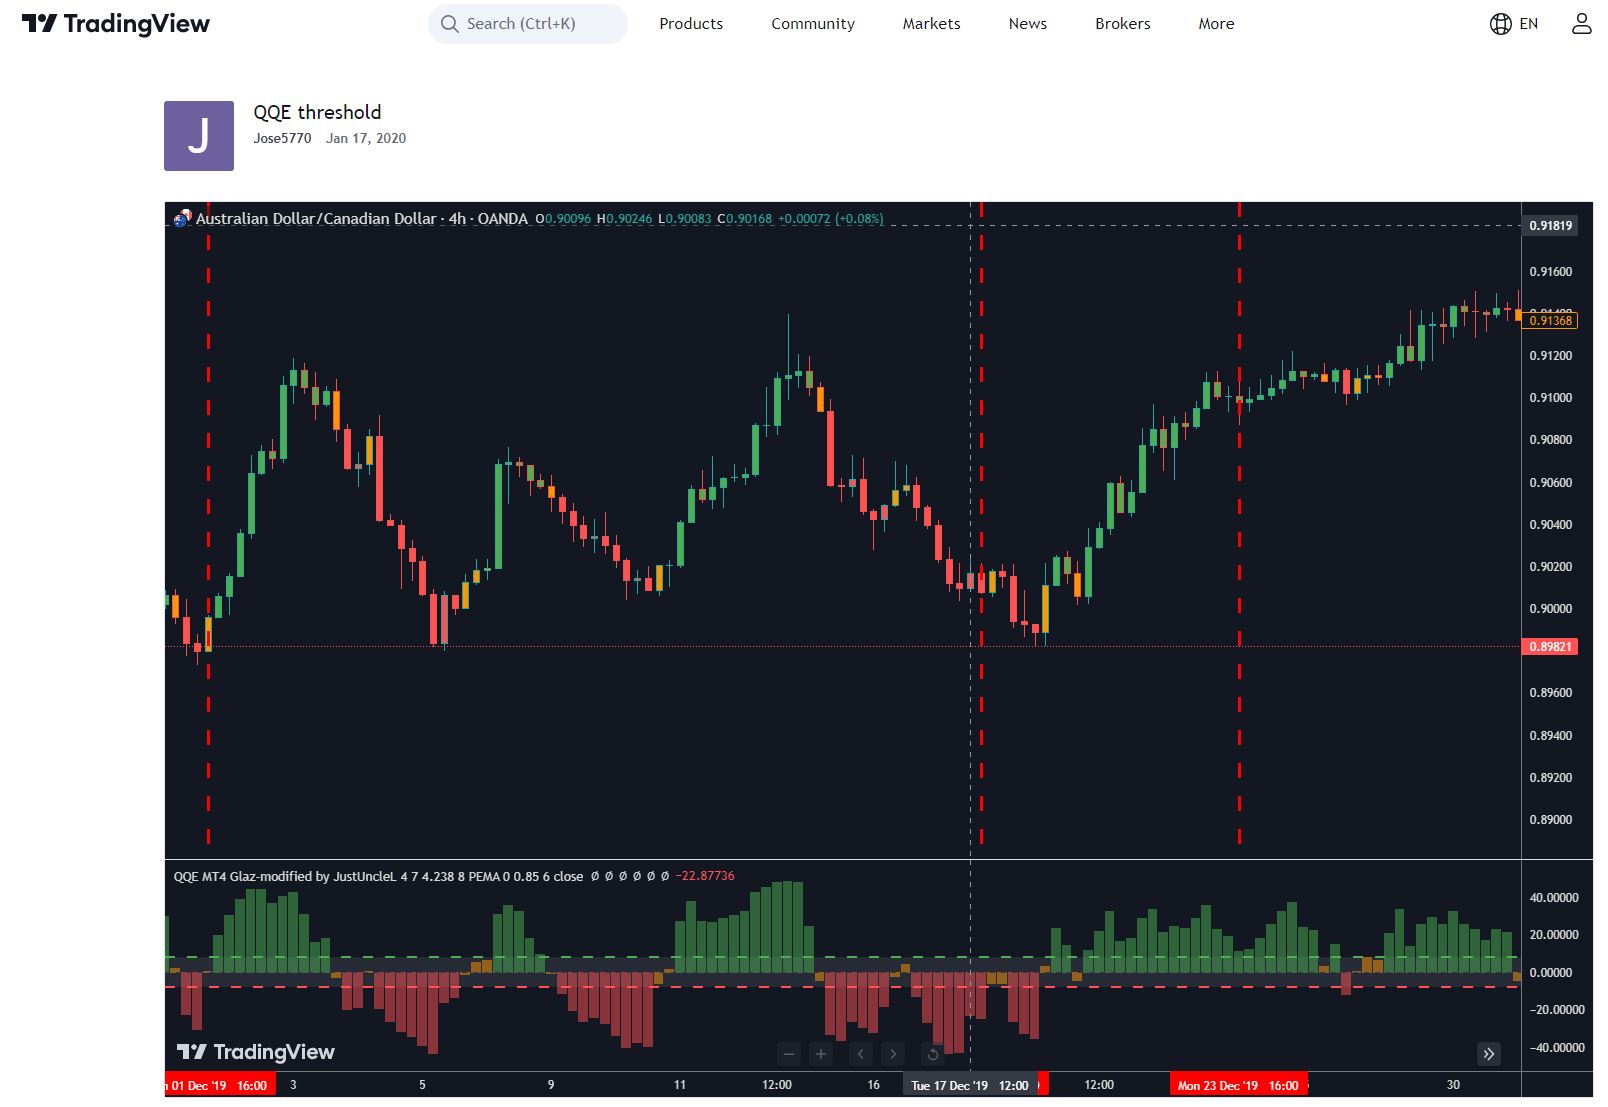
Cet indicateur reprend le QQE mais apparait sous la forme de barre où l’on peut customiser la couleurs de ces dernières pour avoir des signaux de tendance plus pertinant surtout en mode sclaping. Cet indicateur est pertinent couplé à d’autres indicateurs de tendance comme le Pivot Point SuperTrend.
//@version=4
//By Glaz
//Modifications:
// Added Columns to show when signal is outside of Thresh Hold Channnel.
// Set default Parameters to match QQE Cross Alert indicator.
//
study(“QQE MT4 Glaz-modified by JustUncleL”)
RSI_Period = input(14, title=’RSI Length’)
SF = input(5, title=’RSI Smoothing’)
QQE = input(4.238, title=’Fast QQE Factor’)
ThreshHold = input(10, title=”Thresh-hold”)
//
sQQEx = input(false, title=”Show Smooth RSI, QQE Signal crosses”)
sQQEz = input(false, title=”Show Smooth RSI Zero crosses”)
sQQEc = input(false, title=”Show Smooth RSI Thresh Hold Channel Exits”)
ma_type = input(title=”MA Type”, type=input.string, defval=”EMA”, options=[“ALMA”, “EMA”, “DEMA”, “TEMA”, “WMA”, “VWMA”, “SMA”, “SMMA”, “HMA”, “LSMA”, “PEMA”])
lsma_offset = input(defval=0, title=”* Least Squares (LSMA) Only – Offset Value”, minval=0)
alma_offset = input(defval=0.85, title=”* Arnaud Legoux (ALMA) Only – Offset Value”, minval=0, step=0.01)
alma_sigma = input(defval=6, title=”* Arnaud Legoux (ALMA) Only – Sigma Value”, minval=0)
inpDrawBars = input(true, title=”color bars?”)
ma(type, src, len) =>
float result = 0
if type==”SMA” // Simple
result := sma(src, len)
if type==”EMA” // Exponential
result := ema(src, len)
if type==”DEMA” // Double Exponential
e = ema(src, len)
result := 2 * e – ema(e, len)
if type==”TEMA” // Triple Exponential
e = ema(src, len)
result := 3 * (e – ema(e, len)) + ema(ema(e, len), len)
if type==”WMA” // Weighted
result := wma(src, len)
if type==”VWMA” // Volume Weighted
result:=vwma(src,len)
if type==”SMMA” // Smoothed
w = wma(src, len)
result := na(w[1]) ? sma(src, len) : (w[1] * (len – 1) + src) / len
if type==”HMA” // Hull
result := wma(2 * wma(src, len / 2) – wma(src, len), round(sqrt(len)))
if type==”LSMA” // Least Squares
result := linreg(src, len, lsma_offset)
if type==”ALMA” // Arnaud Legoux
result := alma(src, len, alma_offset, alma_sigma)
if type==”PEMA”
// Copyright (c) 2010-present, Bruno Pio
// Copyright (c) 2019-present, Alex Orekhov (everget)
// Pentuple Exponential Moving Average script may be freely distributed under the MIT license.
ema1 = ema(src, len)
ema2 = ema(ema1, len)
ema3 = ema(ema2, len)
ema4 = ema(ema3, len)
ema5 = ema(ema4, len)
ema6 = ema(ema5, len)
ema7 = ema(ema6, len)
ema8 = ema(ema7, len)
pema = 8 * ema1 – 28 * ema2 + 56 * ema3 – 70 * ema4 + 56 * ema5 – 28 * ema6 + 8 * ema7 – ema8
result := pema
result
src = input(close, title=”RSI Source”)
//
//
Wilders_Period = RSI_Period * 2 – 1
Rsi = rsi(src, RSI_Period)
RsiMa = ma(ma_type, Rsi, SF)
AtrRsi = abs(RsiMa[1] – RsiMa)
MaAtrRsi = ma(ma_type, AtrRsi, Wilders_Period)
dar = ma(ma_type, MaAtrRsi, Wilders_Period) * QQE
longband = 0.0
shortband = 0.0
trend = 0
DeltaFastAtrRsi = dar
RSIndex = RsiMa
newshortband = RSIndex + DeltaFastAtrRsi
newlongband = RSIndex – DeltaFastAtrRsi
longband:=RSIndex[1]>longband[1]andRSIndex>longband[1]?
max(longband[1], newlongband) : newlongband
shortband:=RSIndex[1]<shortband[1]andRSIndex<shortband[1]?
min(shortband[1], newshortband) : newshortband
cross_1 = cross(longband[1], RSIndex)
trend := cross(RSIndex, shortband[1]) ? 1 : cross_1 ? -1 : nz(trend[1], 1)
FastAtrRsiTL = trend == 1 ? longband : shortband
//
// Find all the QQE Crosses
QQExlong = 0
QQExlong := nz(QQExlong[1])
QQExshort = 0
QQExshort := nz(QQExshort[1])
QQExlong := sQQEx and FastAtrRsiTL < RSIndex ? QQExlong + 1 : 0
QQExshort := sQQEx and FastAtrRsiTL > RSIndex ? QQExshort + 1 : 0
// Zero cross
QQEzlong = 0
QQEzlong := nz(QQEzlong[1])
QQEzshort = 0
QQEzshort := nz(QQEzshort[1])
QQEzlong := sQQEz and RSIndex >= 50 ? QQEzlong + 1 : 0
QQEzshort := sQQEz and RSIndex < 50 ? QQEzshort + 1 : 0
//
// Thresh Hold channel Crosses give the BUY/SELL alerts.
QQEclong = 0
QQEclong := nz(QQEclong[1])
QQEcshort = 0
QQEcshort := nz(QQEcshort[1])
QQEclong := sQQEc and RSIndex > 50 + ThreshHold ? QQEclong + 1 : 0
QQEcshort := sQQEc and RSIndex < 50 – ThreshHold ? QQEcshort + 1 : 0
// QQE exit from Thresh Hold Channel
plotshape(sQQEc and QQEclong == 1 ? RsiMa – 50 : na, title=”QQE XC Over Channel”, style=shape.diamond, location=location.absolute, color=color.olive, transp=0, size=size.small, offset=0)
plotshape(sQQEc and QQEcshort == 1 ? RsiMa – 50 : na, title=”QQE XC Under Channel”, style=shape.diamond, location=location.absolute, color=color.red, transp=0, size=size.small, offset=0)
// QQE crosses
plotshape(sQQEx and QQExlong == 1 ? FastAtrRsiTL[1] – 50 : na, title=”QQE XQ Cross Over”, style=shape.circle, location=location.absolute, color=color.lime, transp=0, size=size.small, offset=-1)
plotshape(sQQEx and QQExshort == 1 ? FastAtrRsiTL[1] – 50 : na, title=”QQE XQ Cross Under”, style=shape.circle, location=location.absolute, color=color.blue, transp=0, size=size.small, offset=-1)
// Signal crosses zero line
plotshape(sQQEz and QQEzlong == 1 ? RsiMa – 50 : na, title=”QQE XZ Zero Cross Over”, style=shape.square, location=location.absolute, color=color.aqua, transp=0, size=size.small, offset=0)
plotshape(sQQEz and QQEzshort == 1 ? RsiMa – 50 : na, title=”QQE XZ Zero Cross Under”, style=shape.square, location=location.absolute, color=color.fuchsia, transp=0, size=size.small, offset=0)
hcolor=RsiMa-50>ThreshHold?color.green:
RsiMa – 50 < 0 – ThreshHold ? color.red : color.orange
plot(FastAtrRsiTL – 50, color=color.blue, transp=0, linewidth=2)
p1 = plot(RsiMa – 50, color=color.orange, transp=0, linewidth=2)
plot(RsiMa – 50, color=hcolor, transp=50, style=plot.style_columns)
hZero = hline(0, color=color.black, linestyle=hline.style_dashed, linewidth=1)
hUpper = hline(ThreshHold, color=color.green, linestyle=hline.style_dashed, linewidth=2)
hLower = hline(0 – ThreshHold, color=color.red, linestyle=hline.style_dashed, linewidth=2)
fill(hUpper, hLower, color=color.gray, transp=80)
//EOF
bgc = RsiMa – 50 > ThreshHold ? color.green : Rsi – 50 < 0 – ThreshHold ? color.red : color.orange
barcolor(inpDrawBars ? bgc : na)