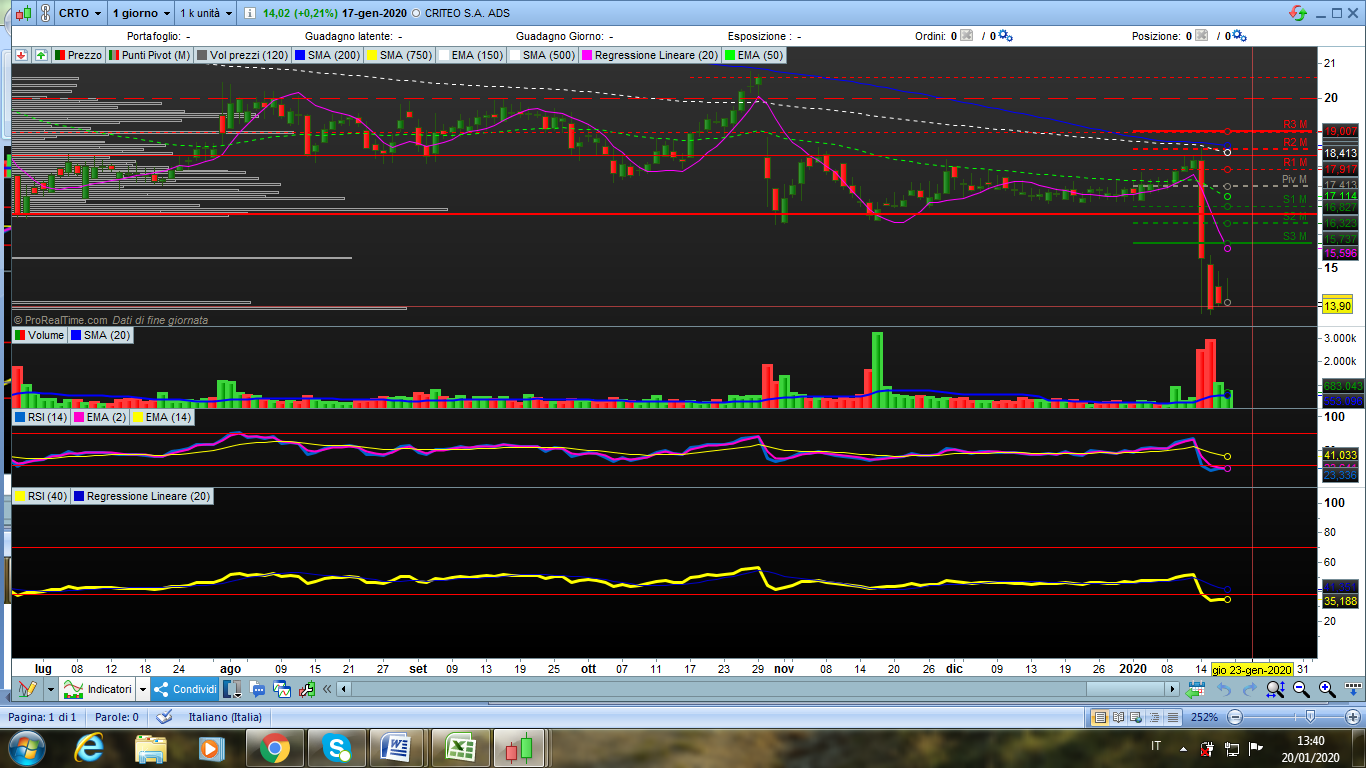
Buon giorno Roberto, è possibile avere il codice di un proscreener che estragga i titoli che sono sotto il PIVOT S3 o sopra il Pivot R3 di circa un 3% così da identificare zone di ipervenduto/ipercomprato? Ho allegato un immagine di un titolo americano ad esempio. Grazie mille per l aiuto
Usi il grafico Giornaliero con pivot Mensili?
Buona sera Roberto, si grafico giornaliero con pivot mensili su azioni. scusa,hai ragione non ho precisato.
Questo è l’indicatore (che ti stampa le linee di R3 ed S3 e4d i rettangoli della percentuale indicata, +-):
// Monthly pivots
// by Vonasi - https://www.prorealcode.com/prorealtime-indicators/daily-weekly-monthly-pivot-points/
DEFPARAM DrawOnLastBarOnly = true
IF BarIndex = 0 THEN
PerCent           = 0.01                                              //1%
lastMonthBarIndex = 0
monthlyHigh       = undefined
monthlyLow        = undefined
monthlyPivot      = undefined
monthlyR1         = undefined
monthlyS1         = undefined
//monthlyR2       = undefined
//monthlyS2       = undefined
monthlyR3         = undefined
monthlyS3         = undefined
Endif
If Month <> Month[1] then
monthlyHigh       = Highest[max(1,BarIndex - lastMonthBarIndex)](High)[1]
monthlyLow        = Lowest[max(1,BarIndex - lastMonthBarIndex)](Low)[1]
lastMonthBarIndex = BarIndex
monthlyPivot      = (monthlyHigh + monthlyLow + Close[1]) / 3
monthlyR1         = 2*monthlyPivot - monthlyLow
monthlyS1         = 2*monthlyPivot - monthlyHigh
//monthlyR2       = monthlyPivot + (monthlyHigh - monthlyLow)
//monthlyS2       = monthlyPivot - (monthlyHigh - monthlyLow)
monthlyR3         = monthlyR1 + (monthlyHigh - monthlyLow)
monthlyS3         = monthlyS1 - (monthlyHigh - monthlyLow)
SopraR3           = monthlyR3 * (1 + PerCent)
SottoR3           = monthlyR3 * (1 - PerCent)
SopraS3           = monthlyS3 * (1 + PerCent)
SottoS3           = monthlyS3 * (1 - PerCent)
Endif
DRAWRECTANGLE(barindex-5,SopraR3,barindex,SottoR3)
DRAWRECTANGLE(barindex-5,SopraS3,barindex,SottoS3)
RETURN monthlyR3 as "R3",monthlyS3 AS "S3"
e questo è lo screener che ti fa la scansione:
// Monthly pivots
// by Vonasi - https://www.prorealcode.com/prorealtime-indicators/daily-weekly-monthly-pivot-points/
IF BarIndex = 0 THEN
PerCent           = 0.01                                              //1%
lastMonthBarIndex = 0
monthlyHigh       = undefined
monthlyLow        = undefined
monthlyPivot      = undefined
monthlyR1         = undefined
monthlyS1         = undefined
//monthlyR2       = undefined
//monthlyS2       = undefined
monthlyR3         = undefined
monthlyS3         = undefined
Endif
If Month <> Month[1] then
monthlyHigh       = Highest[max(1,BarIndex - lastMonthBarIndex)](High)[1]
monthlyLow        = Lowest[max(1,BarIndex - lastMonthBarIndex)](Low)[1]
lastMonthBarIndex = BarIndex
monthlyPivot      = (monthlyHigh + monthlyLow + Close[1]) / 3
monthlyR1         = 2*monthlyPivot - monthlyLow
monthlyS1         = 2*monthlyPivot - monthlyHigh
//monthlyR2       = monthlyPivot + (monthlyHigh - monthlyLow)
//monthlyS2       = monthlyPivot - (monthlyHigh - monthlyLow)
monthlyR3         = monthlyR1 + (monthlyHigh - monthlyLow)
monthlyS3         = monthlyS1 - (monthlyHigh - monthlyLow)
SopraR3           = monthlyR3 * (1 + PerCent)
SottoR3           = monthlyR3 * (1 - PerCent)
SopraS3           = monthlyS3 * (1 + PerCent)
SottoS3           = monthlyS3 * (1 - PerCent)
Endif
Risultato            = 0
IF close >= SottoR3 AND close <= SopraR3 THEN
Risultato         = 1
ELSIF close >= SottoS3 AND close <= SopraS3 THEN
Risultato         = 2
ENDIF
SCREENER[Risultato](Risultato AS "1=↑,2=↓")
Ho messo una percentuale dell’1% per non avere troppi risultati.
OK Roberto, ho letto ora e stasera lo provo.. grazie mille per adesso e spero di essere all altezza e capirci… 🙂 poi proverò ad inserire l indicatore anche se non so bene come si fa.. gentilissimo e 1000 grazie per ora.
Buona sera Roberto, è perfetto il proscreener che mi hai inviato, chiedevo è possibile impostarlo anche con i pivot annuali o semestrali o trimestrali? Sempre usando grafici giornalieri, in modo da trovare strumenti finanziari che siano sopra/sotto il PIVOT R3/S3 annuale o semestrale o trimestrale, così da trovare aree di possibile inversione del prezzo. Darei la priorità al trimestrale, poi semestrale e poi annuale. Grazie mille per la tua disponibilità.
Annuale non so, proScreener ha un limite di 254 barre, per cui se non ci sono più di 254 giorni di trading in un anno ci si dovrebbe fare, altrimenti avremmo comunque un valore vicino, anche se non preciso.
Per quello semestrale e trimestrale non ci sono problemi.
Te lo farò.
Trimestrale:
// Monthly pivots    (adattato per diventare trimestrale)
// by Vonasi - https://www.prorealcode.com/prorealtime-indicators/daily-weekly-monthly-pivot-points/
IF BarIndex = 0 THEN
   PerCent           = 0.01                                              //1%
   lastMonthBarIndex = 0
   monthlyHigh       = undefined
   monthlyLow        = undefined
   monthlyPivot      = undefined
   monthlyR1         = undefined
   monthlyS1         = undefined
   //monthlyR2       = undefined
   //monthlyS2       = undefined
   monthlyR3         = undefined
   monthlyS3         = undefined
Endif
If (Month mod 3) = 1 AND Month <> Month[1] then
   monthlyHigh       = Highest[max(1,BarIndex - lastMonthBarIndex)](High)[1]
   monthlyLow        = Lowest[max(1,BarIndex - lastMonthBarIndex)](Low)[1]
   lastMonthBarIndex = BarIndex
   monthlyPivot      = (monthlyHigh + monthlyLow + Close[1]) / 3
   monthlyR1         = 2*monthlyPivot - monthlyLow
   monthlyS1         = 2*monthlyPivot - monthlyHigh
   //monthlyR2       = monthlyPivot + (monthlyHigh - monthlyLow)
   //monthlyS2       = monthlyPivot - (monthlyHigh - monthlyLow)
   monthlyR3         = monthlyR1 + (monthlyHigh - monthlyLow)
   monthlyS3         = monthlyS1 - (monthlyHigh - monthlyLow)
   SopraR3           = monthlyR3 * (1 + PerCent)
   SottoR3           = monthlyR3 * (1 - PerCent)
   SopraS3           = monthlyS3 * (1 + PerCent)
   SottoS3           = monthlyS3 * (1 - PerCent)
Endif
Risultato            = 0
IF close >= SottoR3 AND close <= SopraR3 THEN
   Risultato         = 1
ELSIF close >= SottoS3 AND close <= SopraS3 THEN
   Risultato         = 2
ENDIF
SCREENER[Risultato](Risultato AS "1=↑,2=↓")
Pivot Semestrali:
// Monthly pivots    (adattato per diventare semestrale)
// by Vonasi - https://www.prorealcode.com/prorealtime-indicators/daily-weekly-monthly-pivot-points/
IF BarIndex = 0 THEN
   PerCent           = 0.01                                              //1%
   lastMonthBarIndex = 0
   monthlyHigh       = undefined
   monthlyLow        = undefined
   monthlyPivot      = undefined
   monthlyR1         = undefined
   monthlyS1         = undefined
   //monthlyR2       = undefined
   //monthlyS2       = undefined
   monthlyR3         = undefined
   monthlyS3         = undefined
Endif
If (Month mod 6) = 1 AND Month <> Month[1] then
   monthlyHigh       = Highest[max(1,BarIndex - lastMonthBarIndex)](High)[1]
   monthlyLow        = Lowest[max(1,BarIndex - lastMonthBarIndex)](Low)[1]
   lastMonthBarIndex = BarIndex
   monthlyPivot      = (monthlyHigh + monthlyLow + Close[1]) / 3
   monthlyR1         = 2*monthlyPivot - monthlyLow
   monthlyS1         = 2*monthlyPivot - monthlyHigh
   //monthlyR2       = monthlyPivot + (monthlyHigh - monthlyLow)
   //monthlyS2       = monthlyPivot - (monthlyHigh - monthlyLow)
   monthlyR3         = monthlyR1 + (monthlyHigh - monthlyLow)
   monthlyS3         = monthlyS1 - (monthlyHigh - monthlyLow)
   SopraR3           = monthlyR3 * (1 + PerCent)
   SottoR3           = monthlyR3 * (1 - PerCent)
   SopraS3           = monthlyS3 * (1 + PerCent)
   SottoS3           = monthlyS3 * (1 - PerCent)
Endif
Risultato            = 0
IF close >= SottoR3 AND close <= SopraR3 THEN
   Risultato         = 1
ELSIF close >= SottoS3 AND close <= SopraS3 THEN
   Risultato         = 2
ENDIF
SCREENER[Risultato](Risultato AS "1=↑,2=↓")
Questo è quello annuale, ma non sarà precisissimo perché è calcolato sul TF settimanale ed una settimana non è detto che corrisponda sempre all’inizio dell’anno:
// Monthly pivots    (adattato per diventare annuale, usando il TF settimanale)
// by Vonasi - https://www.prorealcode.com/prorealtime-indicators/daily-weekly-monthly-pivot-points/
TIMEFRAME(Weekly)
IF BarIndex = 0 THEN
   PerCent           = 0.01                                              //1%
   lastMonthBarIndex = 0
   monthlyHigh       = undefined
   monthlyLow        = undefined
   monthlyPivot      = undefined
   monthlyR1         = undefined
   monthlyS1         = undefined
   //monthlyR2       = undefined
   //monthlyS2       = undefined
   monthlyR3         = undefined
   monthlyS3         = undefined
Endif
If Year <> Year[1] then
   monthlyHigh       = Highest[max(1,BarIndex - lastMonthBarIndex)](High)[1]
   monthlyLow        = Lowest[max(1,BarIndex - lastMonthBarIndex)](Low)[1]
   lastMonthBarIndex = BarIndex
   monthlyPivot      = (monthlyHigh + monthlyLow + Close[1]) / 3
   monthlyR1         = 2*monthlyPivot - monthlyLow
   monthlyS1         = 2*monthlyPivot - monthlyHigh
   //monthlyR2       = monthlyPivot + (monthlyHigh - monthlyLow)
   //monthlyS2       = monthlyPivot - (monthlyHigh - monthlyLow)
   monthlyR3         = monthlyR1 + (monthlyHigh - monthlyLow)
   monthlyS3         = monthlyS1 - (monthlyHigh - monthlyLow)
   SopraR3           = monthlyR3 * (1 + PerCent)
   SottoR3           = monthlyR3 * (1 - PerCent)
   SopraS3           = monthlyS3 * (1 + PerCent)
   SottoS3           = monthlyS3 * (1 - PerCent)
Endif
TIMEFRAME(default)
Risultato            = 0
IF close >= SottoR3 AND close <= SopraR3 THEN
   Risultato         = 1
ELSIF close >= SottoS3 AND close <= SopraS3 THEN
   Risultato         = 2
ENDIF
SCREENER[Risultato](Risultato AS "1=↑,2=↓")
Io non ne ho provato nessuno. Provali tu e fammi sapere.
Non preoccuparti per il nome delle variabili, non ha importanza e per semplicità ho mantenuto tutto invariato.
buonasera,
leggo spesso il forum per individuare nuove idee e cogliere nuove opportunità di apprendimento sia per la programmazione che per analisi tecnica .
A tal proposito, ho provato lo screener e l’indicatore sviluppati su richiesta.
Onestamente, mi piacerebbe capire i risultati ottenuti sul titolo, per un eventuale possibilità di acquisto.
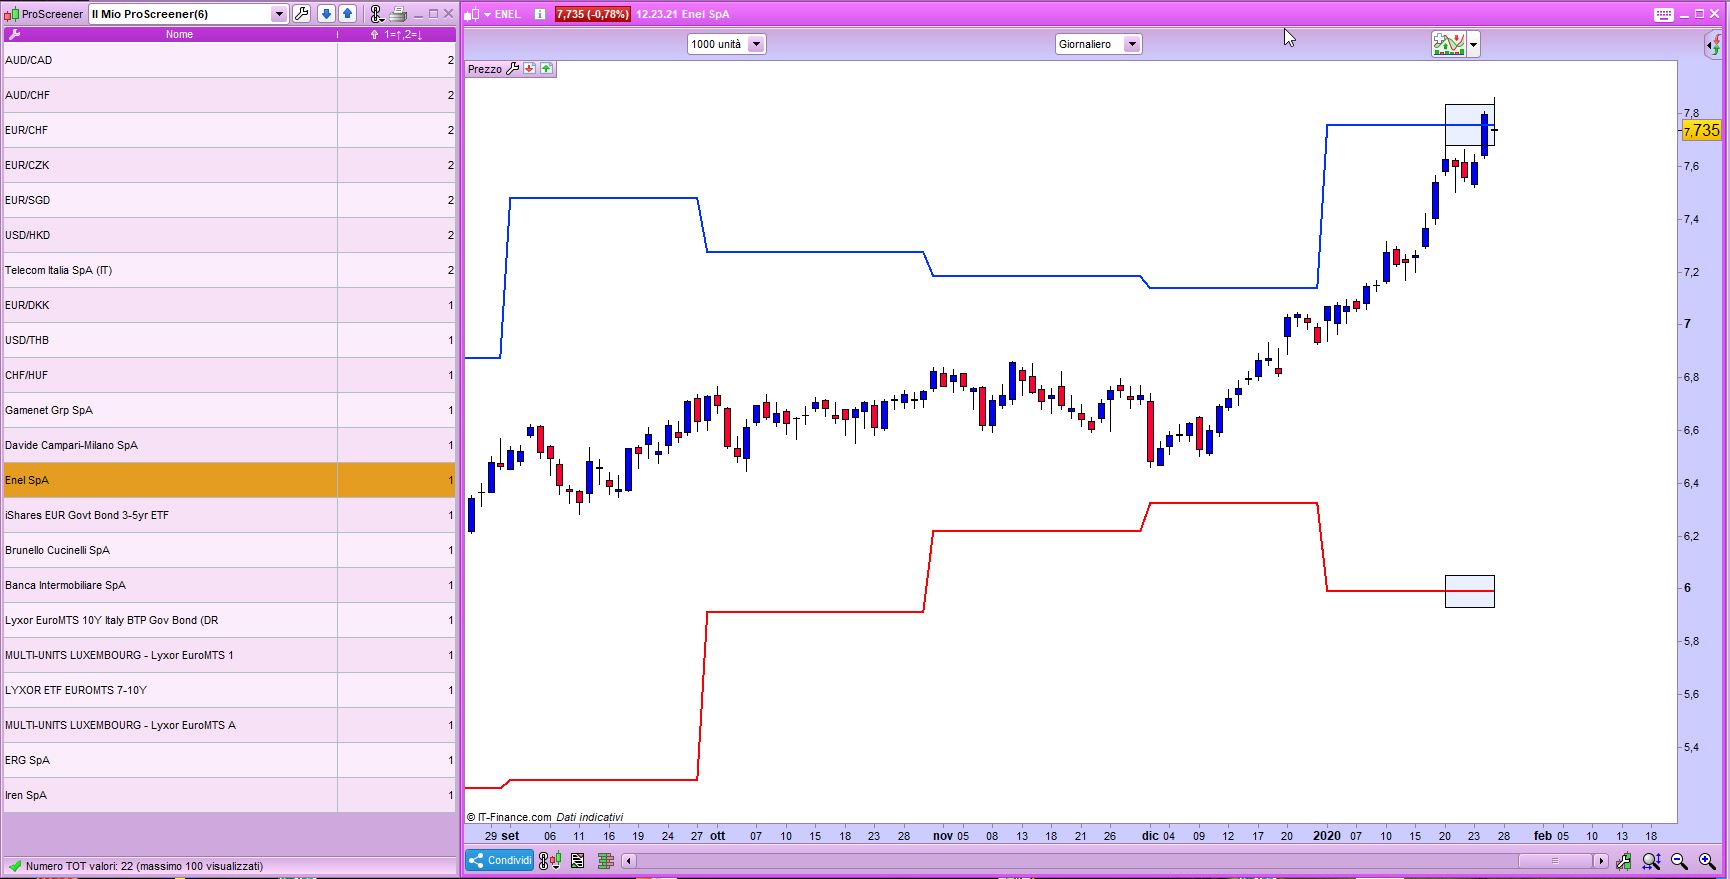
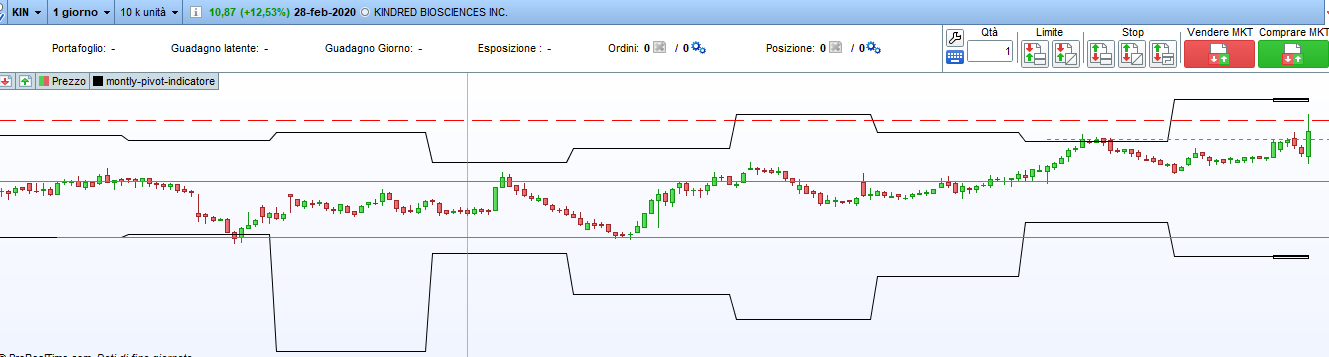
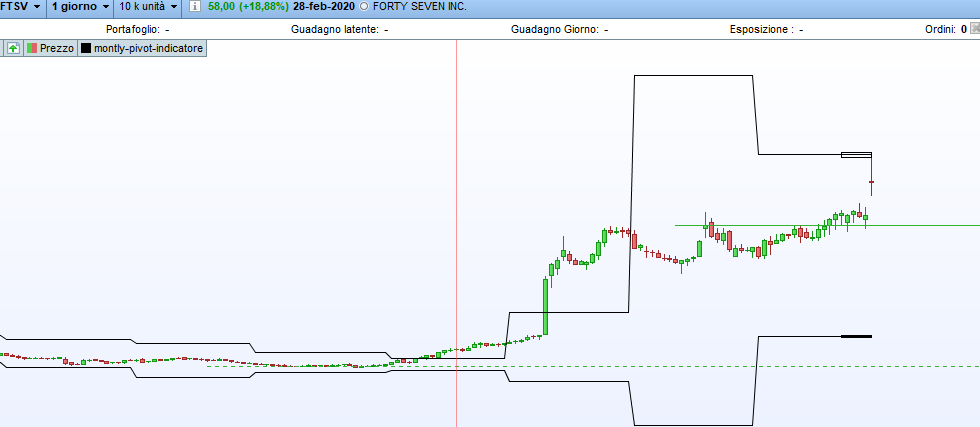
allego i grafici estratti dallo screener
Grazie in anticipo
raffaele
Non so quale hai usato, su quale TF e su quali strumenti.
Cosa vorresti approfondire dei risultati?
ho usato il primo Screener dei tre che hai sviluppato, TF giornaliero,
Non mi è chiaro l’obiettivo delle linee di R3 ed S3 e4d i rettangoli della percentuale indicata, +-).
Se puoi aggiungere qualche dettaglio tecnico prendendo in esame i due grafici che ho allegato. grazie
L’obiettivo è di evidenziare i titoli che si avvicinano a R3 ed S3 di circa l’1% evidenziando la zona con un rettangolo.
Evidentemente per essere avvisati in tempo e tenere d’occhio quello strumento per approfittare di un eventuale rottura o rimbalzo del prezzo.
Il primo post è quello con le spiegazioni dello scopo.