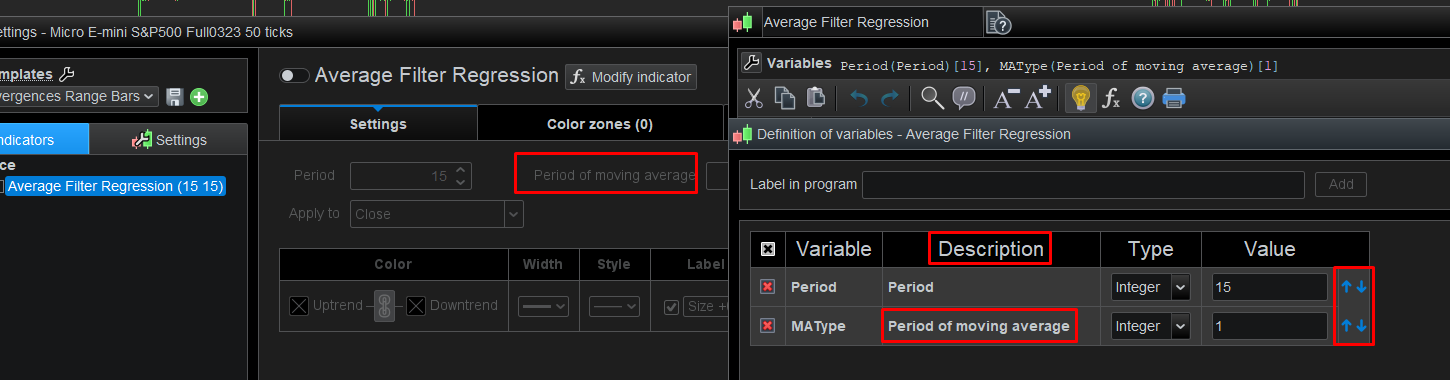
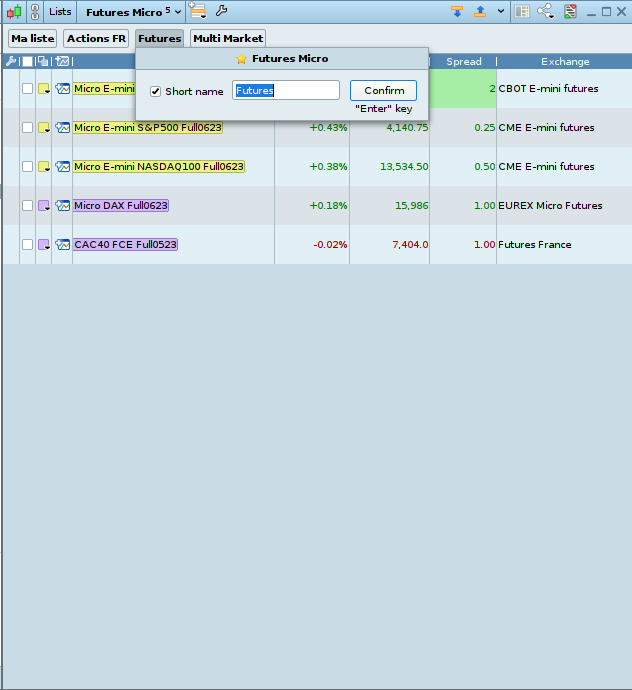
It’s back! We can now modify the order of the variables defined in a code, as well as the possibility of giving them a label different from the name of the variable in the code (At the time of the creation, name variable=label)
What I would wish for : A commentary description in such a line, just as I would do in the program code. This is about things which would occur to you on the fly. Example :
When this value is lower than 20.2, SellingThreshold will lose its effect.
It could show by mouse hovering.
This comment can’t be put in the program code (during backtesting) because you only look at the backtesting variables and play with those, which is outside of the program code.
I wanted to suggest this for 100+ times. Now I finally did …
I think this Topic is for announcing features that PRT HAVE ALREADY included in v12.
To stand a better chance of getting a NEW Suggestion for Improvement included in the future then submit the Suggestion Form on the link below. Click ‘Suggestion Box‘ under the Photo on the left.
can i suggest an implementation about the walk forward optimization?
Actually the sistem only give the best solution and doesnt give any choice of the backtest. I try to explain better myself.
In the optimization without WF(walk forward) you can chooce each parameter and decide which one to pick, but when you try to do a walf forward you receive only one solution, this should be changed in order to have a list of parameters with walf forward and then see the one you choose how perform in the Out of Sample period.
Allow me to announce a new feature as well – out of all about he only one which deals with the coding environment.
It’s almost like an Easter egg :
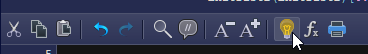
(A kind of) Intellisense.
Start with clicking the lightbulb. That is : it is default on, so if you clicked it before it will now be off and intellisense is also off.
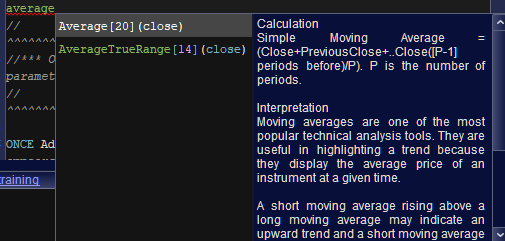
Next, during typing of commands, you will see the help you may have been used to from clicking the lightbulb in previous versions. The difference : that text now appears on the fly, during typing.
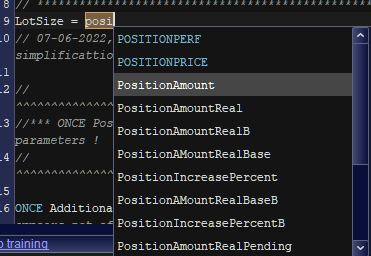
Then I start typing for variables, and what’s in the 3rd attachment shows. You now can arrow-down to the variable you want and press Enter. Now the chosen variable appears in the code in full.
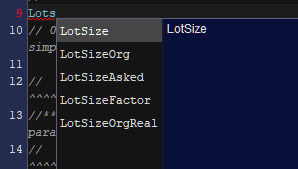
If the intellisense system found commands as well, then these show too (4th attachment).
If this was announced somewhere then I completely missed it. If I google for it – nowhere.
If this was not announced then I don’t know why. It should be a greatest feature for newcomers.
In v11 we had to CTRL+SPACE to get it working for instruction only (not variables). I found the new version very useful with the variables feature! I don’t remember if we talked about it before in that topic, thanks for your addition!
Please can any users of V12 tell me if it is possible to filter / show performance per week / per day of running Systems? (An easy quick way I mean … not by opening each separate System Detailed Report.)
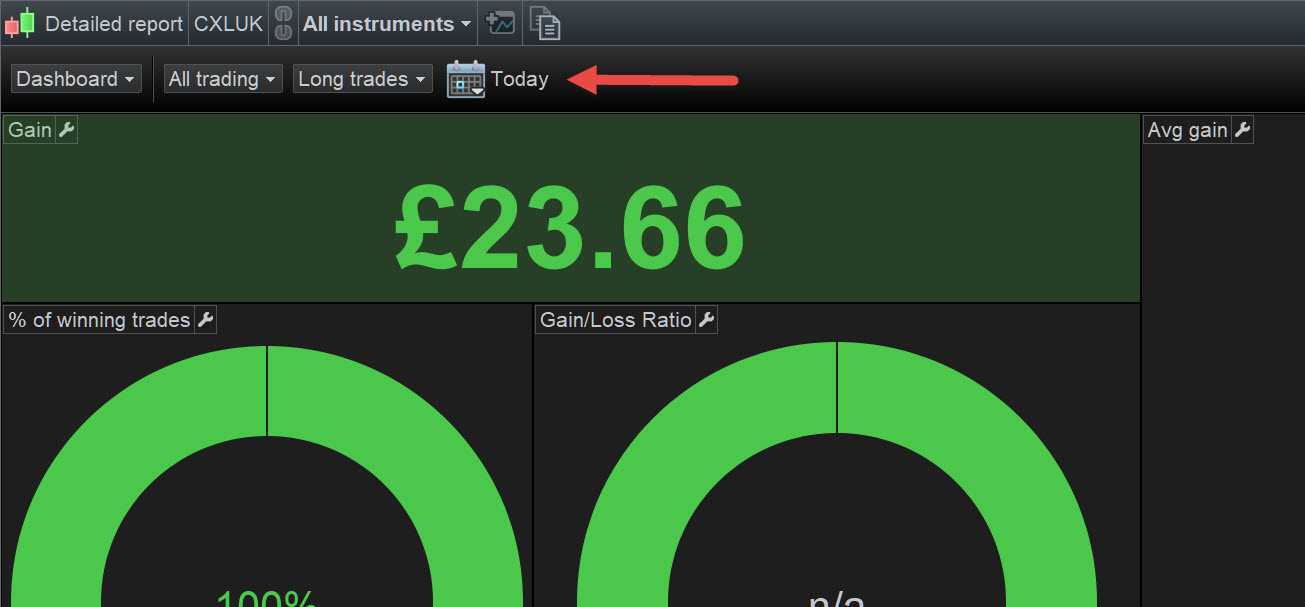
Easiest way / place for PRT to provide this would be to add a Period widget to the toolbar on ProOrder Autotrading window (same as we have on the Portfolio Detailed Report window).
It’s crazy and frustrating …
In v11, the Portfolio Detailed Report has a period widget, but can’t filter / show for Systems
2. In v11, The ProOrder Autotrading window shows Systems but has no period widget.
I have Suggested above to PRT about 2 years ago, but I need to know if this function (see my Q1 above) is available in v12 before I Suggest it to PRT again.
Easiest way / place for PRT to provide this would be to add a Period widget to the toolbar on ProOrder Autotrading window (same as we have on the Portfolio Detailed Report window).
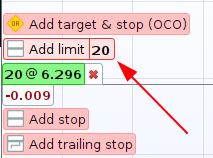
Attached (at the red arrowhead) is what I am referring to above.
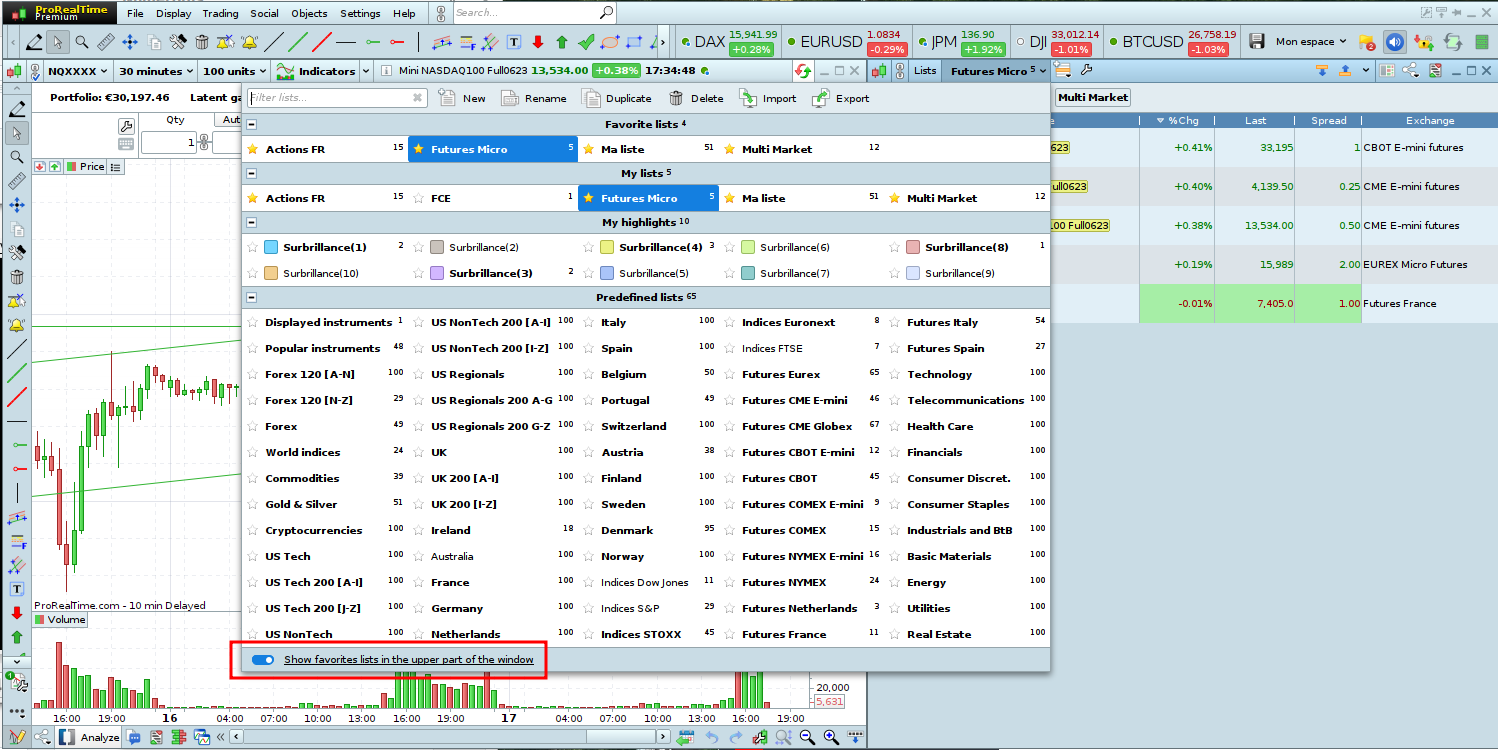
New video v12Would you like to perform several analyses on the same instrument, to change perspective without overloading the chart?Find out how to create multiple studies, view the list of all your plotted objects and manage them easily.
📢 📽New video v12 📽📢
Would you like to perform several analyses on the same instrument, to change perspective without overloading the chart?
Find out how to create multiple studies, view the list of all your plotted objects and manage them easily.https://t.co/o9PR1SiIBJ
The information collected on this form is stored in a computer file by ProRealCode to create and access your ProRealCode profile. This data is kept in a secure database for the duration of the member's membership. They will be kept as long as you use our services and will be automatically deleted after 3 years of inactivity. Your personal data is used to create your private profile on ProRealCode. This data is maintained by SAS ProRealCode, 407 rue Freycinet, 59151 Arleux, France. If you subscribe to our newsletters, your email address is provided to our service provider "MailChimp" located in the United States, with whom we have signed a confidentiality agreement. This company is also compliant with the EU/Swiss Privacy Shield, and the GDPR.
For any request for correction or deletion concerning your data, you can directly contact the ProRealCode team by email at privacy@prorealcode.com
If you would like to lodge a complaint regarding the use of your personal data, you can contact your data protection supervisory authority.
Get Assistance
Assistance Type
Your Need
Proposed Solutions
Do you like cookies? 🍪 We use cookies to ensure you get the best experience on our website.
(Learn more)