Link
LinkParticipant
Senior
I am trying to adapt this Nicolas Money management system to my strategy.
The problem is that I can’t get that when the strategy profit falls below the equity curve the system stops operating.
So far what I have is this:
//variables
equitycurve = undefined
curveperiod = 17280
once mydays = 1
once olddate = 0
//indicators
equitycurve = average[curveperiod](strategyprofit)
//mydays variable incrementing to let the average curve build over time
if date > olddate then
mydays=mydays+1
olddate = date
endif
//first trades while the average profit curve is building
IF CONDBUY and Strategyprofit <= 20000 and NOT LongOnMarket AND mydays<curveperiod THEN
ONCE Positionsize = 0.5
buy positionsize contract at market
SET TARGET %PROFIT 2
SET STOP %LOSS 1.5
ELSE
//trades when the curve has built
IF CONDBUY and Strategyprofit <= 20000 and NOT LongOnMarket AND strategyprofit>=equitycurve AND mydays>curveperiod THEN
ONCE Positionsize = 0.5
buy positionsize contract at market
SET TARGET %PROFIT 2
SET STOP %LOSS 1.5
ENDIF
ENDIF
//first trades while the average profit curve is building
IF CONDBUY and Strategyprofit >= 20000 and NOT LongOnMarket AND mydays<curveperiod THEN
ONCE Positionsize = 0.5
buy positionsize contract at market
SET TARGET %PROFIT 2
SET STOP %LOSS 1.5
ELSE
//trades when the curve has built
IF CONDBUY and Strategyprofit >= 20000 and NOT LongOnMarket AND strategyprofit>=equitycurve AND mydays>curveperiod THEN
ONCE Positionsize = 0.5
buy positionsize contract at market
SET TARGET %PROFIT 2
SET STOP %LOSS 1.5
ENDIF
ENDIF
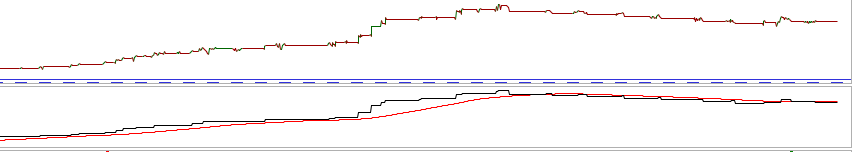
GRAPH equitycurve coloured(255,0,0) as "equity curve"
GRAPH strategyprofit as "strategy profit"
Have you tried with Line 2 commented out, Rem’d out?
Also the CurvePeriod is very large, how did you arrive at 17280?
Just a few thoughts.
LinkParticipant
Senior
17280 is 60 days of trading on 5 minutes bars.
3 montes.
LinkParticipant
Senior
From the link you posted, it states the code was written for PRT v10.2 so maybe it does not wotk correctly on v11.
Just more thoughts from me, but hopefully a coding wizard will be along to help you.
LinkParticipant
Senior
My versión es 10.2 or 10.3.
Lines 48-50 do the job:
//variables
ONCE equitycurve = 0
curveperiod = 17280
once mydays = 1
once olddate = 0

//indicators
equitycurve = average[curveperiod](strategyprofit)

//mydays variable incrementing to let the average curve build over time
if date > olddate then
mydays=mydays+1
olddate = date
endif
CONDBUY = close crosses over average[200,0](close)
//first trades while the average profit curve is building
IF CONDBUY and Strategyprofit <= 20000 and NOT LongOnMarket AND mydays<curveperiod THEN
ONCE Positionsize = 0.5
buy positionsize contract at market
SET TARGET %PROFIT 2
SET STOP %LOSS 1.5
ELSE
//trades when the curve has built
IF CONDBUY and Strategyprofit <= 20000 and NOT LongOnMarket AND strategyprofit>=equitycurve AND mydays>curveperiod THEN
ONCE Positionsize = 0.5
buy positionsize contract at market
SET TARGET %PROFIT 2
SET STOP %LOSS 1.5
ENDIF
ENDIF

//first trades while the average profit curve is building
IF CONDBUY and Strategyprofit >= 20000 and NOT LongOnMarket AND mydays<curveperiod THEN
ONCE Positionsize = 0.5
buy positionsize contract at market
SET TARGET %PROFIT 2
SET STOP %LOSS 1.5
ELSE
//trades when the curve has built
IF CONDBUY and Strategyprofit >= 20000 and NOT LongOnMarket AND strategyprofit>=equitycurve AND mydays>curveperiod THEN
ONCE Positionsize = 0.5
buy positionsize contract at market
SET TARGET %PROFIT 2
SET STOP %LOSS 1.5
ENDIF
ENDIF

IF StrategyProfit CROSSES UNDER equitycurve THEN
QUIT
ENDIF

GRAPH equitycurve coloured(255,0,0) as "equity curve"
GRAPH strategyprofit as "strategy profit"
You wrote “system stops operating“. Indeed pausing it makes no sense, since it’s almost like QUIT if you don’t add any condition to resume operations, but… there you go:
//variables
ONCE equitycurve = 0
curveperiod = 17280
once mydays = 1
once olddate = 0
//indicators
equitycurve = average[curveperiod](strategyprofit)
ONCE TradeON = 1
IF StrategyProfit CROSSES UNDER equitycurve THEN
TradeON = 0
ENDIF
//mydays variable incrementing to let the average curve build over time
if date > olddate then
mydays=mydays+1
olddate = date
endif
CONDBUY = close crosses over average[200,0](close) AND TradeON
//first trades while the average profit curve is building
IF CONDBUY and Strategyprofit <= 20000 and NOT LongOnMarket AND mydays<curveperiod THEN
ONCE Positionsize = 0.5
buy positionsize contract at market
SET TARGET %PROFIT 2
SET STOP %LOSS 1.5
ELSE
//trades when the curve has built
IF CONDBUY and Strategyprofit <= 20000 and NOT LongOnMarket AND strategyprofit>=equitycurve AND mydays>curveperiod THEN
ONCE Positionsize = 0.5
buy positionsize contract at market
SET TARGET %PROFIT 2
SET STOP %LOSS 1.5
ENDIF
ENDIF
//first trades while the average profit curve is building
IF CONDBUY and Strategyprofit >= 20000 and NOT LongOnMarket AND mydays<curveperiod THEN
ONCE Positionsize = 0.5
buy positionsize contract at market
SET TARGET %PROFIT 2
SET STOP %LOSS 1.5
ELSE
//trades when the curve has built
IF CONDBUY and Strategyprofit >= 20000 and NOT LongOnMarket AND strategyprofit>=equitycurve AND mydays>curveperiod THEN
ONCE Positionsize = 0.5
buy positionsize contract at market
SET TARGET %PROFIT 2
SET STOP %LOSS 1.5
ENDIF
ENDIF
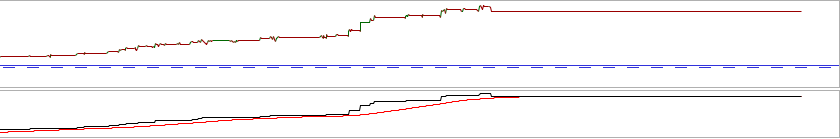
GRAPH equitycurve coloured(255,0,0) as "equity curve"
GRAPH strategyprofit as "strategy profit"
I added lines 10-13, then added TradeON to CONDBUY at line 19.
LinkParticipant
Senior
With this code the system stops operating when the profit strategy falls below the equity curve.
It is about operating again when the profit strategy crosses up the equity curve again.
How can the curve go up again if trading is paused?
Try adding this AFTER line 13:
IF StrategyProfit CROSSES OVER equitycurve THEN
    TradeON = 1
ENDIF
LinkParticipant
Senior
Equity Curve Average Filter
This Code thats OK!!!!!!!!!!!!!!
🙂
LinkParticipant
Senior
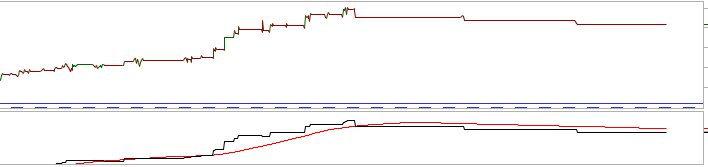
It does something, but this code doesn’t work well either.
It should stop operating but continues to operate.