Outil retracement de Fibonacci pour le price action

Viewing 15 posts - 16 through 30 (of 34 total)
  • Author
    Posts
  • #173457 quote
    Axel98
    Participant
    Average

    Oui tout à fait

    #173795 quote
    Axel98
    Participant
    Average

    Bonjour Nicolas,

    Est-ce que tu as constaté le même problème ou bien suis-je le seul à avoir ce souci sur mes graphiques ?

    #173803 quote
    JC_Bywan
    Moderator
    Master

    De mon côté j’ai essayé sur quelques actifs ce matin, même changé de timezone au cas où, je ne suis pas tombé sur un cas ne marchant pas pour le moment… je referai quelques essais plus tard, pas de piste pour le moment…

    #173812 quote
    Axel98
    Participant
    Average

    Bonjour Noobywan,

    Merci pour ce retour…  Pour ma part j’ai le souci sur tous les actifs. Au moment de l’installation de l’indicateur sur le graphique c’est parfait, et au fur et à mesure des chandeliers avec de nouveaux plus bas ou plus hauts quotidiens l’affichage se met sur le bas ou le haut du corps de la bougie mais en ignorant les mèches qui correspondent aux plus vrais plus bas ou hauts du jour 🙁

    #173817 quote
    JC_Bywan
    Moderator
    Master

    ok, je viens d’avoir le problème, je crois que j’ai trouvé pourquoi, potentiel bug Dhigh(0) (pas sur historique, sur live), je reboucle avec Nicolas hors forum pour confirmer/infirmer

    #173823 quote
    JC_Bywan
    Moderator
    Master

    Les données détaillées du problème ont été transmises à itf par Nicolas, on vous tient au courant.

    #173943 quote
    warningff
    Participant
    Average

    Es ce possible de faire du fibo auto prenant en compte les sorties de bollinguer


    A chaque sortie de bollinguer , un nouveau fibo se trace ?

    #173991 quote
    Nicolas
    Keymaster
    Master

    Oui c’est possible bien entendu. Le code ci-dessous est adapté de celui de la première page, on trace les niveaux de Fibonacci en fonction du plus haut au dessus de la bande haute et du plus bas de la bande basse:

    // Price Action Tools | Indicator
    // 25.05.2019 (Release 1.0)
    // Swapping @ www.forexswap.fr
    // Sharing ProRealTime knowledge
    // fibonacci on bollinger bands inside/out - Nicolas
    // https://www.prorealcode.com/topic/price-action-tools/page/2/#post-173943
    
    DefParam DrawOnLastBarOnly = true
    
    // --- Property settings
    XOffset = 10           // Text XOffset
    Alpha   = 255           // Text Transparency
    SetBar  = 0            // Width adjustment rectangle
    
    // --- end
    
    // --- init
    XOffset = max(2,XOffset)
    alpha = max(alpha,0)     // Limited input "Alpha"
    alpha = min(alpha,255)   // (0 min, 255 max)
    // --- end
    
    bup=BollingerUp[20](close)
    bdn=BollingerDown[20](close)
    
    if high > bup then 
    HiDay  = high
    starthi=barindex
    endif 
    if low < bdn then  
    LowDay = low
    startlo=barindex
    endif 
    
    // Bullish 
    if starthi > startlo then    
    fib100 = lowday              //0%
    fib0 = hiday                  //100%            
    
    DrawText("Top",BarIndex-XOffset-3,fib100,SansSerif,Bold,16) coloured(20,140,0,alpha)
    DrawSegment(BarIndex[XOffset-2],fib100,BarIndex,fib100) coloured(0,0,0,alpha)
    fib76 = (fib100-fib0)*.764+fib0 //76.4%
    DrawText("76.4% ",BarIndex-XOffset,fib76,SansSerif,Standard,15) coloured(20,140,0,alpha)
    DrawSegment(BarIndex[XOffset-2],fib76,BarIndex,fib76) coloured(0,0,0,alpha)
    fib62 = (fib100-fib0)*.618+fib0 //61.8%
    DrawText("61.8% ",BarIndex-XOffset,fib62,SansSerif,Standard,15) coloured(20,140,0,alpha)
    DrawSegment(BarIndex[XOffset-2],fib62,BarIndex,fib62) coloured(0,0,0,alpha)
    fib50 = (fib100-fib0)/2+fib0    //50%
    DrawText("50.0% ",BarIndex-XOffset,fib50,SansSerif,Standard,15) coloured(20,140,0,alpha)
    DrawSegment(BarIndex[XOffset-2],fib50,BarIndex,fib50) coloured(0,0,0,alpha)
    fib38 = (fib100-fib0)*.382+fib0 //38.2%
    DrawText("38.2% ",BarIndex-XOffset,fib38,SansSerif,Standard,15) coloured(20,140,0,alpha)
    DrawSegment(BarIndex[XOffset-2],fib38,BarIndex,fib38) coloured(0,0,0,alpha)
    fib24 = (fib100-fib0)*.236+fib0 //23.6%
    DrawText("23.6% ",BarIndex-XOffset,fib24,SansSerif,Standard,15) coloured(20,140,0,alpha)
    DrawSegment(BarIndex[XOffset-2],fib24,BarIndex,fib24) coloured(0,0,0,alpha)
    
    DrawText("0% ",BarIndex-XOffset,fib0,SansSerif,Standard,15) coloured(20,140,0,alpha)
    DrawSegment(BarIndex[XOffset-2],fib0,BarIndex,fib0) coloured(0,0,0,alpha)
    else  // Bearish 
    fib100 = hiday               //100%
    fib0 = lowday                  //0%
    DrawText("Bottom",BarIndex-XOffset-3,fib0,SansSerif,Bold,16) coloured(190,10,10,alpha)
    DrawSegment(BarIndex[XOffset-2],fib0,BarIndex,fib0) coloured(0,0,0,alpha)
    fib76 = (fib100-fib0)*.764+fib0 //23.6%
    DrawText("23.6% ",BarIndex-XOffset,fib76,SansSerif,Standard,15) coloured(190,10,10,alpha)
    DrawSegment(BarIndex[XOffset-2],fib76,BarIndex,fib76) coloured(0,0,0,alpha)
    fib62 = (fib100-fib0)*.618+fib0 //38.2%
    DrawText("38.2% ",BarIndex-XOffset,fib62,SansSerif,Standard,15) coloured(190,10,10,alpha)
    DrawSegment(BarIndex[XOffset-2],fib62,BarIndex,fib62) coloured(0,0,0,alpha)
    fib50 = (fib100-fib0)*.5+fib0   //50%
    DrawText("50.0% ",BarIndex-XOffset,fib50,SansSerif,Standard,15) coloured(190,10,10,alpha)
    DrawSegment(BarIndex[XOffset-2],fib50,BarIndex,fib50) coloured(0,0,0,alpha)
    fib38 = (fib100-fib0)*.382+fib0 //61.8%
    DrawText("61.8% ",BarIndex-XOffset,fib38,SansSerif,Standard,15) coloured(190,10,10,alpha)
    DrawSegment(BarIndex[XOffset-2],fib38,BarIndex,fib38) coloured(0,0,0,alpha)
    fib24 = (fib100-fib0)*.236+fib0 //76.4%
    DrawText("76.4% ",BarIndex-XOffset,fib24,SansSerif,Standard,15) coloured(190,10,10,alpha)
    DrawSegment(BarIndex[XOffset-2],fib24,BarIndex,fib24) coloured(0,0,0,alpha)
    
    DrawText("0% ",BarIndex-XOffset,fib100,SansSerif,Standard,15) coloured(190,10,10,alpha)
    DrawSegment(BarIndex[XOffset-2],fib100,BarIndex,fib100) coloured(0,0,0,alpha)
    endif
    
    
    return
    fibonacci-on-bollinger-bands.png fibonacci-on-bollinger-bands.png
    #174008 quote
    warningff
    Participant
    Average

    Super merci , je vais tester d’y intégrer des niveau  fractal zigzag.


    🙂

    #174011 quote
    warningff
    Participant
    Average

    Oui malheureusement je n’arrive pas à trouver la logique du code pour y intégrer les fractal zigzag.

    en instaurant le code par une variable, indicator1 = call “nom de l’indicateur”

    et rajoutant

    if high > indicator1 then
    HiDay = high
    Starthi=barindex
    endif
    If low < indicator1 then
    LowDay = low
    startlo=barindex
    endif


    il me dit que l’indicateur n’a 0 valeur.

    J’ai donc intauré le code du zigzagfractal pour y mettre

    if high > LL then
    HiDay = high
    Starthi=barindex
    endif
    If low < LH then
    LowDay = low
    startlo=barindex
    endif


    Mais rien, je n’ai pas du comprendre la logique de ce code.


    CODE ZIGZAG FRACTAL
    
    //---external parameters
    cp = 3
    
    once lastpoint = 0
    
    if high[cp] >= highest[2*cp+1](high) then
    LH = 1
    else
    LH = 0
    endif
    
    if low[cp] <= lowest[2*cp+1](low) then
    LL = -1
    else
    LL = 0
    endif
    
    if LH = 1 then
    TOPy = high[cp]
    TOPx = barindex[cp]
    endif
    
    if LL = -1 then
    BOTy = low[cp]
    BOTx = barindex[cp]
    endif
    
    if LH>0 and (lastpoint=-1 or lastpoint=0) then
    DRAWSEGMENT(lastX,lastY,TOPx,TOPy) COLOURED(200,0,0,255)
    DRAWTEXT("■",TOPx,TOPy,Dialog,Bold,20) coloured(200,0,0,255)
    lastpoint = 1
    lastX = TOPx
    lastY = TOPy
    endif
    if LL<0 and (lastpoint=1 or lastpoint=0) then
    DRAWSEGMENT(lastX,lastY,BOTx,BOTy) COLOURED(0,200,0,255)
    DRAWTEXT("■",BOTx,BOTy,Dialog,Bold,20) coloured(0,200,0,255)
    lastpoint = -1
    lastX = BOTx
    lastY = BOTy
    endif
    
    RETURN


    Code fibo auto Bollinguer à remplacer par ZIGZAG fractal


    1
    2
    3
    4
    5
    6
    7
    8
    9
    10
    11
    12
    13
    14
    15
    16
    17
    18
    19
    20
    21
    22
    23
    24
    25
    26
    27
    28
    29
    30
    31
    32
    33
    34
    35
    36
    37
    38
    39
    40
    41
    42
    43
    44
    45
    46
    47
    48
    49
    50
    51
    52
    53
    54
    55
    56
    57
    58
    59
    60
    61
    62
    63
    64
    65
    66
    67
    68
    69
    70
    71
    72
    73
    74
    75
    76
    77
    78
    79
    80
    81
    82
    83
    84
    85
    86
    // Price Action Tools | Indicator
    // 25.05.2019 (Release 1.0)
    // Sharing ProRealTime knowledge
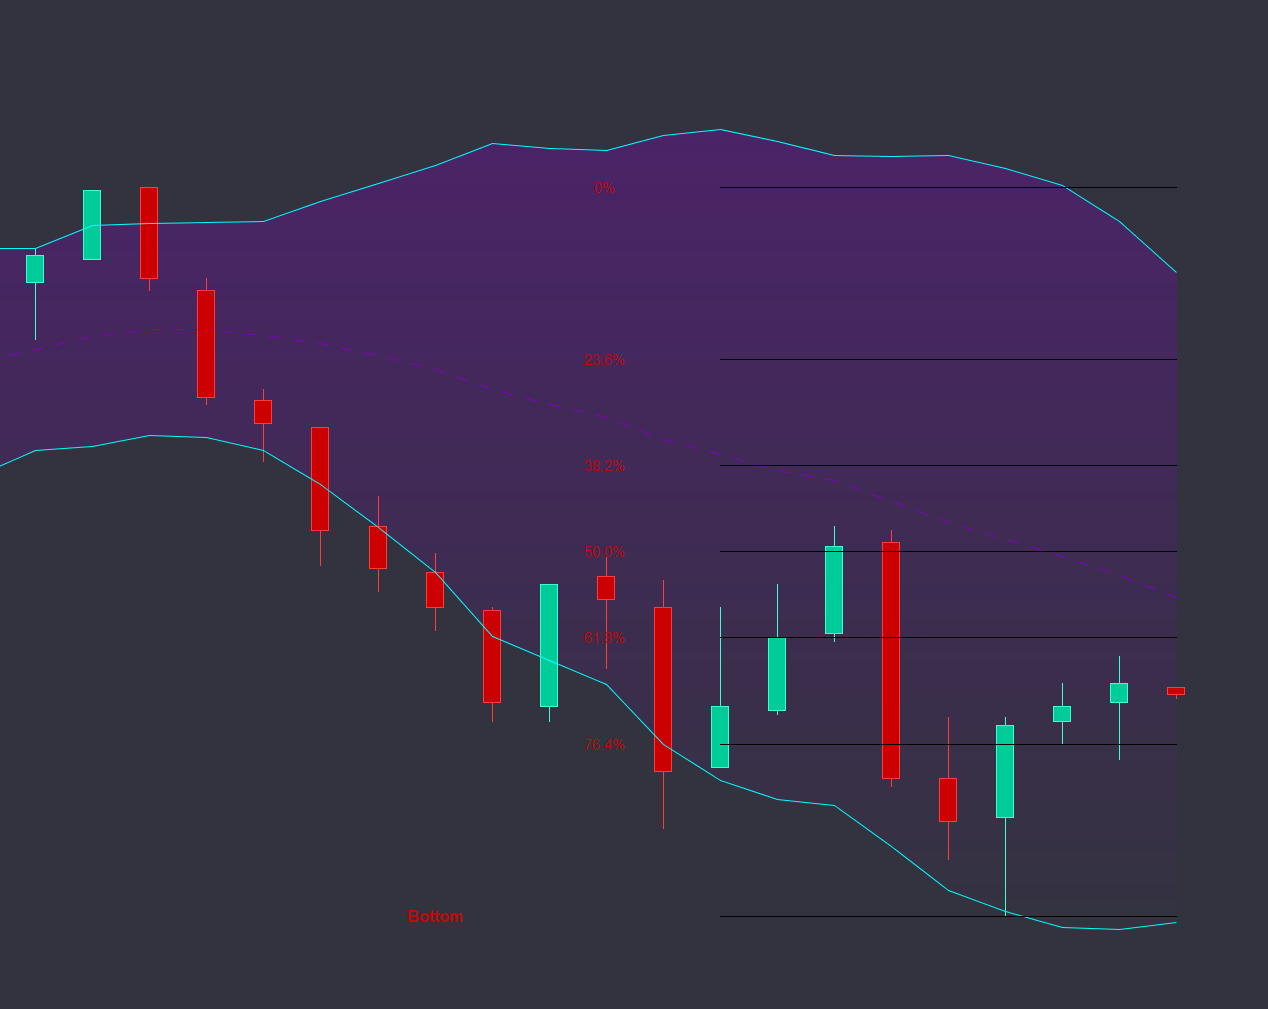
    // fibonacci on bollinger bands inside/out – Nicolas
    DefParam DrawOnLastBarOnly = true
    // — Property settings
    XOffset = 10           // Text XOffset
    Alpha   = 255           // Text Transparency
    SetBar  = 0            // Width adjustment rectangle
    // — end
    // — init
    XOffset = max(2,XOffset)
    alpha = max(alpha,0)     // Limited input “Alpha”
    alpha = min(alpha,255)   // (0 min, 255 max)
    // — end
    bup=BollingerUp[20](close)
    bdn=BollingerDown[20](close)
    if high > bup then
    HiDay  = high
    starthi=barindex
    endif
    if low < bdn then  
    LowDay = low
    startlo=barindex
    endif
    // Bullish
    if starthi > startlo then    
    fib100 = lowday              //0%
    fib0 = hiday                  //100%            
    DrawText(“Top”,BarIndexXOffset3,fib100,SansSerif,Bold,16) coloured(20,140,0,alpha)
    DrawSegment(BarIndex[XOffset2],fib100,BarIndex,fib100) coloured(0,0,0,alpha)
    fib76 = (fib100fib0)*.764+fib0 //76.4%
    DrawText(“76.4% “,BarIndexXOffset,fib76,SansSerif,Standard,15) coloured(20,140,0,alpha)
    DrawSegment(BarIndex[XOffset2],fib76,BarIndex,fib76) coloured(0,0,0,alpha)
    fib62 = (fib100fib0)*.618+fib0 //61.8%
    DrawText(“61.8% “,BarIndexXOffset,fib62,SansSerif,Standard,15) coloured(20,140,0,alpha)
    DrawSegment(BarIndex[XOffset2],fib62,BarIndex,fib62) coloured(0,0,0,alpha)
    fib50 = (fib100fib0)/2+fib0    //50%
    DrawText(“50.0% “,BarIndexXOffset,fib50,SansSerif,Standard,15) coloured(20,140,0,alpha)
    DrawSegment(BarIndex[XOffset2],fib50,BarIndex,fib50) coloured(0,0,0,alpha)
    fib38 = (fib100fib0)*.382+fib0 //38.2%
    DrawText(“38.2% “,BarIndexXOffset,fib38,SansSerif,Standard,15) coloured(20,140,0,alpha)
    DrawSegment(BarIndex[XOffset2],fib38,BarIndex,fib38) coloured(0,0,0,alpha)
    fib24 = (fib100fib0)*.236+fib0 //23.6%
    DrawText(“23.6% “,BarIndexXOffset,fib24,SansSerif,Standard,15) coloured(20,140,0,alpha)
    DrawSegment(BarIndex[XOffset2],fib24,BarIndex,fib24) coloured(0,0,0,alpha)
    DrawText(“0% “,BarIndexXOffset,fib0,SansSerif,Standard,15) coloured(20,140,0,alpha)
    DrawSegment(BarIndex[XOffset2],fib0,BarIndex,fib0) coloured(0,0,0,alpha)
    else  // Bearish
    fib100 = hiday               //100%
    fib0 = lowday                  //0%
    DrawText(“Bottom”,BarIndexXOffset3,fib0,SansSerif,Bold,16) coloured(190,10,10,alpha)
    DrawSegment(BarIndex[XOffset2],fib0,BarIndex,fib0) coloured(0,0,0,alpha)
    fib76 = (fib100fib0)*.764+fib0 //23.6%
    DrawText(“23.6% “,BarIndexXOffset,fib76,SansSerif,Standard,15) coloured(190,10,10,alpha)
    DrawSegment(BarIndex[XOffset2],fib76,BarIndex,fib76) coloured(0,0,0,alpha)
    fib62 = (fib100fib0)*.618+fib0 //38.2%
    DrawText(“38.2% “,BarIndexXOffset,fib62,SansSerif,Standard,15) coloured(190,10,10,alpha)
    DrawSegment(BarIndex[XOffset2],fib62,BarIndex,fib62) coloured(0,0,0,alpha)
    fib50 = (fib100fib0)*.5+fib0   //50%
    DrawText(“50.0% “,BarIndexXOffset,fib50,SansSerif,Standard,15) coloured(190,10,10,alpha)
    DrawSegment(BarIndex[XOffset2],fib50,BarIndex,fib50) coloured(0,0,0,alpha)
    fib38 = (fib100fib0)*.382+fib0 //61.8%
    DrawText(“61.8% “,BarIndexXOffset,fib38,SansSerif,Standard,15) coloured(190,10,10,alpha)
    DrawSegment(BarIndex[XOffset2],fib38,BarIndex,fib38) coloured(0,0,0,alpha)
    fib24 = (fib100fib0)*.236+fib0 //76.4%
    DrawText(“76.4% “,BarIndexXOffset,fib24,SansSerif,Standard,15) coloured(190,10,10,alpha)
    DrawSegment(BarIndex[XOffset2],fib24,BarIndex,fib24) coloured(0,0,0,alpha)
    DrawText(“0% “,BarIndexXOffset,fib100,SansSerif,Standard,15) coloured(190,10,10,alpha)
    DrawSegment(BarIndex[XOffset2],fib100,BarIndex,fib100) coloured(0,0,0,alpha)
    endif
    return


    Merci à vous 🙂

    #174046 quote
    Nicolas
    Keymaster
    Master

    Désolé, je ne comprends pas ce qu’il faut faire ? Tracer les retracements fibo entre 2 fractals ? Plus de Bollinger ?

    Si oui voir cet indicateur: ZigZag Fibonacci levels

    #174050 quote
    warningff
    Participant
    Average

    Merci pour ta réponse 🙂

    Non ce n’est pas via cette indicateur car le ZIGZAG d’origine est par pourcentage et ne prends pas en compte les mèches. j’aimerais un fibo auto via cette indicateur (zigzag, fractales) ( sans bollinguer)


    Indicateur ci joint


    merci à vous

    PRC_FractalsZigZag.itf
    #174052 quote
    warningff
    Participant
    Average

    petite question, ) votre avis es ce possible de mettre une drawarrowdown(barindex[0],high[0]+2)coloured(255,215,0) quand le prix retrace sur un niveau fibo ?

    c1= (low < fib38)
    if c1 then
    drawarrowdown(barindex[0],high[0]+2)coloured(255,215,0)

    je pense que le fibo auto n’a pas de valeur mais graphique dessin… du coup je ne sais pas si cela est possible.

    #174364 quote
    Axel98
    Participant
    Average

    Bonjour,

    Vous n’avez pas eu de retour concernant le problème évoqué plus haut (non prise en compte du plus haut/bas lors des réactualisations) ?

    Merci d’avance

    #174365 quote
    JC_Bywan
    Moderator
    Master

    Bonjour Axel98, à ce stade je ne sais pas s’il n’y a pas eu de retour du tout, ou s’il y en a peut-être eu un mais en attente dans le courrier de Nicolas qui est indisponible pour le moment.

Viewing 15 posts - 16 through 30 (of 34 total)
  • You must be logged in to reply to this topic.

Outil retracement de Fibonacci pour le price action


ProBuilder : Indicateurs & Outils Personnalisés

New Reply
Author
author-avatar
swapping @swapping Participant
Summary

This topic contains 33 replies,
has 6 voices, and was last updated by Nicolas
4 years, 4 months ago.

Topic Details
Forum: ProBuilder : Indicateurs & Outils Personnalisés
Language: French
Started: 05/25/2019
Status: Active
Attachments: 5 files
Logo Logo
Loading...