Outil retracement de Fibonacci pour le price action

Viewing 15 posts - 1 through 15 (of 34 total)
  • Author
    Posts
  • #99419 quote
    swapping
    Participant
    Master

    Ce programme est avant tout destiné aux investisseurs tradant essentiellement avec l’action des prix en utilisant le strict minimum pour une meilleure efficacité.
    Sans recours à des indicateurs superflux ces lignes de codes simples permettent:
    – La détection automatiquement des niveaux de Fibonacci avec orientation correcte du tracé
    – La visualisation du plus haut et bas de la session en cours ou d’une journée précédente sélectionnable sous forme de ligne continu ou d’un rectangle avec largeur ajustable partiellement et
    – Le niveau d’ouverture de la session active…

    Au chapitre des variables il est possible d’intervenir sur les propriétés permettant
    – “Grid” de sélectionner une “zone” particulière que vous désirez visualiser entre deux niveaux de Fibonacci ou laisser le programme s’en charger automatiquement (0)
    – “XOffset” de paramètrer manuellement la largeur du rectangle recouvrant cette zone choisie
    – “Alpha” de régler la transparence du texte à votre convenance
    – “SetBar” d’agir sur la largeur du rectangle recouvrant les lignes “plus haut et plus bas”
    – “NDay” de sélectionner la session active (0) ou les jours précédents (1 hier, 2 avant hier, ect…)
    – “HLine” Cocher visualisation lignes “haut, bas” sélection par “NDay” ou rectangle plus le niveau d’ouverture

    // Price Action Tools | Indicator
    // 25.05.2019 (Release 1.0)
    // Swapping @ www.forexswap.fr
    // Sharing ProRealTime knowledge
    
    DefParam DrawOnLastBarOnly = true
    
    // --- Property settings
    //Grid    = 0            // Select Area between Fibonacci levels (0 = automatic)
    //XOffset = 10           // Text XOffset
    //Alpha   = 12           // Text Transparency
    //SetBar  = 0            // Width adjustment rectangle
    //NDay    = 0            // Choice Day (0 = today, 1 = yesterday)
    //HLine   = 1            // Check (0 = Box, 1 = DrawHLine)
    // --- end
    
    // --- init
    XOffset = max(2,XOffset)
    alpha = max(alpha,0)     // Limited input "Alpha"
    alpha = min(alpha,255)   // (0 min, 255 max)
    NDay = max(NDay,0)       // Limited input "Day"
    NDay = min(NDay,31)      // (0 today, 31 end of month)
    // --- end
    
    if day <> day[1] then
    startbar = BarIndex
    endif
    
    HiDay  = dhigh(NDay)
    LowDay = dlow(NDay)
    
    if HLine = 1 then
    DrawHline(HiDay)  coloured(40,140,190,255) // Upper Top Line
    DrawHline(LowDay) coloured(40,140,190,255) // Lower Low Line
    DrawText("Open  ►                   ",startbar,dopen(0),SansSerif,Bold,11) coloured(40,140,190,alpha)
    DrawSegment(startbar,dopen(0),barindex,dopen(0)) coloured(40,140,190)
    else
    DrawRectangle(startbar,HiDay,BarIndex-SetBar,LowDay) coloured(40,140,200,10) // Rectangle
    endif
    
    if low > fib50 then                // Bullish sense
    fib100 = DHigh(0)               //100%
    DrawText("Top Day ",BarIndex-XOffset-3,fib100,SansSerif,Bold,10) coloured(20,140,0,alpha)
    DrawSegment(BarIndex[XOffset-2],fib100,BarIndex,fib100) coloured(0,0,0,alpha)
    fib76 = (fib100-fib0)*.764+fib0 //76.4%
    DrawText("76.4% ",BarIndex-XOffset,fib76,SansSerif,Standard,10) coloured(20,140,0,alpha)
    fib62 = (fib100-fib0)*.618+fib0 //61.8%
    DrawText("61.8% ",BarIndex-XOffset,fib62,SansSerif,Standard,10) coloured(20,140,0,alpha)
    fib50 = (fib100-fib0)/2+fib0    //50%
    DrawText("50.0% ",BarIndex-XOffset,fib50,SansSerif,Standard,10) coloured(20,140,0,alpha)
    fib38 = (fib100-fib0)*.382+fib0 //38.2%
    DrawText("38.2% ",BarIndex-XOffset,fib38,SansSerif,Standard,10) coloured(20,140,0,alpha)
    fib24 = (fib100-fib0)*.236+fib0 //23.6%
    DrawText("23.6% ",BarIndex-XOffset,fib24,SansSerif,Standard,10) coloured(20,140,0,alpha)
    fib0 = DLow(0)                  //0%
    DrawText("0% ",BarIndex-XOffset,fib0,SansSerif,Standard,10) coloured(20,140,0,alpha)
    DrawSegment(BarIndex[XOffset-2],fib0,BarIndex,fib0) coloured(0,0,0,alpha)
    endif
    
    if high < fib50 then               // Bearish sense
    fib100 = DHigh(0)               //0%
    DrawText("Low Day ",BarIndex-XOffset-3,fib0,SansSerif,Bold,10) coloured(190,10,10,alpha)
    DrawSegment(BarIndex[XOffset-2],fib0,BarIndex,fib0) coloured(0,0,0,alpha)
    fib76 = (fib100-fib0)*.764+fib0 //23.6%
    DrawText("23.6% ",BarIndex-XOffset,fib76,SansSerif,Standard,10) coloured(190,10,10,alpha)
    fib62 = (fib100-fib0)*.618+fib0 //38.2%
    DrawText("38.2% ",BarIndex-XOffset,fib62,SansSerif,Standard,10) coloured(190,10,10,alpha)
    fib50 = (fib100-fib0)*.5+fib0   //50%
    DrawText("50.0% ",BarIndex-XOffset,fib50,SansSerif,Standard,10) coloured(190,10,10,alpha)
    fib38 = (fib100-fib0)*.382+fib0 //61.8%
    DrawText("61.8% ",BarIndex-XOffset,fib38,SansSerif,Standard,10) coloured(190,10,10,alpha)
    fib24 = (fib100-fib0)*.236+fib0 //76.4%
    DrawText("76.4% ",BarIndex-XOffset,fib24,SansSerif,Standard,10) coloured(190,10,10,alpha)
    fib0 = DLow(0)                  //100%
    DrawText("0% ",BarIndex-XOffset,fib100,SansSerif,Standard,10) coloured(190,10,10,alpha)
    DrawSegment(BarIndex[XOffset-2],fib100,BarIndex,fib100) coloured(0,0,0,alpha)
    endif
    
    //-------------------------------------------------
    // Check Box Selected Manual Area [1 to 14]
    if grid = 1 and low > fib50 then   // area 0-23.6
    DrawRectangle(BarIndex-XOffset,fib0,BarIndex[0],fib24) coloured(0,0,0,0)
    elsif grid = 1 and low < fib50 then
    DrawRectangle(BarIndex-XOffset,fib0,BarIndex[0],fib24) coloured(0,0,0,0)
    endif
    if grid = 2 and low > fib50 then   // area 23.6-38.2
    DrawRectangle(BarIndex-XOffset,fib24,BarIndex[0],fib38) coloured(0,0,0,0)
    elsif grid = 2 and low < fib50 then
    DrawRectangle(BarIndex-XOffset,fib24,BarIndex[0],fib38) coloured(0,0,0,0)
    endif
    if grid = 3 and low > fib50 then   // area 38.2-50.0
    DrawRectangle(BarIndex-XOffset,fib38,BarIndex[0],fib50) coloured(0,0,0,0)
    elsif grid = 3 and low < fib50 then
    DrawRectangle(BarIndex-XOffset,fib38,BarIndex[0],fib50) coloured(0,0,0,0)
    endif
    if grid = 4 and low > fib50 then   // area 50.0-61.8
    DrawRectangle(BarIndex-XOffset,fib50,BarIndex[0],fib62) coloured(0,0,0,0)
    elsif grid = 4 and low < fib50 then
    DrawRectangle(BarIndex-XOffset,fib50,BarIndex[0],fib62) coloured(0,0,0,0)
    endif
    if grid = 5 and low > fib50 then   // area 61.8-76.4
    DrawRectangle(BarIndex-XOffset,fib62,BarIndex[0],fib76) coloured(0,0,0,0)
    elsif grid = 5 and low < fib50 then
    DrawRectangle(BarIndex-XOffset,fib62,BarIndex[0],fib76) coloured(0,0,0,0)
    endif
    if grid = 6 and low > fib50 then   // area 76.4-100
    DrawRectangle(BarIndex-XOffset,fib76,BarIndex[0],fib100) coloured(0,0,0,0)
    elsif grid = 6 and low < fib50 then
    DrawRectangle(BarIndex-XOffset,fib76,BarIndex[0],fib100) coloured(0,0,0,0)
    endif
    if grid = 7 and low > fib50 then   // area 100-61.8
    DrawRectangle(BarIndex-XOffset,fib100,BarIndex[0],fib62) coloured(0,0,0,0)
    elsif grid = 7 and low < fib50 then
    DrawRectangle(BarIndex-XOffset,fib100,BarIndex[0],fib62) coloured(0,0,0,0)
    endif
    if grid = 8 and low > fib50 then   // area 76.4-50.0
    DrawRectangle(BarIndex-XOffset,fib76,BarIndex[0],fib50) coloured(0,0,0,0)
    elsif grid = 8 and low < fib50 then
    DrawRectangle(BarIndex-XOffset,fib76,BarIndex[0],fib50) coloured(0,0,0,0)
    endif
    if grid = 9 and low > fib50 then   // area 61.8-38.2
    DrawRectangle(BarIndex-XOffset,fib62,BarIndex[0],fib38) coloured(0,0,0,0)
    elsif grid = 9 and low < fib50 then
    DrawRectangle(BarIndex-XOffset,fib62,BarIndex[0],fib38) coloured(0,0,0,0)
    endif
    if grid = 10 and low > fib50 then  // area 50.0-23.6
    DrawRectangle(BarIndex-XOffset,fib50,BarIndex[0],fib24) coloured(0,0,0,0)
    elsif grid = 10 and low < fib50 then
    DrawRectangle(BarIndex-XOffset,fib50,BarIndex[0],fib24) coloured(0,0,0,0)
    endif
    if grid = 11 and low > fib50 then  // area 38.26-0
    DrawRectangle(BarIndex-XOffset,fib38,BarIndex[0],fib0) coloured(0,0,0,0)
    elsif grid = 11 and low < fib50 then
    DrawRectangle(BarIndex-XOffset,fib38,BarIndex[0],fib0) coloured(0,0,0,0)
    endif
    if grid = 12 and low > fib50 then  // area 50.0-100
    DrawRectangle(BarIndex-XOffset,fib50,BarIndex[0],fib100) coloured(0,0,0,0)
    elsif grid = 12 and low < fib50 then
    DrawRectangle(BarIndex-XOffset,fib50,BarIndex[0],fib100) coloured(0,0,0,0)
    endif
    if grid = 13 and low > fib50 then  // area 50.0-0
    DrawRectangle(BarIndex-XOffset,fib0,BarIndex[0],fib50) coloured(0,0,0,0)
    elsif grid = 13 and low < fib50 then
    DrawRectangle(BarIndex-XOffset,fib0,BarIndex[0],fib50) coloured(0,0,0,0)
    endif
    if grid = 14 and low > fib50 then  // area 0-100
    DrawRectangle(BarIndex-XOffset,fib0,BarIndex[0],fib100) coloured(0,0,0,0)
    elsif grid = 14 and low < fib50 then
    DrawRectangle(BarIndex-XOffset,fib0,BarIndex[0],fib100) coloured(0,0,0,0)
    endif
    
    //-------------------------------------------------
    // Check Box Selected Automatic Area [0] bull/bear
    if grid = 0 and low > fib50 and close > fib0 and close < fib24 then   // area 0-23.6
    DrawRectangle(BarIndex-XOffset,fib0,BarIndex[0],fib24) coloured(0,0,0,0)
    elsif grid = 0 and high < fib50 and close > fib0 and close < fib24 then  // bear
    DrawRectangle(BarIndex-XOffset,fib24,BarIndex[0],fib0) coloured(0,0,0,0)
    endif
    if grid = 0 and low > fib50 and close > fib24 and close < fib38 then  // area 23.6-38.2
    DrawRectangle(BarIndex-XOffset,fib24,BarIndex[0],fib38) coloured(0,0,0,0)
    elsif grid = 0 and high < fib50 and close > fib24 and close < fib38 then // bear
    DrawRectangle(BarIndex-XOffset,fib24,BarIndex[0],fib38) coloured(0,0,0,0)
    endif
    if grid = 0 and low > fib50 and close > fib38 and close < fib50 then  // area 38.2-50.0
    DrawRectangle(BarIndex-XOffset,fib38,BarIndex[0],fib50) coloured(0,0,0,0)
    elsif grid = 0 and high < fib50 and close > fib38 and close < fib50 then // bear
    DrawRectangle(BarIndex-XOffset,fib38,BarIndex[0],fib50) coloured(0,0,0,0)
    endif
    if grid = 0 and low > fib50 and close > fib50 and close < fib62 then  // area 50.0-61.8
    DrawRectangle(BarIndex-XOffset,fib50,BarIndex[0],fib62) coloured(0,0,0,0)
    elsif grid = 0 and high < fib50 and close > fib50 and close < fib62 then // bear
    DrawRectangle(BarIndex-XOffset,fib50,BarIndex[0],fib62) coloured(0,0,0,0)
    endif
    if grid = 0 and low > fib50 and close > fib62 and close < fib76 then  // area 61.8-76.4
    DrawRectangle(BarIndex-XOffset,fib62,BarIndex[0],fib76) coloured(0,0,0,0)
    elsif grid = 0 and high < fib50 and close > fib76 and close < fib100 then // bear
    DrawRectangle(BarIndex-XOffset,fib76,BarIndex[0],fib100) coloured(0,0,0,0)
    endif
    if grid = 0 and low > fib50 and close > fib76 and close < fib100 then // area 76.4-100
    DrawRectangle(BarIndex-XOffset,fib76,BarIndex[0],fib100) coloured(0,0,0,0)
    elsif grid = 0 and high < fib50 and close > fib76 and close < fib100 then // bear
    DrawRectangle(BarIndex-XOffset,fib76,BarIndex[0],fib100) coloured(0,0,0,0)
    endif
    
    return
    
    stefou102, Nicolas, PLermite and fredd786 thanked this post
    Price-Action-Tools.itf DAX-15-minutes_auto.png DAX-15-minutes_auto.png
    #99467 quote
    Nicolas
    Keymaster
    Master

    Merci pour cette nouvelle excellente contribution 🙂

    fredd786 thanked this post
    #145796 quote
    pierre66
    Participant
    Senior

    Bonjour ,

    j’ai installé l’indicateur sur prorealtime mais les lignes fibo nes s’affichent pas ….

    c’est normal,

    Merci pour le retour

    Pierre

    #145803 quote
    Nicolas
    Keymaster
    Master

    Il faut appliquer l’indicateur sur le graphique du prix.

    Cependant, il n’y a en effet pas de lignes fibonacci visible, uniquement les textes marquants les niveaux et les lignes du 0 et 100%.

    #145894 quote
    pierre66
    Participant
    Senior

    J’ai appliqué sur le graphique des prix en changeant “alpha = max(alpha,0)     // Limited input “Alpha” par “alpha = max(alpha,255)     // Limited input “Alpha” et la je vois effectivement les chiffres mais pas les lignes tracées.

    Est il possible de les faire apparaître …?

    Merci pour le retour

    Pierre

    #145934 quote
    Nicolas
    Keymaster
    Master

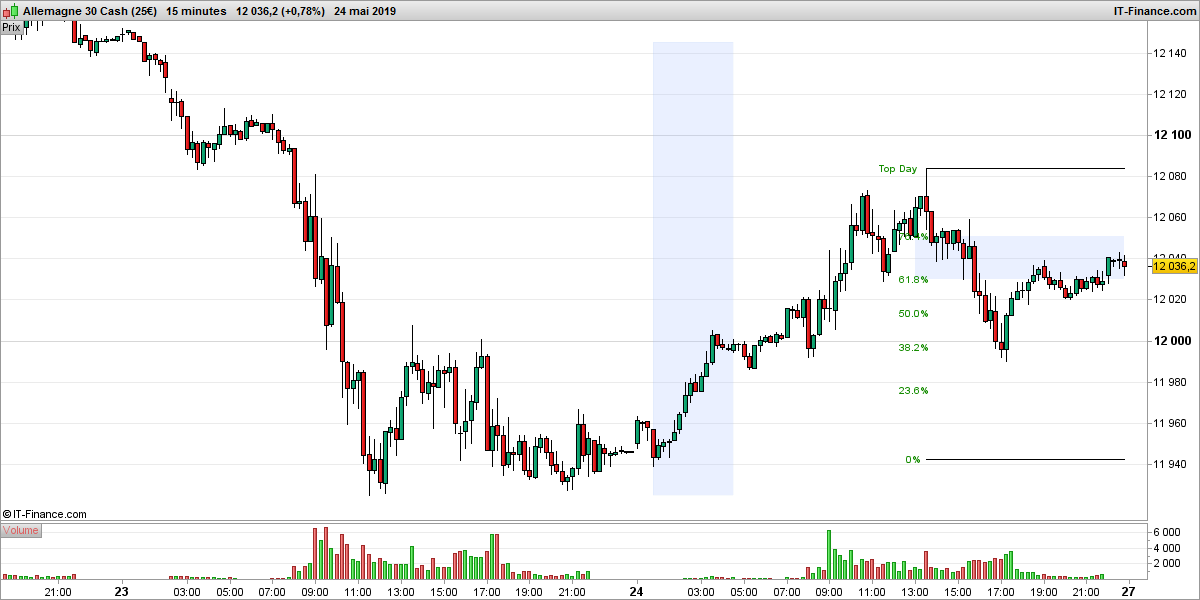
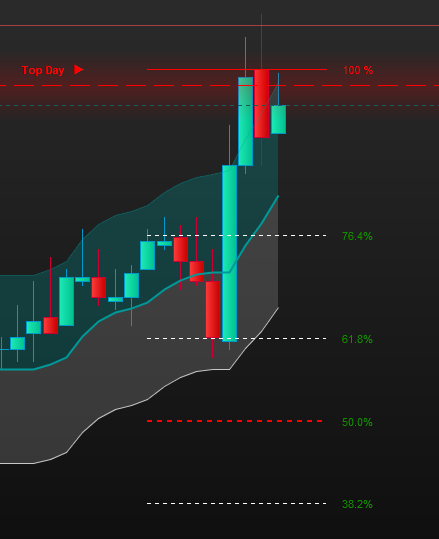
    Il faut les coder 🙂 La version du code ci-dessous intègre donc les lignes des retracements de Fibonacci :

    // Price Action Tools | Indicator
    // 25.05.2019 (Release 1.0)
    // Swapping @ www.forexswap.fr
    // Sharing ProRealTime knowledge
    
    DefParam DrawOnLastBarOnly = true
    
    // --- Property settings
    Grid    = 0            // Select Area between Fibonacci levels (0 = automatic)
    XOffset = 10           // Text XOffset
    Alpha   = 255           // Text Transparency
    SetBar  = 0            // Width adjustment rectangle
    NDay    = 0            // Choice Day (0 = today, 1 = yesterday)
    HLine   = 1            // Check (0 = Box, 1 = DrawHLine)
    // --- end
    
    // --- init
    XOffset = max(2,XOffset)
    alpha = max(alpha,0)     // Limited input "Alpha"
    alpha = min(alpha,255)   // (0 min, 255 max)
    NDay = max(NDay,0)       // Limited input "Day"
    NDay = min(NDay,31)      // (0 today, 31 end of month)
    // --- end
    
    if day <> day[1] then
    startbar = BarIndex
    endif
    
    HiDay  = dhigh(NDay)
    LowDay = dlow(NDay)
    
    if HLine = 1 then
    DrawHline(HiDay)  coloured(40,140,190,255) // Upper Top Line
    DrawHline(LowDay) coloured(40,140,190,255) // Lower Low Line
    DrawText("Open  ►                   ",startbar,dopen(0),SansSerif,Bold,11) coloured(40,140,190,alpha)
    DrawSegment(startbar,dopen(0),barindex,dopen(0)) coloured(40,140,190)
    else
    DrawRectangle(startbar,HiDay,BarIndex-SetBar,LowDay) coloured(40,140,200,10) // Rectangle
    endif
    
    if low > fib50 then                // Bullish sense
    fib100 = DHigh(0)               //100%
    DrawText("Top Day ",BarIndex-XOffset-3,fib100,SansSerif,Bold,10) coloured(20,140,0,alpha)
    DrawSegment(BarIndex[XOffset-2],fib100,BarIndex,fib100) coloured(0,0,0,alpha)
    fib76 = (fib100-fib0)*.764+fib0 //76.4%
    DrawText("76.4% ",BarIndex-XOffset,fib76,SansSerif,Standard,10) coloured(20,140,0,alpha)
    DrawSegment(BarIndex[XOffset-2],fib76,BarIndex,fib76) coloured(0,0,0,alpha)
    fib62 = (fib100-fib0)*.618+fib0 //61.8%
    DrawText("61.8% ",BarIndex-XOffset,fib62,SansSerif,Standard,10) coloured(20,140,0,alpha)
    DrawSegment(BarIndex[XOffset-2],fib62,BarIndex,fib62) coloured(0,0,0,alpha)
    fib50 = (fib100-fib0)/2+fib0    //50%
    DrawText("50.0% ",BarIndex-XOffset,fib50,SansSerif,Standard,10) coloured(20,140,0,alpha)
    DrawSegment(BarIndex[XOffset-2],fib50,BarIndex,fib50) coloured(0,0,0,alpha)
    fib38 = (fib100-fib0)*.382+fib0 //38.2%
    DrawText("38.2% ",BarIndex-XOffset,fib38,SansSerif,Standard,10) coloured(20,140,0,alpha)
    DrawSegment(BarIndex[XOffset-2],fib38,BarIndex,fib38) coloured(0,0,0,alpha)
    fib24 = (fib100-fib0)*.236+fib0 //23.6%
    DrawText("23.6% ",BarIndex-XOffset,fib24,SansSerif,Standard,10) coloured(20,140,0,alpha)
    DrawSegment(BarIndex[XOffset-2],fib24,BarIndex,fib24) coloured(0,0,0,alpha)
    fib0 = DLow(0)                  //0%
    DrawText("0% ",BarIndex-XOffset,fib0,SansSerif,Standard,10) coloured(20,140,0,alpha)
    DrawSegment(BarIndex[XOffset-2],fib0,BarIndex,fib0) coloured(0,0,0,alpha)
    endif
    
    if high < fib50 then               // Bearish sense
    fib100 = DHigh(0)               //0%
    DrawText("Low Day ",BarIndex-XOffset-3,fib0,SansSerif,Bold,10) coloured(190,10,10,alpha)
    DrawSegment(BarIndex[XOffset-2],fib0,BarIndex,fib0) coloured(0,0,0,alpha)
    fib76 = (fib100-fib0)*.764+fib0 //23.6%
    DrawText("23.6% ",BarIndex-XOffset,fib76,SansSerif,Standard,10) coloured(190,10,10,alpha)
    DrawSegment(BarIndex[XOffset-2],fib76,BarIndex,fib76) coloured(0,0,0,alpha)
    fib62 = (fib100-fib0)*.618+fib0 //38.2%
    DrawText("38.2% ",BarIndex-XOffset,fib62,SansSerif,Standard,10) coloured(190,10,10,alpha)
    DrawSegment(BarIndex[XOffset-2],fib62,BarIndex,fib62) coloured(0,0,0,alpha)
    fib50 = (fib100-fib0)*.5+fib0   //50%
    DrawText("50.0% ",BarIndex-XOffset,fib50,SansSerif,Standard,10) coloured(190,10,10,alpha)
    DrawSegment(BarIndex[XOffset-2],fib50,BarIndex,fib50) coloured(0,0,0,alpha)
    fib38 = (fib100-fib0)*.382+fib0 //61.8%
    DrawText("61.8% ",BarIndex-XOffset,fib38,SansSerif,Standard,10) coloured(190,10,10,alpha)
    DrawSegment(BarIndex[XOffset-2],fib38,BarIndex,fib38) coloured(0,0,0,alpha)
    fib24 = (fib100-fib0)*.236+fib0 //76.4%
    DrawText("76.4% ",BarIndex-XOffset,fib24,SansSerif,Standard,10) coloured(190,10,10,alpha)
    DrawSegment(BarIndex[XOffset-2],fib24,BarIndex,fib24) coloured(0,0,0,alpha)
    fib0 = DLow(0)                  //100%
    DrawText("0% ",BarIndex-XOffset,fib100,SansSerif,Standard,10) coloured(190,10,10,alpha)
    DrawSegment(BarIndex[XOffset-2],fib100,BarIndex,fib100) coloured(0,0,0,alpha)
    endif
    
    //-------------------------------------------------
    // Check Box Selected Manual Area [1 to 14]
    if grid = 1 and low > fib50 then   // area 0-23.6
    DrawRectangle(BarIndex-XOffset,fib0,BarIndex[0],fib24) coloured(0,0,0,0)
    elsif grid = 1 and low < fib50 then
    DrawRectangle(BarIndex-XOffset,fib0,BarIndex[0],fib24) coloured(0,0,0,0)
    endif
    if grid = 2 and low > fib50 then   // area 23.6-38.2
    DrawRectangle(BarIndex-XOffset,fib24,BarIndex[0],fib38) coloured(0,0,0,0)
    elsif grid = 2 and low < fib50 then
    DrawRectangle(BarIndex-XOffset,fib24,BarIndex[0],fib38) coloured(0,0,0,0)
    endif
    if grid = 3 and low > fib50 then   // area 38.2-50.0
    DrawRectangle(BarIndex-XOffset,fib38,BarIndex[0],fib50) coloured(0,0,0,0)
    elsif grid = 3 and low < fib50 then
    DrawRectangle(BarIndex-XOffset,fib38,BarIndex[0],fib50) coloured(0,0,0,0)
    endif
    if grid = 4 and low > fib50 then   // area 50.0-61.8
    DrawRectangle(BarIndex-XOffset,fib50,BarIndex[0],fib62) coloured(0,0,0,0)
    elsif grid = 4 and low < fib50 then
    DrawRectangle(BarIndex-XOffset,fib50,BarIndex[0],fib62) coloured(0,0,0,0)
    endif
    if grid = 5 and low > fib50 then   // area 61.8-76.4
    DrawRectangle(BarIndex-XOffset,fib62,BarIndex[0],fib76) coloured(0,0,0,0)
    elsif grid = 5 and low < fib50 then
    DrawRectangle(BarIndex-XOffset,fib62,BarIndex[0],fib76) coloured(0,0,0,0)
    endif
    if grid = 6 and low > fib50 then   // area 76.4-100
    DrawRectangle(BarIndex-XOffset,fib76,BarIndex[0],fib100) coloured(0,0,0,0)
    elsif grid = 6 and low < fib50 then
    DrawRectangle(BarIndex-XOffset,fib76,BarIndex[0],fib100) coloured(0,0,0,0)
    endif
    if grid = 7 and low > fib50 then   // area 100-61.8
    DrawRectangle(BarIndex-XOffset,fib100,BarIndex[0],fib62) coloured(0,0,0,0)
    elsif grid = 7 and low < fib50 then
    DrawRectangle(BarIndex-XOffset,fib100,BarIndex[0],fib62) coloured(0,0,0,0)
    endif
    if grid = 8 and low > fib50 then   // area 76.4-50.0
    DrawRectangle(BarIndex-XOffset,fib76,BarIndex[0],fib50) coloured(0,0,0,0)
    elsif grid = 8 and low < fib50 then
    DrawRectangle(BarIndex-XOffset,fib76,BarIndex[0],fib50) coloured(0,0,0,0)
    endif
    if grid = 9 and low > fib50 then   // area 61.8-38.2
    DrawRectangle(BarIndex-XOffset,fib62,BarIndex[0],fib38) coloured(0,0,0,0)
    elsif grid = 9 and low < fib50 then
    DrawRectangle(BarIndex-XOffset,fib62,BarIndex[0],fib38) coloured(0,0,0,0)
    endif
    if grid = 10 and low > fib50 then  // area 50.0-23.6
    DrawRectangle(BarIndex-XOffset,fib50,BarIndex[0],fib24) coloured(0,0,0,0)
    elsif grid = 10 and low < fib50 then
    DrawRectangle(BarIndex-XOffset,fib50,BarIndex[0],fib24) coloured(0,0,0,0)
    endif
    if grid = 11 and low > fib50 then  // area 38.26-0
    DrawRectangle(BarIndex-XOffset,fib38,BarIndex[0],fib0) coloured(0,0,0,0)
    elsif grid = 11 and low < fib50 then
    DrawRectangle(BarIndex-XOffset,fib38,BarIndex[0],fib0) coloured(0,0,0,0)
    endif
    if grid = 12 and low > fib50 then  // area 50.0-100
    DrawRectangle(BarIndex-XOffset,fib50,BarIndex[0],fib100) coloured(0,0,0,0)
    elsif grid = 12 and low < fib50 then
    DrawRectangle(BarIndex-XOffset,fib50,BarIndex[0],fib100) coloured(0,0,0,0)
    endif
    if grid = 13 and low > fib50 then  // area 50.0-0
    DrawRectangle(BarIndex-XOffset,fib0,BarIndex[0],fib50) coloured(0,0,0,0)
    elsif grid = 13 and low < fib50 then
    DrawRectangle(BarIndex-XOffset,fib0,BarIndex[0],fib50) coloured(0,0,0,0)
    endif
    if grid = 14 and low > fib50 then  // area 0-100
    DrawRectangle(BarIndex-XOffset,fib0,BarIndex[0],fib100) coloured(0,0,0,0)
    elsif grid = 14 and low < fib50 then
    DrawRectangle(BarIndex-XOffset,fib0,BarIndex[0],fib100) coloured(0,0,0,0)
    endif
    
    //-------------------------------------------------
    // Check Box Selected Automatic Area [0] bull/bear
    if grid = 0 and low > fib50 and close > fib0 and close < fib24 then   // area 0-23.6
    DrawRectangle(BarIndex-XOffset,fib0,BarIndex[0],fib24) coloured(0,0,0,0)
    elsif grid = 0 and high < fib50 and close > fib0 and close < fib24 then  // bear
    DrawRectangle(BarIndex-XOffset,fib24,BarIndex[0],fib0) coloured(0,0,0,0)
    endif
    if grid = 0 and low > fib50 and close > fib24 and close < fib38 then  // area 23.6-38.2
    DrawRectangle(BarIndex-XOffset,fib24,BarIndex[0],fib38) coloured(0,0,0,0)
    elsif grid = 0 and high < fib50 and close > fib24 and close < fib38 then // bear
    DrawRectangle(BarIndex-XOffset,fib24,BarIndex[0],fib38) coloured(0,0,0,0)
    endif
    if grid = 0 and low > fib50 and close > fib38 and close < fib50 then  // area 38.2-50.0
    DrawRectangle(BarIndex-XOffset,fib38,BarIndex[0],fib50) coloured(0,0,0,0)
    elsif grid = 0 and high < fib50 and close > fib38 and close < fib50 then // bear
    DrawRectangle(BarIndex-XOffset,fib38,BarIndex[0],fib50) coloured(0,0,0,0)
    endif
    if grid = 0 and low > fib50 and close > fib50 and close < fib62 then  // area 50.0-61.8
    DrawRectangle(BarIndex-XOffset,fib50,BarIndex[0],fib62) coloured(0,0,0,0)
    elsif grid = 0 and high < fib50 and close > fib50 and close < fib62 then // bear
    DrawRectangle(BarIndex-XOffset,fib50,BarIndex[0],fib62) coloured(0,0,0,0)
    endif
    if grid = 0 and low > fib50 and close > fib62 and close < fib76 then  // area 61.8-76.4
    DrawRectangle(BarIndex-XOffset,fib62,BarIndex[0],fib76) coloured(0,0,0,0)
    elsif grid = 0 and high < fib50 and close > fib76 and close < fib100 then // bear
    DrawRectangle(BarIndex-XOffset,fib76,BarIndex[0],fib100) coloured(0,0,0,0)
    endif
    if grid = 0 and low > fib50 and close > fib76 and close < fib100 then // area 76.4-100
    DrawRectangle(BarIndex-XOffset,fib76,BarIndex[0],fib100) coloured(0,0,0,0)
    elsif grid = 0 and high < fib50 and close > fib76 and close < fib100 then // bear
    DrawRectangle(BarIndex-XOffset,fib76,BarIndex[0],fib100) coloured(0,0,0,0)
    endif
    
    return
    #153457 quote
    Marie Chidais
    Participant
    New

    Bonjour,

    Je ne sais pas pourquoi ça marche pas chez moi. Pas moyen d’afficher quoique ce soit sur aucun des 2 prog.

    En tout cas riche idée.


    I like prorealcode.com . Buy

    #153458 quote
    Marie Chidais
    Participant
    New

    J’ai bien noté “by adding it on price instead. Use the wrench on the left upper side of your price chart.”

    prt 11, l”indicateur est tjr sous le prix, pas avec. Je n’ai pas trouver comment lui dire de le mettre avec.

    ça doit être ça.

    bye

    #153460 quote
    JC_Bywan
    Moderator
    Master

    Bonjour, la clé (wrench) n’est qu’en v10.3, elle n’y est plus en v11, à la place il faut cliquer directement sur “prix” dans le coin supérieur gauche de la fenêtre du prix pour faire apparaitre “ajouter un indicateur” qui sera avec le prix.

    #153465 quote
    Marie Chidais
    Participant
    New

    intégration réussi merci.

    tjrs rien malgré tout.

    prix = Close
    return prix as “prix” n’a pas fait apparaitre le mystérieux résultat.

    Jouer de l’alpha non plus.

    Ce n’est pas grave du tout.

    d’ailleurs, je zap

    bye

    #173295 quote
    Axel98
    Participant
    Average

    Bonjour,

    Merci pour ce superbe outil…

    Je ne sais pas pour vous, mais moi j’ai un problème d’actualisation des niveaux. Les lignes s’affichent bien quand j’installe l’indicateur, mais si il y a un nouveau plus haut par la suite, l’indicateur ne met pas à jour la ligne “Top day” et les autres qui en découlent.

    Je suis obligé de supprimer l’indicateur du graphique et de le réinstaller…

    Y-a-t’il quelque chose à faire pour arranger ça ?

    Merci d’avance

    #173364 quote
    Axel98
    Participant
    Average

    En fait si, la mise à jour se fait, mais le “top day” n’est pas exactement le plus haut du jour, la ligne est sur le haut du corps du chandelier, mais pas le haut de la mèche…

    Capture-decran-2021-07-09-181724.png Capture-decran-2021-07-09-181724.png
    #173408 quote
    Nicolas
    Keymaster
    Master

    En vue intraday ?

    #173427 quote
    Axel98
    Participant
    Average

    Et bien en l’occurence sur ma capture d’ecran c’est du 5 minutes

    #173441 quote
    Nicolas
    Keymaster
    Master

    Le paramètre NDay   est bien égal à  0 ? 

Viewing 15 posts - 1 through 15 (of 34 total)
  • You must be logged in to reply to this topic.

Outil retracement de Fibonacci pour le price action


ProBuilder : Indicateurs & Outils Personnalisés

New Reply
Author
author-avatar
swapping @swapping Participant
Summary

This topic contains 33 replies,
has 6 voices, and was last updated by Nicolas
4 years, 4 months ago.

Topic Details
Forum: ProBuilder : Indicateurs & Outils Personnalisés
Language: French
Started: 05/25/2019
Status: Active
Attachments: 5 files
Logo Logo
Loading...