I don’t think so, since it quite the same as an indicator, but I’ll have a try.
histogram bars are NOT displayed when ane arrow+ellispe is on the price! And I cannot guess why.
Because you are resetting X to zero at line 2 of the indicator’s code.
Sorry Nicolas, but it doesn’t work either.
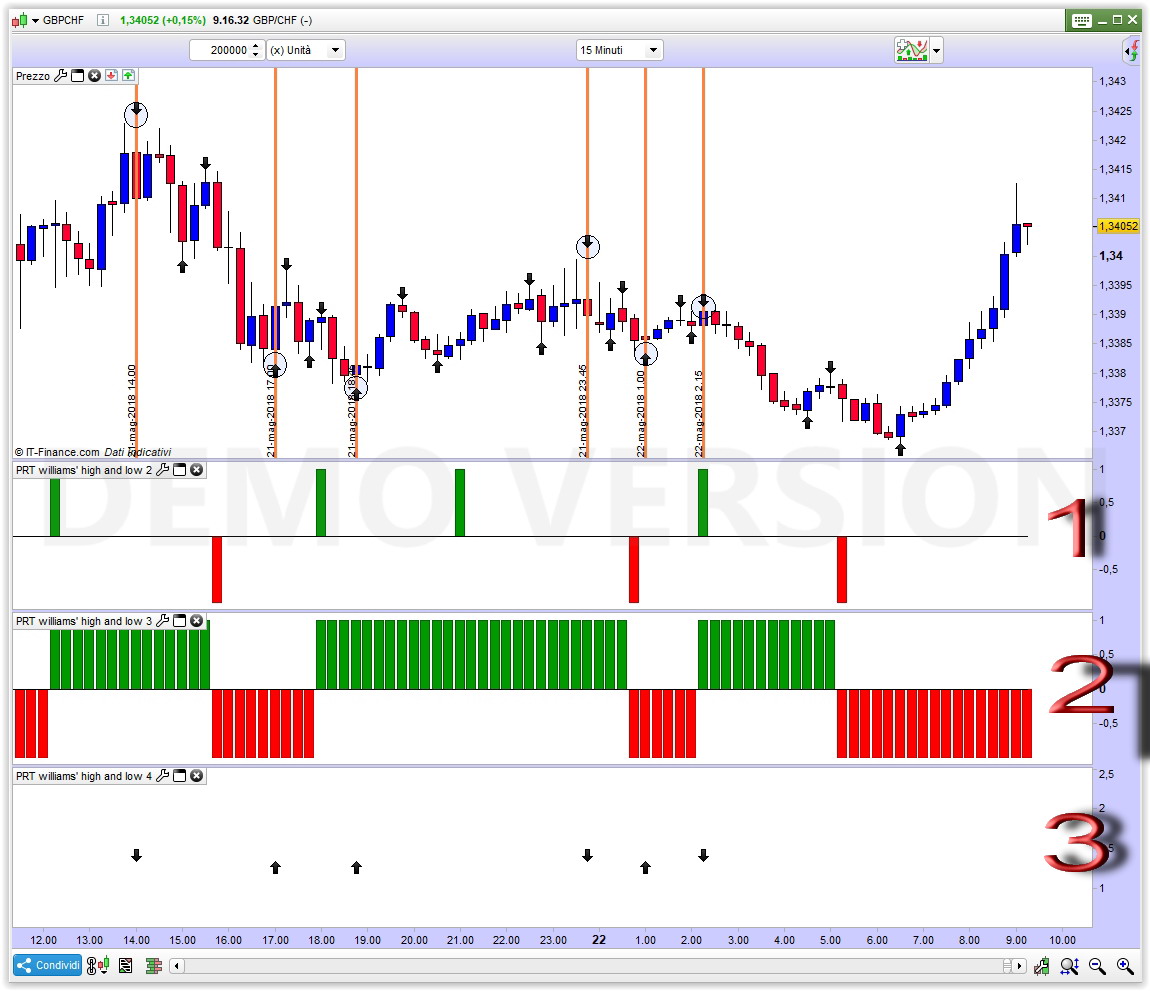
This is the original code I modified to display ONLY arrows that are circled. I only moved the DRAWARROWUP/DRAWARROWDOWN lines to the line following DRAWELLIPSE (and commented out this one), I also commented out the DRAWCANDLE line at the bottom, plus I had to comment out some variables used to drawellipses. This code is working as you can see from indicator box 3, since it displays ONLY those arrows that are circled on the price chart.
But, if instead of drawing an arrov a simply set x=1 when it’s an upward arrow and x=-1 when it’s the other way round, it does not work! With initial x=0 the result is box 1, without x=0 (or setting just ONCE x=0) the result is the histogram in box 2. In either cases it’s wrong.
I am wondering why replacing a DRAWARROWUP with x=1 produces odd results.
I also tried to set DEFPARAM CalculateOnLastBars = 1000 (from 300), but that’s not the problem I guess, since the original version on the price chart still has 300 as a bar limit.
DEFPARAM CalculateOnLastBars = 1000
//computation of the radius to draw ellipses
//radius=average[200](range)/4
//if golong=1 then
//golong=0
//endif
//formula to compute short term swing points
if (high>alto[1]) and not (high<high[1] and low>low[1]) then
alto=high
basso=low
markup=barindex
markhigh=high
endif
if (low<basso[1]) and not (high<high[1] and low>low[1]) then
alto=high
basso=low
markdown=barindex
marklow=low
endif

if alto<alto[1] and trend=1 then
trend=0
//drawarrowdown(markup,markhigh)
mediummarkup=shortmarkup
shortmarkup=markup
longmarkhigh=mediummarkhigh
mediummarkhigh=shortmarkhigh
shortmarkhigh=markhigh
//intermediate high swing points
if longmarkhigh<mediummarkhigh and mediummarkhigh>shortmarkhigh then
//DRAWELLIPSE(mediummarkup-1, mediummarkhigh-radius, mediummarkup+1, mediummarkhigh+radius)
drawarrowdown(mediummarkup,markhigh)
endif
endif

if basso>basso[1] and trend=0 then
trend=1
//drawarrowup(markdown,marklow)
mediummarkdown=shortmarkdown
shortmarkdown=markdown
longmarklow=mediummarklow
mediummarklow=shortmarklow
shortmarklow=marklow
//intermediate low swing points
if longmarklow>mediummarklow and mediummarklow<shortmarklow then
//DRAWELLIPSE(mediummarkdown-1, mediummarklow-radius, mediummarkdown+1, mediummarklow+radius)
drawarrowup(mediummarkdown,marklow)
endif
endif


//drawcandle(open,high,low,close)
return
Because arrows are plotted in the past? While histogram are plotted starting from the current bar.. I don’t understand your issue because you stated this behavior in one of your previous post of the thread?
Yes I did, but when you talked about removing X=0 I thought that was likely not to be the problem.
Now, it’s clear.
Thank you Nicolas for your efforts and time spent helping the community!
 Ste
SteParticipant
Master
emh.. I haven’t understood.. can you pls tell me the correct code and how to see histogram?
It is not possible to use it as an histogram or as a screener.
It can only be used as an indicator displaying an arrow.
SteParticipant
Master
ah ok..another question, but I don’t understand if could be used for a strategy..I saw Nicolas strategy with martingale..but i wasn’t able to try without… to see if it works. (my link up) thx
It can be used in a strategy (as it can display histograms and scan markets) but keeping in mind that arrows are displayed in the past, so when you get a signal from the code the actual candle is “old”, but I don’t know Nicolas’code and Martingale strategies as well.
Sorry, I can’t be of help about this.