PRC QMP Filter to provide trading signals
Forums › ProRealTime English forum › ProOrder support › PRC QMP Filter to provide trading signals
- This topic has 27 replies, 4 voices, and was last updated 3 years ago by
robertogozzi.
-
-
05/03/2022 at 10:55 AM #192589
There you go:
12345678910111213141516171819202122232425262728293031323334353637383940414243444546474849505152535455565758596061626364656667686970717273747576777879808182838485868788//PRC_QMP Filter | indicator//29.09.2016//Nicolas @ www.prorealcode.com//Sharing ProRealTime knowledgeDEFPARAM DrawOnLastBarOnly = true//--- parametersshort = 12long = 26signal = 9RSIPeriod = 8SF = 1QQE = 3//---// --- MACD ZeroLagEMAshort1 = exponentialaverage[short](close)EMAshort2 = exponentialaverage[short](EMAshort1)DifferenceShort = EMAshort1 - EMAshort2ZeroLagShort = EMAshort1 + DifferenceShortEMAlong1 = exponentialaverage[long](close)EMAlong2 = exponentialaverage[long](EMAlong1)DifferenceLong = EMAlong1 - EMAlong2ZeroLagLong = EMAlong1 + DifferenceLongZeroLagMACD = ZeroLagShort - ZeroLagLongsignal1=ExponentialAverage[signal](ZEROLAGMACD)signal2=ExponentialAverage[signal](signal1)DIFFERENCE2=signal1-signal2SignalMACD=signal1+DIFFERENCE2// --- QQEWildersPeriod = RSIPeriod * 2 - 1if barindex>WildersPeriod thenMyRsi = rsi[RSIPeriod](close)RsiMa = exponentialaverage[SF](MyRsi)AtrRsi = abs(RsiMa[1] - RsiMa)MaAtrRsi = exponentialaverage[WildersPeriod](AtrRsi)dar = exponentialaverage[WildersPeriod](MaAtrRsi) * QQEtrr=TrLevelSlow[1]dv = trrif RsiMA[0]<trr thentrr = RsiMA[0] + darif(RsiMA[1]<dv) thenif(trr>dv) thentrr=dvendifendifelsif RsiMA[0]>trr thentrr = RsiMA[0] - darif(RsiMA[1]>dv) thenif(trr<dv) thentrr=dvendifendifendifTrLevelSlow=trrendif// --- signalsatr=averagetruerange[100]if zerolagMACD>=signalMACD and RsiMA>=trr and lasttrend<>1 thenlasttrend=1r1=0g1=255b1=0lowbar = barindexlowprice = low-atr/2ilow = low-atr/2elsif zerolagMACD<signalMACD and RsiMA<trr and lasttrend<>-1 thenlasttrend=-1r0=255g0=0b0=0highbar = barindexhighprice = high+atr/2ihigh = high+atr/2endifdrawtext("●",lowbar,lowprice,Dialog,Bold,12) coloured(r1,g1,b1)drawtext("●",highbar,highprice,Dialog,Bold,12) coloured(r0,g0,b0)return ilow,ihigh05/03/2022 at 11:25 AM #19259005/20/2022 at 2:42 AM #19347705/20/2022 at 12:15 PM #19350205/26/2022 at 1:28 PM #19388005/26/2022 at 4:16 PM #193890Sorry, I’ve been quite busy lately.
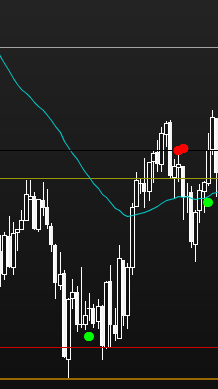
There you go (this will plot the last 3 signals in total):
123456789101112131415161718192021222324252627282930313233343536373839404142434445464748495051525354555657585960616263646566676869707172737475767778798081828384858687888990919293949596979899100101102103104105106107108109110111112113114115116117118119120121122123//PRC_QMP Filter | indicator//29.09.2016//Nicolas @ www.prorealcode.com//Sharing ProRealTime knowledgeDEFPARAM DrawOnLastBarOnly = true//ONCE MaxSignals = 3IF BarIndex = 0 THENFOR i = 1 TO MaxSignals$Signal[i] = 0$myBar[i] = 0$Price[i] = 0NEXTENDIF////--- parametersshort = 12long = 26signal = 9RSIPeriod = 8SF = 1QQE = 3//---// --- MACD ZeroLagEMAshort1 = exponentialaverage[short](close)EMAshort2 = exponentialaverage[short](EMAshort1)DifferenceShort = EMAshort1 - EMAshort2ZeroLagShort = EMAshort1 + DifferenceShortEMAlong1 = exponentialaverage[long](close)EMAlong2 = exponentialaverage[long](EMAlong1)DifferenceLong = EMAlong1 - EMAlong2ZeroLagLong = EMAlong1 + DifferenceLongZeroLagMACD = ZeroLagShort - ZeroLagLongsignal1=ExponentialAverage[signal](ZEROLAGMACD)signal2=ExponentialAverage[signal](signal1)DIFFERENCE2=signal1-signal2SignalMACD=signal1+DIFFERENCE2// --- QQEWildersPeriod = RSIPeriod * 2 - 1if barindex>WildersPeriod thenMyRsi = rsi[RSIPeriod](close)RsiMa = exponentialaverage[SF](MyRsi)AtrRsi = abs(RsiMa[1] - RsiMa)MaAtrRsi = exponentialaverage[WildersPeriod](AtrRsi)dar = exponentialaverage[WildersPeriod](MaAtrRsi) * QQEtrr=TrLevelSlow[1]dv = trrif RsiMA[0]<trr thentrr = RsiMA[0] + darif(RsiMA[1]<dv) thenif(trr>dv) thentrr=dvendifendifelsif RsiMA[0]>trr thentrr = RsiMA[0] - darif(RsiMA[1]>dv) thenif(trr<dv) thentrr=dvendifendifendifTrLevelSlow=trrendif// --- signalsatr=averagetruerange[100]if zerolagMACD>=signalMACD and RsiMA>=trr and lasttrend<>1 thenFOR i = MaxSignals DOWNTO 2j = i - 1$Signal[i] = $Signal[j]$myBar[i] = $myBar[j]$Price[i] = $Price[j]NEXTlasttrend=1r1=0g1=255b1=0lowbar = barindexlowprice = low-atr/2ilow = low-atr/2$Signal[1] = -1$myBar[1] = lowbar$Price[1] = lowpriceelsif zerolagMACD<signalMACD and RsiMA<trr and lasttrend<>-1 thenFOR i = MaxSignals DOWNTO 2j = i - 1$Signal[i] = $Signal[j]$myBar[i] = $myBar[j]$Price[i] = $Price[j]NEXTlasttrend=-1r0=255g0=0b0=0highbar = barindexhighprice = high+atr/2ihigh = high+atr/2$Signal[1] = 1$myBar[1] = highbar$Price[1] = highpriceendifFOR i = 1 TO MaxSignalsx = $myBar[i]y = $Price[i]IF $Signal[i] = - 1 THENdrawtext("●",x,y,Dialog,Bold,12) coloured(r1,g1,b1)ELSIF $Signal[i] = 1 THENdrawtext("●",x,y,Dialog,Bold,12) coloured(r0,g0,b0)ENDIFNEXTreturn ilow,ihigh
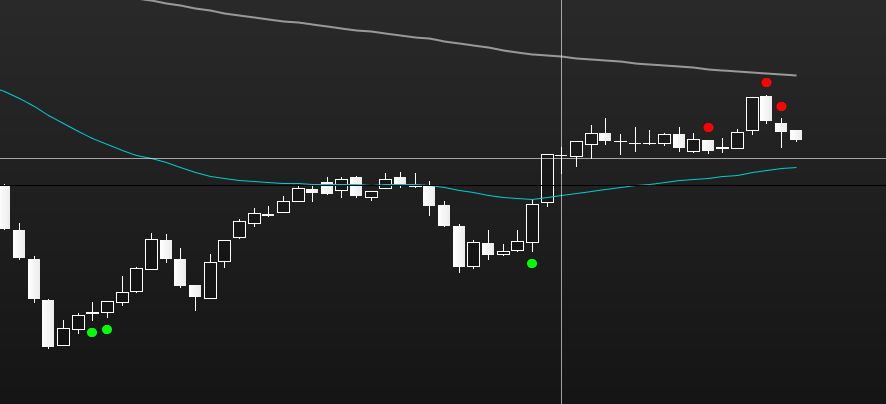
There you go (this will plot the last 6 signal, 3 each type)):
123456789101112131415161718192021222324252627282930313233343536373839404142434445464748495051525354555657585960616263646566676869707172737475767778798081828384858687888990919293949596979899100101102103104105106107108109110111112113114115116117118119120121122123124125126127128129130131//PRC_QMP Filter | indicator//29.09.2016//Nicolas @ www.prorealcode.com//Sharing ProRealTime knowledgeDEFPARAM DrawOnLastBarOnly = true//ONCE MaxSignals = 3IF BarIndex = 0 THENFOR i = 1 TO MaxSignals$Lsignal[i] = 0$LmyBar[i] = 0$Lprice[i] = 0//$Ssignal[i] = 0$SmyBar[i] = 0$Sprice[i] = 0NEXTENDIF////--- parametersshort = 12long = 26signal = 9RSIPeriod = 8SF = 1QQE = 3//---// --- MACD ZeroLagEMAshort1 = exponentialaverage[short](close)EMAshort2 = exponentialaverage[short](EMAshort1)DifferenceShort = EMAshort1 - EMAshort2ZeroLagShort = EMAshort1 + DifferenceShortEMAlong1 = exponentialaverage[long](close)EMAlong2 = exponentialaverage[long](EMAlong1)DifferenceLong = EMAlong1 - EMAlong2ZeroLagLong = EMAlong1 + DifferenceLongZeroLagMACD = ZeroLagShort - ZeroLagLongsignal1=ExponentialAverage[signal](ZEROLAGMACD)signal2=ExponentialAverage[signal](signal1)DIFFERENCE2=signal1-signal2SignalMACD=signal1+DIFFERENCE2// --- QQEWildersPeriod = RSIPeriod * 2 - 1if barindex>WildersPeriod thenMyRsi = rsi[RSIPeriod](close)RsiMa = exponentialaverage[SF](MyRsi)AtrRsi = abs(RsiMa[1] - RsiMa)MaAtrRsi = exponentialaverage[WildersPeriod](AtrRsi)dar = exponentialaverage[WildersPeriod](MaAtrRsi) * QQEtrr=TrLevelSlow[1]dv = trrif RsiMA[0]<trr thentrr = RsiMA[0] + darif(RsiMA[1]<dv) thenif(trr>dv) thentrr=dvendifendifelsif RsiMA[0]>trr thentrr = RsiMA[0] - darif(RsiMA[1]>dv) thenif(trr<dv) thentrr=dvendifendifendifTrLevelSlow=trrendif// --- signalsatr=averagetruerange[100]if zerolagMACD>=signalMACD and RsiMA>=trr and lasttrend<>1 thenFOR i = MaxSignals DOWNTO 2j = i - 1$Ssignal[i] = $Ssignal[j]$SmyBar[i] = $SmyBar[j]$Sprice[i] = $Sprice[j]NEXTlasttrend=1r1=0g1=255b1=0lowbar = barindexlowprice = low-atr/2ilow = low-atr/2$Ssignal[1] = -1$SmyBar[1] = lowbar$Sprice[1] = lowpriceelsif zerolagMACD<signalMACD and RsiMA<trr and lasttrend<>-1 thenFOR i = MaxSignals DOWNTO 2j = i - 1$Lsignal[i] = $Lsignal[j]$LmyBar[i] = $LmyBar[j]$Lprice[i] = $Lprice[j]NEXTlasttrend=-1r0=255g0=0b0=0highbar = barindexhighprice = high+atr/2ihigh = high+atr/2$Lsignal[1] = 1$LmyBar[1] = highbar$Lprice[1] = highpriceendifFOR i = 1 TO MaxSignalsx = $SmyBar[i]y = $Sprice[i]IF $Ssignal[i] = - 1 THENdrawtext("●",x,y,Dialog,Bold,12) coloured(r1,g1,b1)ENDIF//x = $LmyBar[i]y = $Lprice[i]IF $Lsignal[i] = 1 THENdrawtext("●",x,y,Dialog,Bold,12) coloured(r0,g0,b0)ENDIFNEXTreturn ilow,ihighYou can increase or decrease MaxSignals to best suit your needs.
1 user thanked author for this post.
05/27/2022 at 7:50 PM #19401605/28/2022 at 8:55 AM #194030Market are currently closed, so I cannot test it, but I think it’s due the continuous live refresh of the chart.
I’ll check on Monday and I will post the updated code.
05/30/2022 at 10:58 AM #194174This updated version is working finely:
Last 3 signals123456789101112131415161718192021222324252627282930313233343536373839404142434445464748495051525354555657585960616263646566676869707172737475767778798081828384858687888990919293949596979899100101102103104105106107108109110111112113114115116117118119120121122123124125126127128129//PRC_QMP Filter | indicator//29.09.2016//Nicolas @ www.prorealcode.com//Sharing ProRealTime knowledgeDEFPARAM DrawOnLastBarOnly = true//ONCE MaxSignals = 3IF BarIndex = 0 THENFOR i = 1 TO MaxSignals$Signal[i] = 0$myBar[i] = 0$Price[i] = 0NEXTENDIF////--- parametersshort = 12long = 26signal = 9RSIPeriod = 8SF = 1QQE = 3//---// --- MACD ZeroLagEMAshort1 = exponentialaverage[short](close)EMAshort2 = exponentialaverage[short](EMAshort1)DifferenceShort = EMAshort1 - EMAshort2ZeroLagShort = EMAshort1 + DifferenceShortEMAlong1 = exponentialaverage[long](close)EMAlong2 = exponentialaverage[long](EMAlong1)DifferenceLong = EMAlong1 - EMAlong2ZeroLagLong = EMAlong1 + DifferenceLongZeroLagMACD = ZeroLagShort - ZeroLagLongsignal1=ExponentialAverage[signal](ZEROLAGMACD)signal2=ExponentialAverage[signal](signal1)DIFFERENCE2=signal1-signal2SignalMACD=signal1+DIFFERENCE2// --- QQEWildersPeriod = RSIPeriod * 2 - 1if barindex>WildersPeriod thenMyRsi = rsi[RSIPeriod](close)RsiMa = exponentialaverage[SF](MyRsi)AtrRsi = abs(RsiMa[1] - RsiMa)MaAtrRsi = exponentialaverage[WildersPeriod](AtrRsi)dar = exponentialaverage[WildersPeriod](MaAtrRsi) * QQEtrr=TrLevelSlow[1]dv = trrif RsiMA[0]<trr thentrr = RsiMA[0] + darif(RsiMA[1]<dv) thenif(trr>dv) thentrr=dvendifendifelsif RsiMA[0]>trr thentrr = RsiMA[0] - darif(RsiMA[1]>dv) thenif(trr<dv) thentrr=dvendifendifendifTrLevelSlow=trrendif// --- signalsatr=averagetruerange[100]IF OpenTime <> OpenTime[1] THENif zerolagMACD>=signalMACD and RsiMA>=trr and lasttrend<>1 thenlasttrend=1r1=0g1=255b1=0lowbar = barindexlowprice = low-atr/2ilow = low-atr/2IF $myBar[1] <> barindex THENFOR i = MaxSignals DOWNTO 2j = i - 1$Signal[i] = $Signal[j]$myBar[i] = $myBar[j]$Price[i] = $Price[j]NEXT$myBar[1] = lowbar$Price[1] = lowprice$Signal[1] = -1endifelsif zerolagMACD<signalMACD and RsiMA<trr and lasttrend<>-1 thenlasttrend=-1r0=255g0=0b0=0highbar = barindexhighprice = high+atr/2ihigh = high+atr/2IF $myBar[1] <> barindex THENFOR i = MaxSignals DOWNTO 2j = i - 1$Signal[i] = $Signal[j]$myBar[i] = $myBar[j]$Price[i] = $Price[j]NEXT$Signal[1] = 1$myBar[1] = highbar$Price[1] = highpriceendifendifENDIFFOR i = 1 TO MaxSignalsx = $myBar[i]y = $Price[i]IF $Signal[i] = - 1 THENdrawtext("●",x,y,Dialog,Bold,12) coloured(r1,g1,b1)ELSIF $Signal[i] = 1 THENdrawtext("●",x,y,Dialog,Bold,12) coloured(r0,g0,b0)ENDIFNEXTreturn ilow,ihigh6 Signals (3 + 3)123456789101112131415161718192021222324252627282930313233343536373839404142434445464748495051525354555657585960616263646566676869707172737475767778798081828384858687888990919293949596979899100101102103104105106107108109110111112113114115116117118119120121122123124125126127128129130131132133134135//PRC_QMP Filter | indicator//29.09.2016//Nicolas @ www.prorealcode.com//Sharing ProRealTime knowledgeDEFPARAM DrawOnLastBarOnly = true//ONCE MaxSignals = 3IF BarIndex = 0 THENFOR i = 1 TO MaxSignals$Lsignal[i] = 0$LmyBar[i] = 0$Lprice[i] = 0//$Ssignal[i] = 0$SmyBar[i] = 0$Sprice[i] = 0NEXTENDIF////--- parametersshort = 12long = 26signal = 9RSIPeriod = 8SF = 1QQE = 3//---// --- MACD ZeroLagEMAshort1 = exponentialaverage[short](close)EMAshort2 = exponentialaverage[short](EMAshort1)DifferenceShort = EMAshort1 - EMAshort2ZeroLagShort = EMAshort1 + DifferenceShortEMAlong1 = exponentialaverage[long](close)EMAlong2 = exponentialaverage[long](EMAlong1)DifferenceLong = EMAlong1 - EMAlong2ZeroLagLong = EMAlong1 + DifferenceLongZeroLagMACD = ZeroLagShort - ZeroLagLongsignal1=ExponentialAverage[signal](ZEROLAGMACD)signal2=ExponentialAverage[signal](signal1)DIFFERENCE2=signal1-signal2SignalMACD=signal1+DIFFERENCE2// --- QQEWildersPeriod = RSIPeriod * 2 - 1if barindex>WildersPeriod thenMyRsi = rsi[RSIPeriod](close)RsiMa = exponentialaverage[SF](MyRsi)AtrRsi = abs(RsiMa[1] - RsiMa)MaAtrRsi = exponentialaverage[WildersPeriod](AtrRsi)dar = exponentialaverage[WildersPeriod](MaAtrRsi) * QQEtrr=TrLevelSlow[1]dv = trrif RsiMA[0]<trr thentrr = RsiMA[0] + darif(RsiMA[1]<dv) thenif(trr>dv) thentrr=dvendifendifelsif RsiMA[0]>trr thentrr = RsiMA[0] - darif(RsiMA[1]>dv) thenif(trr<dv) thentrr=dvendifendifendifTrLevelSlow=trrendif// --- signalsatr=averagetruerange[100]if zerolagMACD>=signalMACD and RsiMA>=trr and lasttrend<>1 thenlasttrend=1r1=0g1=255b1=0lowbar = barindexlowprice = low-atr/2ilow = low-atr/2IF $SmyBar[1] <> lowbar THENFOR i = MaxSignals DOWNTO 2j = i - 1$Ssignal[i] = $Ssignal[j]$SmyBar[i] = $SmyBar[j]$Sprice[i] = $Sprice[j]NEXTENDIF$Ssignal[1] = -1$SmyBar[1] = lowbar$Sprice[1] = lowpriceelsif zerolagMACD<signalMACD and RsiMA<trr and lasttrend<>-1 thenlasttrend=-1r0=255g0=0b0=0highbar = barindexhighprice = high+atr/2ihigh = high+atr/2IF $LmyBar[1] <> highbar THENFOR i = MaxSignals DOWNTO 2j = i - 1$Lsignal[i] = $Lsignal[j]$LmyBar[i] = $LmyBar[j]$Lprice[i] = $Lprice[j]NEXTendif$Lsignal[1] = 1$LmyBar[1] = highbar$Lprice[1] = highpriceendifFOR i = 1 TO MaxSignalsx = $SmyBar[i]y = $Sprice[i]IF $Ssignal[i] = - 1 THENdrawtext("●",x,y,Dialog,Bold,12) coloured(r1,g1,b1)ENDIF//x = $LmyBar[i]y = $Lprice[i]IF $Lsignal[i] = 1 THENdrawtext("●",x,y,Dialog,Bold,12) coloured(r0,g0,b0)ENDIFNEXTreturn ilow,ihigh1 user thanked author for this post.
06/01/2022 at 7:51 AM #19437506/01/2022 at 8:56 AM #194384Enlarge your chart, they shouldn’t be on the same place.
06/08/2022 at 1:52 PM #19490706/08/2022 at 3:45 PM #194913It’s can be more than one identical dot.
Check the original one if it has those dots plotted the same way.
Of course we can make it work as you want. If you don’t like consecutive identical signals, I can make it.
1 user thanked author for this post.
-
AuthorPosts
Find exclusive trading pro-tools on