Bonjour,
Je me permets de relancer le sujet.
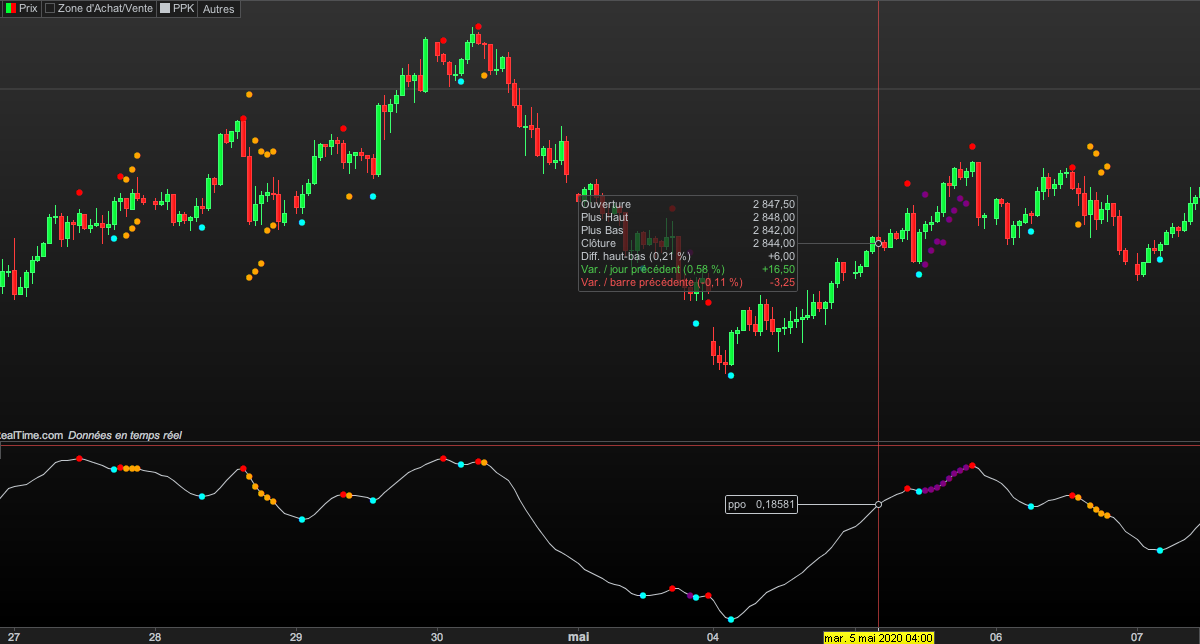
La version beta de PPK avait une fâcheuse tendance à repeindre.
Une nouvelle version est sortie et apparemment elle ne repeint plus.
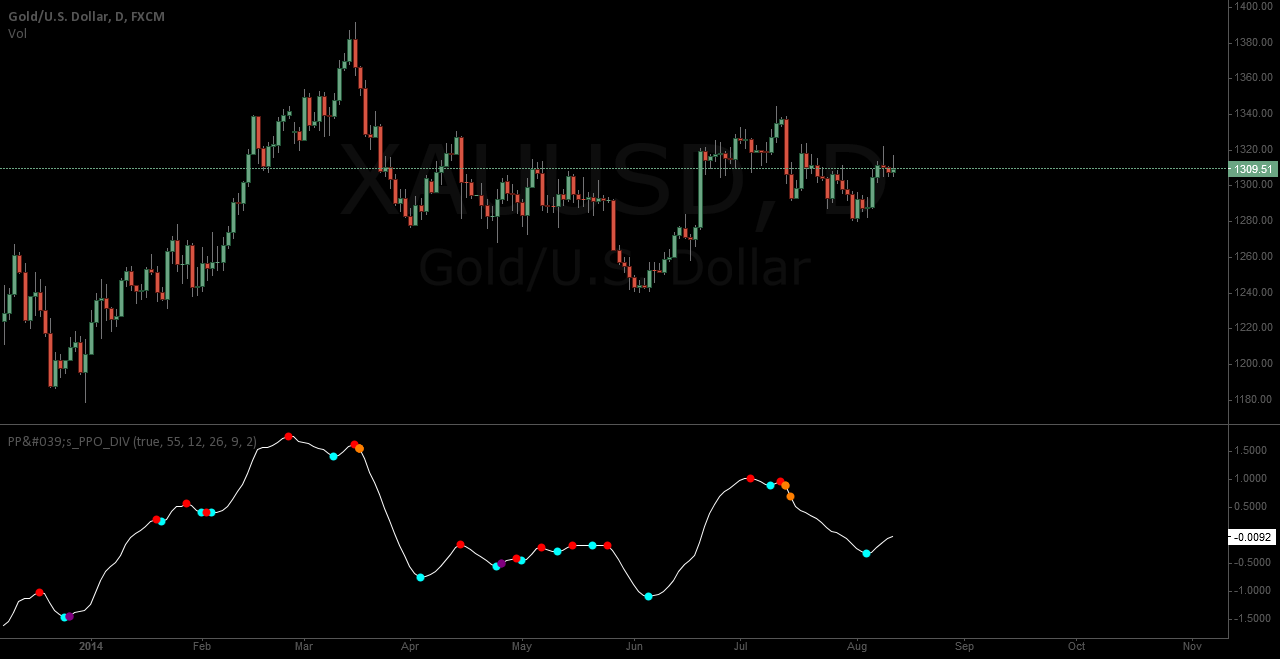
Quelqu’un pourrait-il SVP convertir la version V3 de tradingview ?
Merci d’avance
Following changes have been made:
– fixed repainting with migration to pinescript version 3
– Added more smoothing options for all averages and the signal
– color is red and green in default
//@version=3
study(title = “Pekipek’s PPO Divergence – EnhancedBy@PuppyTherapy”, shorttitle = “PP’s_PPO_DIV ByPuppyTherapy”)

long_term_div = input(true, title=”Use long term Divergences?”)
div_lookback_period = input(55, minval=1, title=”Lookback Period”)

sp1 = input(“—-“, title=”———–FAST———-“, options=[“—-“])
maType = input(“EMA”, title=”MA”, options=[“SMA”, “EMA”, “DEMA”, “TEMA”, “WMA”, “VWMA”, “SMMA”, “Hull”, “LSMA”, “ALMA”, “KAMA”, “MAMA”, “T3”, “RMA”], type=string)
maSource = input(defval = open, title = “Source”, type = source)
fastLength = input(defval = 12, title = “Period”, minval = 1)
lsmaOffset = input(defval = 1, title = “Least Squares (LSMA) Only – Offset Value”, minval = 0)
almaOffset = input(defval = 0.85, title = “Arnaud Legoux (ALMA) Only – Offset Value”, minval = 0, step = 0.01)
almaSigma = input(defval = 6, title = “Arnaud Legoux (ALMA) Only – Sigma Value”, minval = 0)
sp2 = input(“—-“, title=”———–SLOW———-“, options=[“—-“])
maUseRes2 = input(defval = false, title = “Use Different Resolution?”)
maReso2 = input(defval = “60”, title = “Set Resolution”, type = resolution)
maType2 = input(“EMA”, title=”MA”, options=[“SMA”, “EMA”, “DEMA”, “TEMA”, “WMA”, “VWMA”, “SMMA”, “Hull”, “LSMA”, “ALMA”, “KAMA”, “MAMA”, “T3”, “RMA”], type=string)
maSource2 = input(defval = open, title = “Source”, type = source)
slowLength = input(defval = 26, title = “Period”, minval = 1)
lsmaOffset2 = input(defval = 1, title = “Least Squares (LSMA) Only – Offset Value”, minval = 0)
almaOffset2 = input(defval = 0.85, title = “Arnaud Legoux (ALMA) Only – Offset Value”, minval = 0, step = 0.01)
almaSigma2 = input(defval = 6, title = “Arnaud Legoux (ALMA) Only – Sigma Value”, minval = 0)
sp3 = input(“—-“, title=”———–D———-“, options=[“—-“])
maTypeS = input(“SMA”, title=”MA”, options=[“SMA”, “EMA”, “DEMA”, “TEMA”, “WMA”, “VWMA”, “SMMA”, “Hull”, “LSMA”, “ALMA”, “KAMA”, “MAMA”, “T3”, “RMA”], type=string)
lsmaOffset3 = input(defval = 1, title = “Least Squares (LSMA) Only – Offset Value”, minval = 0)
almaOffset3 = input(defval = 0.85, title = “Arnaud Legoux (ALMA) Only – Offset Value”, minval = 0, step = 0.01)
almaSigma3 = input(defval = 6, title = “Arnaud Legoux (ALMA) Only – Sigma Value”, minval = 0)
smoother = input(2,minval=1,title = “Smoother”)

///——FUNCTIONS
//Function from @JayRogers thank you man awesome work
kama(src, len)=>
xvnoise = abs(src – src[1])
nfastend = 0.666
nslowend = 0.0645
nsignal = abs(src – src[len])
nnoise = sum(xvnoise, len)
nefratio = iff(nnoise != 0, nsignal / nnoise, 0)
nsmooth = pow(nefratio * (nfastend – nslowend) + nslowend, 2)
nAMA = 0.0
nAMA := nz(nAMA[1]) + nsmooth * (src – nz(nAMA[1]))

mama(src, len)=>
fl=0.5
sl=0.05
pi = 3.1415926
sp = (4*src + 3*src[1] + 2*src[2] + src[3]) / 10.0
p = 0.0
i2 = 0.0
q2 = 0.0
dt = (.0962*sp + .5769*nz(sp[2]) – .5769*nz(sp[4])- .0962*nz(sp[6]))*(.075*nz(p[1]) + .54)
q1 = (.0962*dt + .5769*nz(dt[2]) – .5769*nz(dt[4])- .0962*nz(dt[6]))*(.075*nz(p[1]) + .54)
i1 = nz(dt[3])
jI = (.0962*i1 + .5769*nz(i1[2]) – .5769*nz(i1[4])- .0962*nz(i1[6]))*(.075*nz(p[1]) + .54)
jq = (.0962*q1 + .5769*nz(q1[2]) – .5769*nz(q1[4])- .0962*nz(q1[6]))*(.075*nz(p[1]) + .54)
i2_ = i1 – jq
q2_ = q1 + jI
i2 := .2*i2_ + .8*nz(i2[1])
q2 := .2*q2_ + .8*nz(q2[1])
re_ = i2*nz(i2[1]) + q2*nz(q2[1])
im_ = i2*nz(q2[1]) – q2*nz(i2[1])
re = 0.0
im = 0.0
re := .2*re_ + .8*nz(re[1])
im := .2*im_ + .8*nz(im[1])
p1 = iff(im!=0 and re!=0, 2*pi/atan(im/re), nz(p[1]))
p2 = iff(p1 > 1.5*nz(p1[1]), 1.5*nz(p1[1]), iff(p1 < 0.67*nz(p1[1]), 0.67*nz(p1[1]), p1))
p3 = iff(p2<6, 6, iff (p2 > 50, 50, p2))
p := .2*p3 + .8*nz(p3[1])
spp = 0.0
spp := .33*p + .67*nz(spp[1])
phase = 180/pi * atan(q1 / i1)
dphase_ = nz(phase[1]) – phase
dphase = iff(dphase_< 1, 1, dphase_)
alpha_ = fl / dphase
alpha = iff(alpha_ < sl, sl, iff(alpha_ > fl, fl, alpha_))
mama = 0.0
mama := alpha*src + (1 – alpha)*nz(mama[1])

t3(src, len)=>
xe1_1 = ema(src, len)
xe2_1 = ema(xe1_1, len)
xe3_1 = ema(xe2_1, len)
xe4_1 = ema(xe3_1, len)
xe5_1 = ema(xe4_1, len)
xe6_1 = ema(xe5_1, len)
b_1 = 0.7
c1_1 = -b_1*b_1*b_1
c2_1 = 3*b_1*b_1+3*b_1*b_1*b_1
c3_1 = -6*b_1*b_1-3*b_1-3*b_1*b_1*b_1
c4_1 = 1+3*b_1+b_1*b_1*b_1+3*b_1*b_1
nT3Average_1 = c1_1 * xe6_1 + c2_1 * xe5_1 + c3_1 * xe4_1 + c4_1 * xe3_1

variant(type, src, len, lsmaOffset, almaOffset, almaSigma) =>
v1 = sma(src, len) // Simple
v2 = ema(src, len) // Exponential
v3 = 2 * v2 – ema(v2, len) // Double Exponential
v4 = 3 * (v2 – ema(v2, len)) + ema(ema(v2, len), len) // Triple Exponential
v5 = wma(src, len) // Weighted
v6 = vwma(src, len) // Volume Weighted
v7 = na(v5[1]) ? sma(src, len) : (v5[1] * (len – 1) + src) / len // Smoothed
v8 = wma(2 * wma(src, len / 2) – wma(src, len), round(sqrt(len))) // Hull
v9 = linreg(src, len, lsmaOffset) // Least Squares
v10 = alma(src, len, almaOffset, almaSigma) // Arnaud Legoux
v11 = kama(src, len) // KAMA
v12 = mama(src, len) // MAMA
v13 = t3(src, len) // T3
v14 = rma(src, len) // T3
type==”EMA”?v2 : type==”DEMA”?v3 : type==”TEMA”?v4 : type==”WMA”?v5 : type==”VWMA”?v6 : type==”SMMA”?v7 : type==”Hull”?v8 : type==”LSMA”?v9 : type==”ALMA”?v10 : type==”KAMA”?v11 : type==”MAMA”?v12 : type==”T3″?v13 : type==”RMA”?v14 : v1

///——FUNCTIONS

//fastMA = ema(src, fastLength)
fastMA = variant(maType, maSource, fastLength, lsmaOffset, almaOffset, almaSigma)
//slowMA = ema(src, slowLength)
slowMA = variant(maType2, maSource2, slowLength, lsmaOffset2, almaOffset2, almaSigma2)
macd = fastMA – slowMA
macd2=(macd/slowMA)*100
//d = sma(macd2, smoother) // smoothing PPO
d= variant(maTypeS, macd2, smoother, lsmaOffset3, almaOffset3, almaSigma3)

bullishPrice = low

priceMins = bullishPrice > bullishPrice[1] and bullishPrice[1] < bullishPrice[2] or
low[1] == low[2] and low[1] < low and low[1] < low[3] or
low[1] == low[2] and low[1] == low[3] and low[1] < low and low[1] < low[4] or
low[1] == low[2] and low[1] == low[3] and low[1] and low[1] == low[4] and low[1] < low and low[1] < low[5] // this line identifies bottoms and plateaus in the price
oscMins= d > d[1] and d[1] < d[2] // this line identifies bottoms in the PPO

BottomPointsInPPO = oscMins

bearishPrice = high
priceMax = bearishPrice < bearishPrice[1] and bearishPrice[1] > bearishPrice[2] or
high[1] == high[2] and high[1] > high and high[1] > high[3] or
high[1] == high[2] and high[1] == high[3] and high[1] > high and high[1] > high[4] or
high[1] == high[2] and high[1] == high[3] and high[1] and high[1] == high[4] and high[1] > high and high[1] > high[5] // this line identifies tops in the price
oscMax = d < d[1] and d[1] > d[2] // this line identifies tops in the PPO

TopPointsInPPO = oscMax

currenttrough4=valuewhen (oscMins, d[1], 0) // identifies the value of PPO at the most recent BOTTOM in the PPO
lasttrough4=valuewhen (oscMins, d[1], 1) // NOT USED identifies the value of PPO at the second most recent BOTTOM in the PPO
currenttrough5=valuewhen (oscMax, d[1], 0) // identifies the value of PPO at the most recent TOP in the PPO
lasttrough5=valuewhen (oscMax, d[1], 1) // NOT USED identifies the value of PPO at the second most recent TOP in the PPO

currenttrough6=valuewhen (priceMins, low[1], 0) // this line identifies the low (price) at the most recent bottom in the Price
lasttrough6=valuewhen (priceMins, low[1], 1) // NOT USED this line identifies the low (price) at the second most recent bottom in the Price
currenttrough7=valuewhen (priceMax, high[1], 0) // this line identifies the high (price) at the most recent top in the Price
lasttrough7=valuewhen (priceMax, high[1], 1) // NOT USED this line identifies the high (price) at the second most recent top in the Price

delayedlow = priceMins and barssince(oscMins) < 3 ? low[1] : na
delayedhigh = priceMax and barssince(oscMax) < 3 ? high[1] : na

// only take tops/bottoms in price when tops/bottoms are less than 5 bars away
filter = barssince(priceMins) < 5 ? lowest(currenttrough6, 4) : na
filter2 = barssince(priceMax) < 5 ? highest(currenttrough7, 4) : na

//delayedbottom/top when oscillator bottom/top is earlier than price bottom/top
y11 = valuewhen(oscMins, delayedlow, 0)
y12 = valuewhen(oscMax, delayedhigh, 0)

// only take tops/bottoms in price when tops/bottoms are less than 5 bars away, since 2nd most recent top/bottom in osc
y2=valuewhen(oscMax, filter2, 1) // identifies the highest high in the tops of price with 5 bar lookback period SINCE the SECOND most recent top in PPO
y6=valuewhen(oscMins, filter, 1) // identifies the lowest low in the bottoms of price with 5 bar lookback period SINCE the SECOND most recent bottom in PPO

long_term_bull_filt = valuewhen(priceMins, lowest(div_lookback_period), 1)
long_term_bear_filt = valuewhen(priceMax, highest(div_lookback_period), 1)

y3=valuewhen(oscMax, currenttrough5, 0) // identifies the value of PPO in the most recent top of PPO
y4=valuewhen(oscMax, currenttrough5, 1) // identifies the value of PPO in the second most recent top of PPO

y7=valuewhen(oscMins, currenttrough4, 0) // identifies the value of PPO in the most recent bottom of PPO
y8=valuewhen(oscMins, currenttrough4, 1) // identifies the value of PPO in the SECOND most recent bottom of PPO

y9=valuewhen(oscMins, currenttrough6, 0)
y10=valuewhen(oscMax, currenttrough7, 0)

bulldiv= BottomPointsInPPO ? d[1] : na // plots dots at bottoms in the PPO
beardiv= TopPointsInPPO ? d[1]: na // plots dots at tops in the PPO

i = currenttrough5 < highest(d, div_lookback_period) // long term bearish oscilator divergence
i2 = y10 > long_term_bear_filt // long term bearish top divergence
i3 = delayedhigh > long_term_bear_filt // long term bearish delayedhigh divergence

i4 = currenttrough4 > lowest(d, div_lookback_period) // long term bullish osc divergence
i5 = y9 < long_term_bull_filt // long term bullish bottom div
i6 = delayedlow < long_term_bull_filt // long term bullish delayedbottom div

plot(d, color=white)
plot(bulldiv, title = “Tops”, color=green, style=circles, linewidth=4)//, offset= -1)
plot(beardiv, title = “Bottoms”, color=red, style=circles, linewidth=4)//, offset= -1)

plot(y10>y2 and oscMax and y3 < y4 ? d :na, title = “Bearish Divergence2”, color=orange, style= circles, linewidth=4)
plot(y9<y6 and oscMins and y7 > y8 ? d :na, title = “Bullish Divergence2”, color=purple, style=circles, linewidth=4)
plot(delayedlow<y6 and y7 > y8 ? d :na, title = “Bullish Divergence2”, color=purple, style=circles, linewidth=4)
plot(delayedhigh>y2 and y3 < y4 ? d :na, title = “Bearish Divergence2”, color=orange, style= circles, linewidth=4)

plot(long_term_div and oscMax and i and i2 ? d :na, title = “Bearish Divergence2”, color=orange, style= circles, linewidth=4)
plot(long_term_div and oscMins and i4 and i5 ? d : na, title = “Bullish Divergence2”, color=purple, style=circles, linewidth=4)
plot(long_term_div and i and i3 ? d :na, title = “Bearish Divergence2”, color=orange, style= circles, linewidth=4)
plot(long_term_div and i4 and i6 ? d : na, title = “Bullish Divergence2”, color=purple, style=circles, linewidth=4)