Expert Services

No recent search

PPK Tradingview
-
AuthorPosts
-
Bonjour,
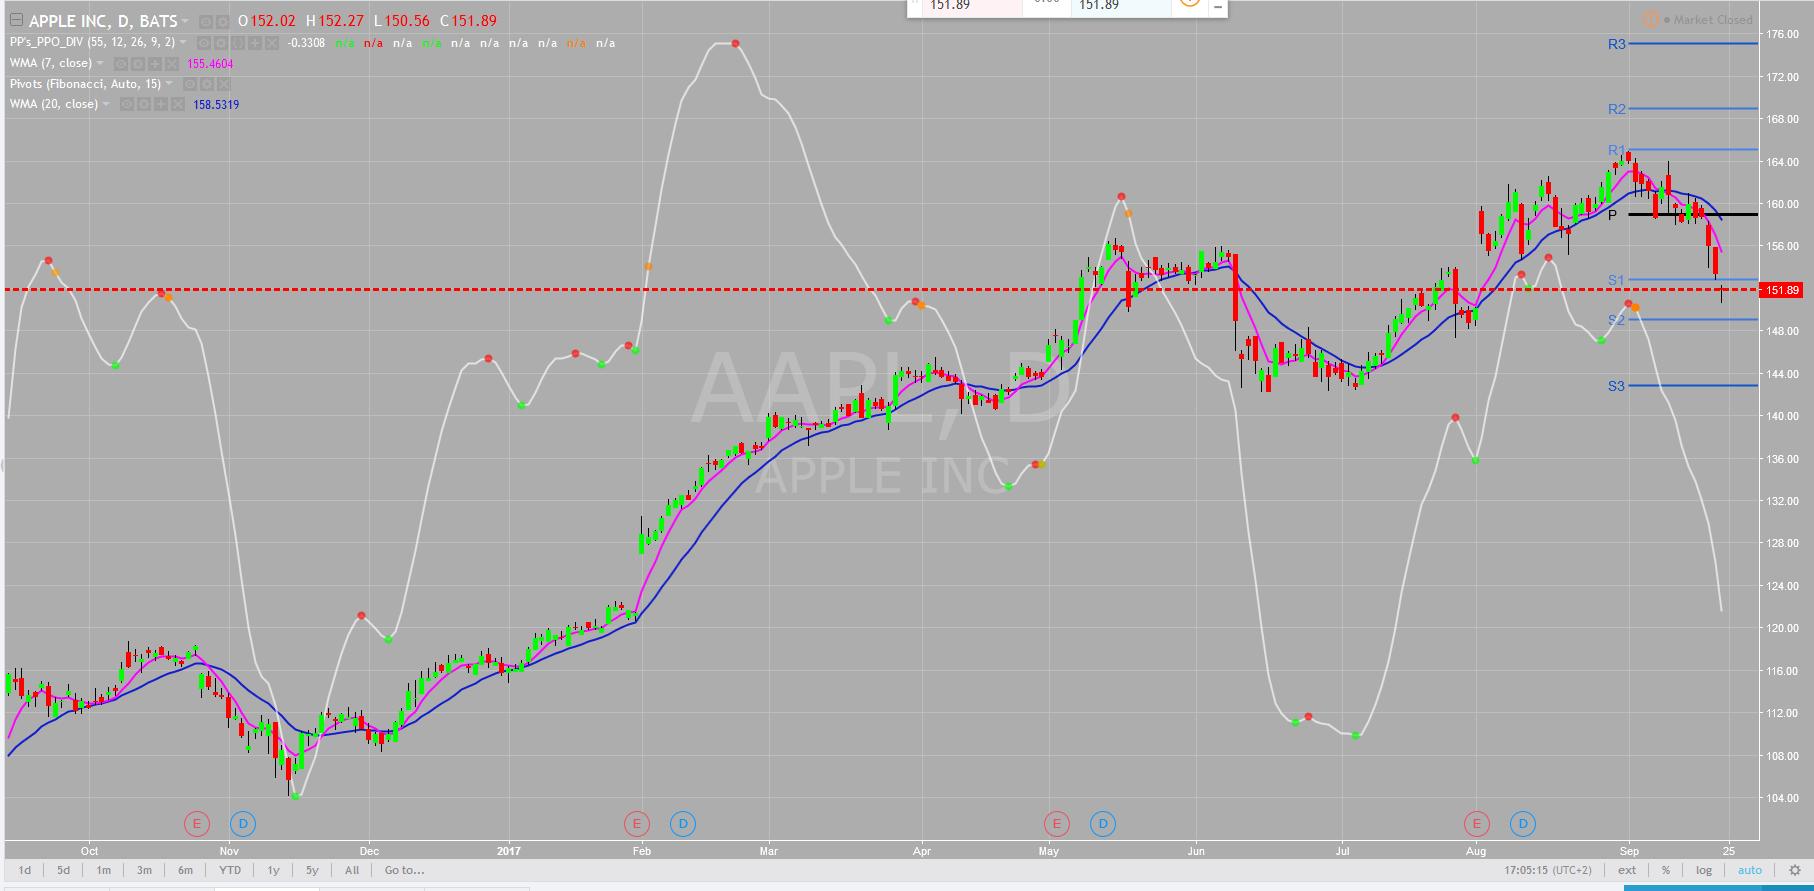
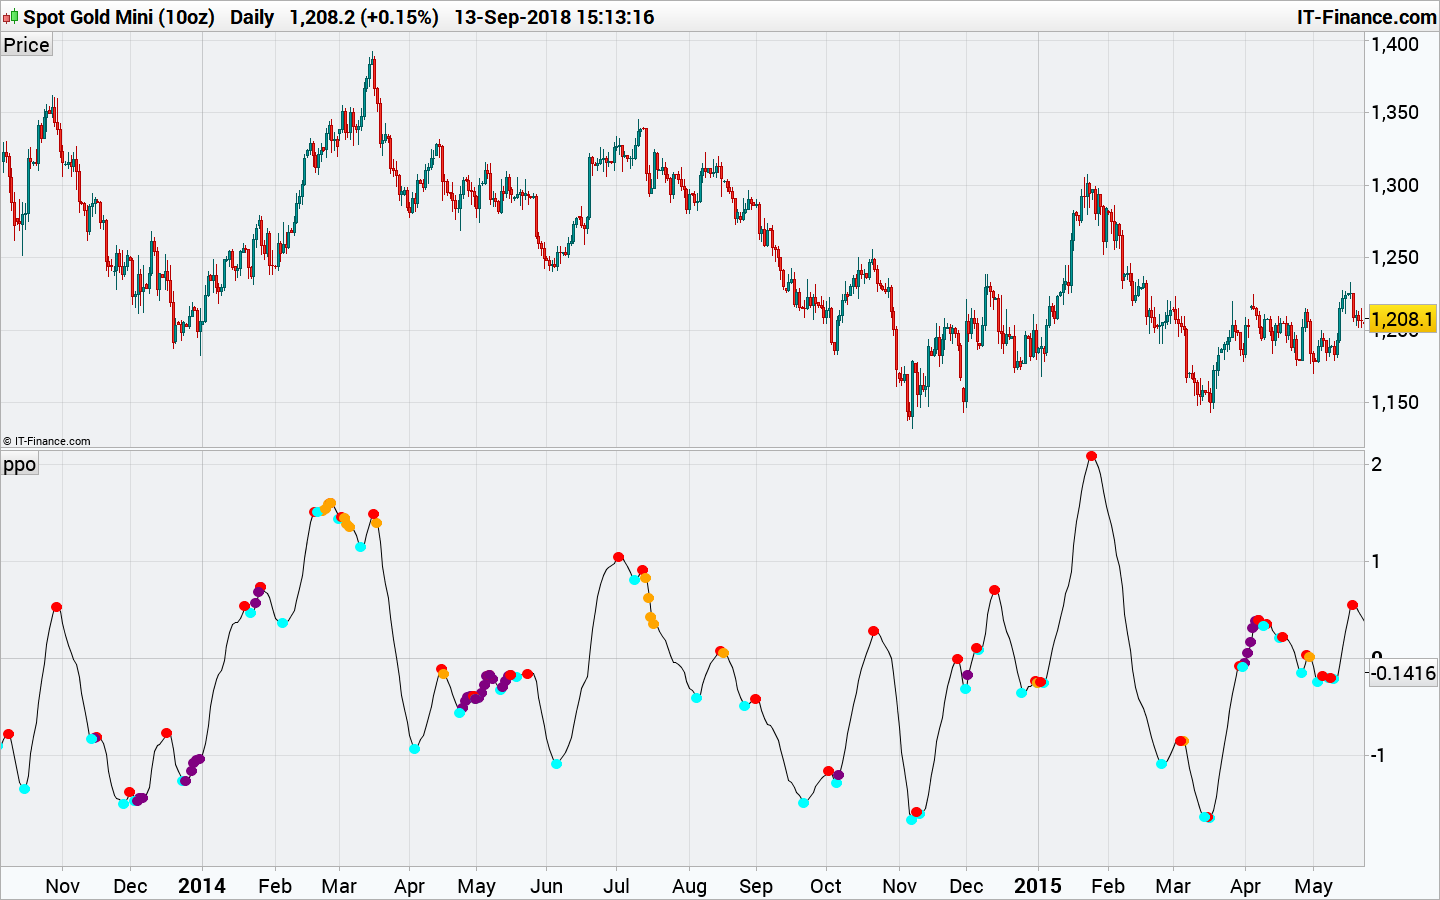
Une bonne âme pour traduire ce code relevé sur Tradingview :
// PPK Tradingview study(title = "Pekipek's PPO Divergence BETA", shorttitle = "PP's_PPO_DIV") source = close long_term_div = input(true, title="Use long term Divergences?") div_lookback_period = input(55, minval=1, title="Lookback Period") fastLength = input(12, minval=1), slowLength=input(26,minval=1) signalLength=input(9,minval=1) smoother = input(2,minval=1) fastMA = ema(source, fastLength) slowMA = ema(source, slowLength) macd = fastMA - slowMA macd2=(macd/slowMA)*100 d = sma(macd2, smoother) // smoothing PPO bullishPrice = low priceMins = bullishPrice > bullishPrice[1] and bullishPrice[1] < bullishPrice[2] or low[1] == low[2] and low[1] < low and low[1] < low[3] or low[1] == low[2] and low[1] == low[3] and low[1] < low and low[1] < low[4] or low[1] == low[2] and low[1] == low[3] and low[1] and low[1] == low[4] and low[1] < low and low[1] < low[5] // this line identifies bottoms and plateaus in the price oscMins= d > d[1] and d[1] < d[2] // this line identifies bottoms in the PPO BottomPointsInPPO = oscMins bearishPrice = high priceMax = bearishPrice < bearishPrice[1] and bearishPrice[1] > bearishPrice[2] or high[1] == high[2] and high[1] > high and high[1] > high[3] or high[1] == high[2] and high[1] == high[3] and high[1] > high and high[1] > high[4] or high[1] == high[2] and high[1] == high[3] and high[1] and high[1] == high[4] and high[1] > high and high[1] > high[5] // this line identifies tops in the price oscMax = d < d[1] and d[1] > d[2] // this line identifies tops in the PPO TopPointsInPPO = oscMax currenttrough4=valuewhen (oscMins, d[1], 0) // identifies the value of PPO at the most recent BOTTOM in the PPO lasttrough4=valuewhen (oscMins, d[1], 1) // NOT USED identifies the value of PPO at the second most recent BOTTOM in the PPO currenttrough5=valuewhen (oscMax, d[1], 0) // identifies the value of PPO at the most recent TOP in the PPO lasttrough5=valuewhen (oscMax, d[1], 1) // NOT USED identifies the value of PPO at the second most recent TOP in the PPO currenttrough6=valuewhen (priceMins, low[1], 0) // this line identifies the low (price) at the most recent bottom in the Price lasttrough6=valuewhen (priceMins, low[1], 1) // NOT USED this line identifies the low (price) at the second most recent bottom in the Price currenttrough7=valuewhen (priceMax, high[1], 0) // this line identifies the high (price) at the most recent top in the Price lasttrough7=valuewhen (priceMax, high[1], 1) // NOT USED this line identifies the high (price) at the second most recent top in the Price delayedlow = priceMins and barssince(oscMins) < 3 ? low[1] : na delayedhigh = priceMax and barssince(oscMax) < 3 ? high[1] : na // only take tops/bottoms in price when tops/bottoms are less than 5 bars away filter = barssince(priceMins) < 5 ? lowest(currenttrough6, 4) : na filter2 = barssince(priceMax) < 5 ? highest(currenttrough7, 4) : na //delayedbottom/top when oscillator bottom/top is earlier than price bottom/top y11 = valuewhen(oscMins, delayedlow, 0) y12 = valuewhen(oscMax, delayedhigh, 0) // only take tops/bottoms in price when tops/bottoms are less than 5 bars away, since 2nd most recent top/bottom in osc y2=valuewhen(oscMax, filter2, 1) // identifies the highest high in the tops of price with 5 bar lookback period SINCE the SECOND most recent top in PPO y6=valuewhen(oscMins, filter, 1) // identifies the lowest low in the bottoms of price with 5 bar lookback period SINCE the SECOND most recent bottom in PPO long_term_bull_filt = valuewhen(priceMins, lowest(div_lookback_period), 1) long_term_bear_filt = valuewhen(priceMax, highest(div_lookback_period), 1) y3=valuewhen(oscMax, currenttrough5, 0) // identifies the value of PPO in the most recent top of PPO y4=valuewhen(oscMax, currenttrough5, 1) // identifies the value of PPO in the second most recent top of PPO y7=valuewhen(oscMins, currenttrough4, 0) // identifies the value of PPO in the most recent bottom of PPO y8=valuewhen(oscMins, currenttrough4, 1) // identifies the value of PPO in the SECOND most recent bottom of PPO y9=valuewhen(oscMins, currenttrough6, 0) y10=valuewhen(oscMax, currenttrough7, 0) bulldiv= BottomPointsInPPO ? d[1] : na // plots dots at bottoms in the PPO beardiv= TopPointsInPPO ? d[1]: na // plots dots at tops in the PPO i = currenttrough5 < highest(d, div_lookback_period) // long term bearish oscilator divergence i2 = y10 > long_term_bear_filt // long term bearish top divergence i3 = delayedhigh > long_term_bear_filt // long term bearish delayedhigh divergence i4 = currenttrough4 > lowest(d, div_lookback_period) // long term bullish osc divergence i5 = y9 < long_term_bull_filt // long term bullish bottom div i6 = delayedlow < long_term_bull_filt // long term bullish delayedbottom div plot(d, color=white) plot(bulldiv, title = "Tops", color=aqua, style=circles, linewidth=4, offset= -1) plot(beardiv, title = "Bottoms", color=red, style=circles, linewidth=4, offset= -1) plot(y10>y2 and oscMax and y3 < y4 ? d :na, title = "Bearish Divergence2", color=orange, style= circles, linewidth=4) plot(y9<y6 and oscMins and y7 > y8 ? d :na, title = "Bullish Divergence2", color=purple, style=circles, linewidth=4) plot(delayedlow<y6 and y7 > y8 ? d :na, title = "Bullish Divergence2", color=purple, style=circles, linewidth=4) plot(delayedhigh>y2 and y3 < y4 ? d :na, title = "Bearish Divergence2", color=orange, style= circles, linewidth=4) plot(long_term_div and oscMax and i and i2 ? d :na, title = "Bearish Divergence2", color=orange, style= circles, linewidth=4) plot(long_term_div and oscMins and i4 and i5 ? d : na, title = "Bullish Divergence2", color=purple, style=circles, linewidth=4) plot(long_term_div and i and i3 ? d :na, title = "Bearish Divergence2", color=orange, style= circles, linewidth=4) plot(long_term_div and i4 and i6 ? d : na, title = "Bullish Divergence2", color=purple, style=circles, linewidth=4)Pourquoi pas, mais cet indicateur utilise beaucoup les instructions “valuewhen” et “barsince” du langage Pinescript. Dans ProBuilder on va devoir faire un tas de boucles 😐
Cet indicateur est-il vraiment aussi bien que ce que j’ai pu en lire ?
Bonsoir Nicolas,
Pour le suivre depuis des mois cet indicateur me semble digne d’intérêt.Pour alléger le code on peut tenir compte que des points de retournements remarquables
et laisser de côté les points intermédiaires.
Si tu pouvais nous coder cela ce serait top !
bonne soirée@ Nicolas
J’ai l’impression que ce code est passé sous la pile de travail , aurais tu d’autres chats à fouetter ?
d’avance merci si tu peux nous convertir ce code même simplifié , juste avec les points principaux de retournements.
Bonne journée
J’ai toujours le même avis que la dernière fois, ça va pas être très facile.. comme j’ai aucun chats à fouetter, je vais tenter l’aventure ! c’est parti !
merci Nicolas, courage donc !
Voilà ce que j’ai pu tirer du code original, fidèle à 90% je dirai, pas mal de variables inutiles ou d’instructions mal utilisées à mon avis :
longtermdiv = 1 //input(true, title="Use long term Divergences?")
divlookbackperiod = 55//input(55, minval=1, title="Lookback Period")
fastLength = 12//input(12, minval=1),
slowLength= 26 //input(26,minval=1)
//signalLength= 9 //input(9,minval=1)
smoother = 2 //input(2,minval=1)

source = customclose

fastMA = average[fastLength,1](source)
slowMA = average[slowLength,1](source)
mmacd = fastMA - slowMA
macd2=(mmacd/slowMA)*100
d = average[smoother](macd2) // smoothing PPO

bullishPrice = low

priceMins = (bullishPrice > bullishPrice[1] and bullishPrice[1] < bullishPrice[2]) or (low[1] = low[2] and low[1] < low and low[1] < low[3]) or (low[1] = low[2] and low[1] = low[3] and low[1] < low and low[1] < low[4]) or (low[1] = low[2] and low[1] = low[3] and low[1] and low[1] = low[4] and low[1] < low and low[1] < low[5]) // this line identifies bottoms and plateaus in the price
oscMins= d > d[1] and d[1] < d[2] // this line identifies bottoms in the PPO

BottomPointsInPPO = oscMins

bearishPrice = high
priceMax = (bearishPrice < bearishPrice[1] and bearishPrice[1] > bearishPrice[2]) or (high[1] = high[2] and high[1] > high and high[1] > high[3]) or( high[1] = high[2] and high[1] = high[3] and high[1] > high and high[1] > high[4]) or (high[1] = high[2] and high[1] = high[3] and high[1] and high[1] = high[4] and high[1] > high and high[1] > high[5])  // this line identifies tops in the price
oscMax = d < d[1] and d[1] > d[2]   // this line identifies tops in the PPO

TopPointsInPPO = oscMax

//avoid loops!
if oscMins then
currenttrough4=d[1] //valuewhen (oscMins, d[1], 0) // identifies the value of PPO at the most recent BOTTOM in the PPO
oscMinsBar = barindex
endif
if oscMax then
currenttrough5=d[1] //valuewhen (oscMax, d[1], 0) // identifies the value of PPO at the most recent TOP in the PPO
oscMaxBar = barindex
endif

if priceMins then
currenttrough6= low[1]//valuewhen (priceMins, low[1], 0) // this line identifies the low (price) at the most recent bottom in the Price
priceMinsBar = barindex
if barindex-oscMinsBar<3 then //=line 47
delayedlow=low[1]
else
delayedlow=0
endif
if priceMins<>priceMins[1] then //=line62
longtermbullfilt=lowest[divlookbackperiod](source)[0]
endif
endif
if priceMax then
priceMaxBar = barindex
currenttrough7= high[1]//valuewhen (priceMax, high[1], 0) // this line identifies the high (price) at the most recent top in the Price
if barindex-oscMaxBar<3 then //=line48
delayedhigh=high[1]
else
delayedhigh=0
endif
if priceMax<>priceMax[1] then //=line63
longtermbearfilt=highest[divlookbackperiod](source)[0]
endif
endif


// only take tops/bottoms in price when tops/bottoms are less than 5 bars away
//filter = barssince(priceMins) < 5 ? lowest(currenttrough6, 4) : na
if barindex-priceMinsBar<5 then
filter = lowest[4](currenttrough6)
else
filter=0
endif
//filter2 = barssince(priceMax) < 5 ? highest(currenttrough7, 4) : na
if barindex-priceMaxBar<5 then
filter2=highest[4](currenttrough7)
else
filter2=0
endif

//delayedbottom/top when oscillator bottom/top is earlier than price bottom/top
//y11 = valuewhen(oscMins, delayedlow, 0)
if oscMins then
//y11=delayedlow
y7=currenttrough4 //=line71
y9 = currenttrough6 //=line74
if oscMins<>oscMins[1] and filter2>0 then
y2=filter2 //=line59
y8=currenttrough4[1] //=line72
endif
endif
//y12 = valuewhen(oscMax, delayedhigh, 0)
if oscMax then
//y12 = delayedhigh
y3=currenttrough5 //=line 65
y10=currenttrough7 //=line75
if oscMax<>oscMax[1] and filter>0 then
y6=filter //=line60
y4=currenttrough5[1] //=line66
endif
endif

// only take tops/bottoms in price when tops/bottoms are less than 5 bars away, since 2nd most recent top/bottom in osc
//y2=0
//y6=0
//for xyz=0 to barindex do
////y2=valuewhen(oscMax, filter2, 1) // identifies the highest high in the tops of price with 5 bar lookback period SINCE the SECOND most recent top in PPO
////y6=valuewhen(oscMins, filter, 1) // identifies the lowest low in the bottoms of price with 5 bar lookback period SINCE the SECOND most recent bottom in PPO
//if filter2[xyz]<>filter2 and filter2>0 then
//y2=filter2[xyz]
//endif
//if filter[xyz]<>filter and filter>0 then
//y6=filter[xyz]
//endif
//if y2>0 and y6>0 then
//break
//endif
//next

//bulldiv= BottomPointsInPPO ? d[1] : na // plots dots at bottoms in the PPO
if BottomPointsInPPo then
drawtext("●",barindex[1],d[1],dialog,bold,14) coloured(0,255,255)
endif
//beardiv= TopPointsInPPO ? d[1]: na // plots dots at tops in the PPO
if TopPointsInPPO then
drawtext("●",barindex[1],d[1],dialog,bold,14) coloured(255,0,0)
endif

i = currenttrough5 < highest[divlookbackperiod](d) // long term bearish oscilator divergence
i2 = y10 > longtermbearfilt // long term bearish top divergence
i3 = delayedhigh > longtermbearfilt and delayedhigh>0 // long term bearish delayedhigh divergence

i4 = currenttrough4 > lowest[divlookbackperiod](d) // long term bullish osc divergence
i5 = y9 < longtermbullfilt // long term bullish bottom div
i6 = delayedlow < longtermbullfilt and delayedlow>0// long term bullish delayedbottom div

//plot(y10>y2 and oscMax and y3 < y4 ? d :na, title = "Bearish Divergence2", color=orange, style= circles, linewidth=4)
if y10>y2 and oscMax and y3 < y4 then
drawtext("●",barindex,d,dialog,bold,14) coloured(255,165,0)
endif
//plot(y9<y6 and oscMins and y7 > y8 ? d :na, title = "Bullish Divergence2", color=purple, style=circles, linewidth=4)
if y9<y6 and oscMins and y7 > y8 then
drawtext("●",barindex,d,dialog,bold,14) coloured(128,0,128)
endif
//plot(delayedlow<y6 and y7 > y8 ? d :na, title = "Bullish Divergence2", color=purple, style=circles, linewidth=4)
if delayedlow<y6 and y7 > y8 and delayedlow>0 then
drawtext("●",barindex,d,dialog,bold,14) coloured(128,0,128)
endif
//plot(delayedhigh>y2 and y3 < y4 ? d :na, title = "Bearish Divergence2", color=orange, style= circles, linewidth=4)
if delayedhigh>y2 and y3 < y4 and delayedhigh>0 then
drawtext("●",barindex,d,dialog,bold,14) coloured(255,165,0)
endif

//plot(long_term_div and oscMax and i and i2 ? d :na, title = "Bearish Divergence2", color=orange, style= circles, linewidth=4)
if longtermdiv and oscMax and i and i2 then
drawtext("●",barindex,d,dialog,bold,14) coloured(255,165,0)
endif
//plot(long_term_div and oscMins and i4 and i5 ? d : na, title = "Bullish Divergence2", color=purple, style=circles, linewidth=4)
if longtermdiv and oscMins and i4 and i5 then
drawtext("●",barindex,d,dialog,bold,14) coloured(128,0,128)
endif
//plot(long_term_div and i and i3 ? d :na, title = "Bearish Divergence2", color=orange, style= circles, linewidth=4)
if longtermdiv and i and i3 then
drawtext("●",barindex,d,dialog,bold,14) coloured(255,165,0)
endif
//plot(long_term_div and i4 and i6 ? d : na, title = "Bullish Divergence2", color=purple, style=circles, linewidth=4)
if longtermdiv and i4 and i6 then
drawtext("●",barindex,d,dialog,bold,14) coloured(128,0,128)
endif

return d as "ppo"
hillsee thanked this postHe be ! ça va plus vite qu’à la poste ! ( j’espère qu’il n’y a pas trop de postiers sur le site )
Je l’incorpore dès maintenant à ma panoplie , merci pour le travail.
Bonsoir à tous
PKP la suite …
Pour ceux que cela intéresse je vous joins le screener qui nous renvoie les principaux signaux de retournements , tri : 1 = up et 2 = down
faites en bon usage
// SCREENER PKP NICO 15.09.2018

fastLength = 12//input(12, minval=1),
slowLength= 26 //input(26,minval=1)
smoother = 2 //input(2,minval=1)

source = customclose

fastMA = average[fastLength,1](source)
slowMA = average[slowLength,1](source)
mmacd = fastMA - slowMA
macd2=(mmacd/slowMA)*100
d = average[smoother](macd2) // smoothing PPO

oscMins= d > d[1] and d[1] < d[2] // this line identifies bottoms in the PPO
 BottomPointsInPPO = oscMins

oscMax = d < d[1] and d[1] > d[2]   // this line identifies tops in the PPO
 TopPointsInPPO = oscMax

if BottomPointsInPPo then
c1 = 1
else
c1 = 0
endif

if TopPointsInPPO then
c2 = 1
else
c2 = 0
endif

if c1 then
pattern = 1
elsif c2 then
pattern = 2
endif

SCREENER [c1 or c2 ] (pattern as " signal ")
Nicolas thanked this postBonjour à tous, bonjour Nicolas
PPK on chart :
Serait-ce possible d’avoir cet indicateur sur le graphique des prix ?
Bonne après midi
Salut Supertiti,
Voilà le code comme tu l’as demandé.
@ + …
longtermdiv = 1 //input(true, title="Use long term Divergences?")
divlookbackperiod = 55//input(55, minval=1, title="Lookback Period")
fastLength = 12//input(12, minval=1),
slowLength= 26 //input(26,minval=1)
//signalLength= 9 //input(9,minval=1)
smoother = 2 //input(2,minval=1)

source = customclose

P = (AverageTrueRange[2](close))

fastMA = average[fastLength,1](source)
slowMA = average[slowLength,1](source)
mmacd = fastMA - slowMA
macd2=(mmacd/slowMA)*100
d = average[smoother](macd2) // smoothing PPO

bullishPrice = low

priceMins = (bullishPrice > bullishPrice[1] and bullishPrice[1] < bullishPrice[2]) or (low[1] = low[2] and low[1] < low and low[1] < low[3]) or (low[1] = low[2] and low[1] = low[3] and low[1] < low and low[1] < low[4]) or (low[1] = low[2] and low[1] = low[3] and low[1] and low[1] = low[4] and low[1] < low and low[1] < low[5]) // this line identifies bottoms and plateaus in the price
oscMins= d > d[1] and d[1] < d[2] // this line identifies bottoms in the PPO

BottomPointsInPPO = oscMins

bearishPrice = high
priceMax = (bearishPrice < bearishPrice[1] and bearishPrice[1] > bearishPrice[2]) or (high[1] = high[2] and high[1] > high and high[1] > high[3]) or( high[1] = high[2] and high[1] = high[3] and high[1] > high and high[1] > high[4]) or (high[1] = high[2] and high[1] = high[3] and high[1] and high[1] = high[4] and high[1] > high and high[1] > high[5]) // this line identifies tops in the price
oscMax = d < d[1] and d[1] > d[2] // this line identifies tops in the PPO

TopPointsInPPO = oscMax

//avoid loops!
if oscMins then
currenttrough4=d[1] //valuewhen (oscMins, d[1], 0) // identifies the value of PPO at the most recent BOTTOM in the PPO
oscMinsBar = barindex
endif
if oscMax then
currenttrough5=d[1] //valuewhen (oscMax, d[1], 0) // identifies the value of PPO at the most recent TOP in the PPO
oscMaxBar = barindex
endif

if priceMins then
currenttrough6= low[1]//valuewhen (priceMins, low[1], 0) // this line identifies the low (price) at the most recent bottom in the Price
priceMinsBar = barindex
if barindex-oscMinsBar<3 then //=line 47
delayedlow=low[1]
else
delayedlow=0
endif
if priceMins<>priceMins[1] then //=line62
longtermbullfilt=lowest[divlookbackperiod](source)[0]
endif
endif
if priceMax then
priceMaxBar = barindex
currenttrough7= high[1]//valuewhen (priceMax, high[1], 0) // this line identifies the high (price) at the most recent top in the Price
if barindex-oscMaxBar<3 then //=line48
delayedhigh=high[1]
else
delayedhigh=0
endif
if priceMax<>priceMax[1] then //=line63
longtermbearfilt=highest[divlookbackperiod](source)[0]
endif
endif

// only take tops/bottoms in price when tops/bottoms are less than 5 bars away
//filter = barssince(priceMins) < 5 ? lowest(currenttrough6, 4) : na
if barindex-priceMinsBar<5 then
filter = lowest[4](currenttrough6)
else
filter=0
endif
//filter2 = barssince(priceMax) < 5 ? highest(currenttrough7, 4) : na
if barindex-priceMaxBar<5 then
filter2=highest[4](currenttrough7)
else
filter2=0
endif

//delayedbottom/top when oscillator bottom/top is earlier than price bottom/top
//y11 = valuewhen(oscMins, delayedlow, 0)
if oscMins then
//y11=delayedlow
y7=currenttrough4 //=line71
y9 = currenttrough6 //=line74
if oscMins<>oscMins[1] and filter2>0 then
y2=filter2 //=line59
y8=currenttrough4[1] //=line72
endif
endif
//y12 = valuewhen(oscMax, delayedhigh, 0)
if oscMax then
//y12 = delayedhigh
y3=currenttrough5 //=line 65
y10=currenttrough7 //=line75
if oscMax<>oscMax[1] and filter>0 then
y6=filter //=line60
y4=currenttrough5[1] //=line66
endif
endif

// only take tops/bottoms in price when tops/bottoms are less than 5 bars away, since 2nd most recent top/bottom in osc
//y2=0
//y6=0
//for xyz=0 to barindex do
////y2=valuewhen(oscMax, filter2, 1) // identifies the highest high in the tops of price with 5 bar lookback period SINCE the SECOND most recent top in PPO
////y6=valuewhen(oscMins, filter, 1) // identifies the lowest low in the bottoms of price with 5 bar lookback period SINCE the SECOND most recent bottom in PPO
//if filter2[xyz]<>filter2 and filter2>0 then
//y2=filter2[xyz]
//endif
//if filter[xyz]<>filter and filter>0 then
//y6=filter[xyz]
//endif
//if y2>0 and y6>0 then
//break
//endif
//next

//bulldiv= BottomPointsInPPO ? d[1] : na // plots dots at bottoms in the PPO
if BottomPointsInPPo then
drawtext("●",barindex[1],low-P[1],dialog,bold,14) coloured(0,255,255)
endif
//beardiv= TopPointsInPPO ? d[1]: na // plots dots at tops in the PPO
if TopPointsInPPO then
drawtext("●",barindex[1],high+P[1],dialog,bold,14) coloured(255,0,0)
endif

i = currenttrough5 < highest[divlookbackperiod](d) // long term bearish oscilator divergence
i2 = y10 > longtermbearfilt // long term bearish top divergence
i3 = delayedhigh > longtermbearfilt and delayedhigh>0 // long term bearish delayedhigh divergence

i4 = currenttrough4 > lowest[divlookbackperiod](d) // long term bullish osc divergence
i5 = y9 < longtermbullfilt // long term bullish bottom div
i6 = delayedlow < longtermbullfilt and delayedlow>0// long term bullish delayedbottom div

//plot(y10>y2 and oscMax and y3 < y4 ? d :na, title = "Bearish Divergence2", color=orange, style= circles, linewidth=4)
if y10>y2 and oscMax and y3 < y4 then
drawtext("●",barindex,low-P,dialog,bold,14) coloured(255,165,0)
endif
//plot(y9<y6 and oscMins and y7 > y8 ? d :na, title = "Bullish Divergence2", color=purple, style=circles, linewidth=4)
if y9<y6 and oscMins and y7 > y8 then
drawtext("●",barindex,high+P,dialog,bold,14) coloured(128,0,128)
endif
//plot(delayedlow<y6 and y7 > y8 ? d :na, title = "Bullish Divergence2", color=purple, style=circles, linewidth=4)
if delayedlow<y6 and y7 > y8 and delayedlow>0 then
drawtext("●",barindex,low-P,dialog,bold,14) coloured(128,0,128)
endif
//plot(delayedhigh>y2 and y3 < y4 ? d :na, title = "Bearish Divergence2", color=orange, style= circles, linewidth=4)
if delayedhigh>y2 and y3 < y4 and delayedhigh>0 then
drawtext("●",barindex,high+P,dialog,bold,14) coloured(255,165,0)
endif

//plot(long_term_div and oscMax and i and i2 ? d :na, title = "Bearish Divergence2", color=orange, style= circles, linewidth=4)
if longtermdiv and oscMax and i and i2 then
drawtext("●",barindex,low-P,dialog,bold,14) coloured(255,165,0)
endif
//plot(long_term_div and oscMins and i4 and i5 ? d : na, title = "Bullish Divergence2", color=purple, style=circles, linewidth=4)
if longtermdiv and oscMins and i4 and i5 then
drawtext("●",barindex,high+P,dialog,bold,14) coloured(128,0,128)
endif
//plot(long_term_div and i and i3 ? d :na, title = "Bearish Divergence2", color=orange, style= circles, linewidth=4)
if longtermdiv and i and i3 then
drawtext("●",barindex,low-P,dialog,bold,14) coloured(255,165,0)
endif
//plot(long_term_div and i4 and i6 ? d : na, title = "Bullish Divergence2", color=purple, style=circles, linewidth=4)
if longtermdiv and i4 and i6 then
drawtext("●",barindex,high+P,dialog,bold,14) coloured(128,0,128)
endif

return
Nicolas thanked this postlongtermdiv = 1 //input(true, title=”Use long term Divergences?”) divlookbackperiod = 55//input(55, minval=1, title=”Lookback Period”) fastLength = 12//input(12, minval=1), slowLength= 26 //input(26,minval=1) //signalLength= 9 //input(9,minval=1) smoother = 2 //input(2,minval=1) source = customclose P = (AverageTrueRange[2](close)) fastMA = average[fastLength,1](source) slowMA = average[slowLength,1](source) mmacd = fastMA – slowMA macd2=(mmacd/slowMA)*100 d = average[smoother](macd2) // smoothing PPO bullishPrice = low priceMins = (bullishPrice > bullishPrice[1] and bullishPrice[1] < bullishPrice[2]) or (low[1] = low[2] and low[1] < low and low[1] < low[3]) or (low[1] = low[2] and low[1] = low[3] and low[1] < low and low[1] < low[4]) or (low[1] = low[2] and low[1] = low[3] and low[1] and low[1] = low[4] and low[1] < low and low[1] < low[5]) // this line identifies bottoms and plateaus in the price oscMins= d > d[1] and d[1] < d[2] // this line identifies bottoms in the PPO BottomPointsInPPO = oscMins bearishPrice = high priceMax = (bearishPrice < bearishPrice[1] and bearishPrice[1] > bearishPrice[2]) or (high[1] = high[2] and high[1] > high and high[1] > high[3]) or( high[1] = high[2] and high[1] = high[3] and high[1] > high and high[1] > high[4]) or (high[1] = high[2] and high[1] = high[3] and high[1] and high[1] = high[4] and high[1] > high and high[1] > high[5]) // this line identifies tops in the price oscMax = d < d[1] and d[1] > d[2] // this line identifies tops in the PPO TopPointsInPPO = oscMax //avoid loops! if oscMins then currenttrough4=d[1] //valuewhen (oscMins, d[1], 0) // identifies the value of PPO at the most recent BOTTOM in the PPO oscMinsBar = barindex endif if oscMax then currenttrough5=d[1] //valuewhen (oscMax, d[1], 0) // identifies the value of PPO at the most recent TOP in the PPO oscMaxBar = barindex endif if priceMins then currenttrough6= low[1]//valuewhen (priceMins, low[1], 0) // this line identifies the low (price) at the most recent bottom in the Price priceMinsBar = barindex if barindex-oscMinsBar<3 then //=line 47 delayedlow=low[1] else delayedlow=0 endif if priceMins<>priceMins[1] then //=line62 longtermbullfilt=lowest[divlookbackperiod](source)[0] endif endif if priceMax then priceMaxBar = barindex currenttrough7= high[1]//valuewhen (priceMax, high[1], 0) // this line identifies the high (price) at the most recent top in the Price if barindex-oscMaxBar<3 then //=line48 delayedhigh=high[1] else delayedhigh=0 endif if priceMax<>priceMax[1] then //=line63 longtermbearfilt=highest[divlookbackperiod](source)[0] endif endif // only take tops/bottoms in price when tops/bottoms are less than 5 bars away //filter = barssince(priceMins) < 5 ? lowest(currenttrough6, 4) : na if barindex-priceMinsBar<5 then filter = lowest[4](currenttrough6) else filter=0 endif //filter2 = barssince(priceMax) < 5 ? highest(currenttrough7, 4) : na if barindex-priceMaxBar<5 then filter2=highest[4](currenttrough7) else filter2=0 endif //delayedbottom/top when oscillator bottom/top is earlier than price bottom/top //y11 = valuewhen(oscMins, delayedlow, 0) if oscMins then //y11=delayedlow y7=currenttrough4 //=line71 y9 = currenttrough6 //=line74 if oscMins<>oscMins[1] and filter2>0 then y2=filter2 //=line59 y8=currenttrough4[1] //=line72 endif endif //y12 = valuewhen(oscMax, delayedhigh, 0) if oscMax then //y12 = delayedhigh y3=currenttrough5 //=line 65 y10=currenttrough7 //=line75 if oscMax<>oscMax[1] and filter>0 then y6=filter //=line60 y4=currenttrough5[1] //=line66 endif endif // only take tops/bottoms in price when tops/bottoms are less than 5 bars away, since 2nd most recent top/bottom in osc //y2=0 //y6=0 //for xyz=0 to barindex do ////y2=valuewhen(oscMax, filter2, 1) // identifies the highest high in the tops of price with 5 bar lookback period SINCE the SECOND most recent top in PPO ////y6=valuewhen(oscMins, filter, 1) // identifies the lowest low in the bottoms of price with 5 bar lookback period SINCE the SECOND most recent bottom in PPO //if filter2[xyz]<>filter2 and filter2>0 then //y2=filter2[xyz] //endif //if filter[xyz]<>filter and filter>0 then //y6=filter[xyz] //endif //if y2>0 and y6>0 then //break //endif //next //bulldiv= BottomPointsInPPO ? d[1] : na // plots dots at bottoms in the PPO if BottomPointsInPPo then drawtext(“●”,barindex[1],low-P[1],dialog,bold,14) coloured(0,255,255) endif //beardiv= TopPointsInPPO ? d[1]: na // plots dots at tops in the PPO if TopPointsInPPO then drawtext(“●”,barindex[1],high+P[1],dialog,bold,14) coloured(255,0,0) endif i = currenttrough5 < highest[divlookbackperiod](d) // long term bearish oscilator divergence i2 = y10 > longtermbearfilt // long term bearish top divergence i3 = delayedhigh > longtermbearfilt and delayedhigh>0 // long term bearish delayedhigh divergence i4 = currenttrough4 > lowest[divlookbackperiod](d) // long term bullish osc divergence i5 = y9 < longtermbullfilt // long term bullish bottom div i6 = delayedlow < longtermbullfilt and delayedlow>0// long term bullish delayedbottom div //plot(y10>y2 and oscMax and y3 < y4 ? d :na, title = “Bearish Divergence2”, color=orange, style= circles, linewidth=4) if y10>y2 and oscMax and y3 < y4 then drawtext(“●”,barindex,low-P,dialog,bold,14) coloured(255,165,0) endif //plot(y9<y6 and oscMins and y7 > y8 ? d :na, title = “Bullish Divergence2”, color=purple, style=circles, linewidth=4) if y9<y6 and oscMins and y7 > y8 then drawtext(“●”,barindex,high+P,dialog,bold,14) coloured(128,0,128) endif //plot(delayedlow<y6 and y7 > y8 ? d :na, title = “Bullish Divergence2”, color=purple, style=circles, linewidth=4) if delayedlow<y6 and y7 > y8 and delayedlow>0 then drawtext(“●”,barindex,low-P,dialog,bold,14) coloured(128,0,128) endif //plot(delayedhigh>y2 and y3 < y4 ? d :na, title = “Bearish Divergence2”, color=orange, style= circles, linewidth=4) if delayedhigh>y2 and y3 < y4 and delayedhigh>0 then drawtext(“●”,barindex,high+P,dialog,bold,14) coloured(255,165,0) endif //plot(long_term_div and oscMax and i and i2 ? d :na, title = “Bearish Divergence2”, color=orange, style= circles, linewidth=4) if longtermdiv and oscMax and i and i2 then drawtext(“●”,barindex,low-P,dialog,bold,14) coloured(255,165,0) endif //plot(long_term_div and oscMins and i4 and i5 ? d : na, title = “Bullish Divergence2”, color=purple, style=circles, linewidth=4) if longtermdiv and oscMins and i4 and i5 then drawtext(“●”,barindex,high+P,dialog,bold,14) coloured(128,0,128) endif //plot(long_term_div and i and i3 ? d :na, title = “Bearish Divergence2”, color=orange, style= circles, linewidth=4) if longtermdiv and i and i3 then drawtext(“●”,barindex,low-P,dialog,bold,14) coloured(255,165,0) endif //plot(long_term_div and i4 and i6 ? d : na, title = “Bullish Divergence2”, color=purple, style=circles, linewidth=4) if longtermdiv and i4 and i6 then drawtext(“●”,barindex,high+P,dialog,bold,14) coloured(128,0,128) endif returnThe button [Insert PRT Code] is your friend 🙂
Nicolas thanked this postBonjour Matriciel,
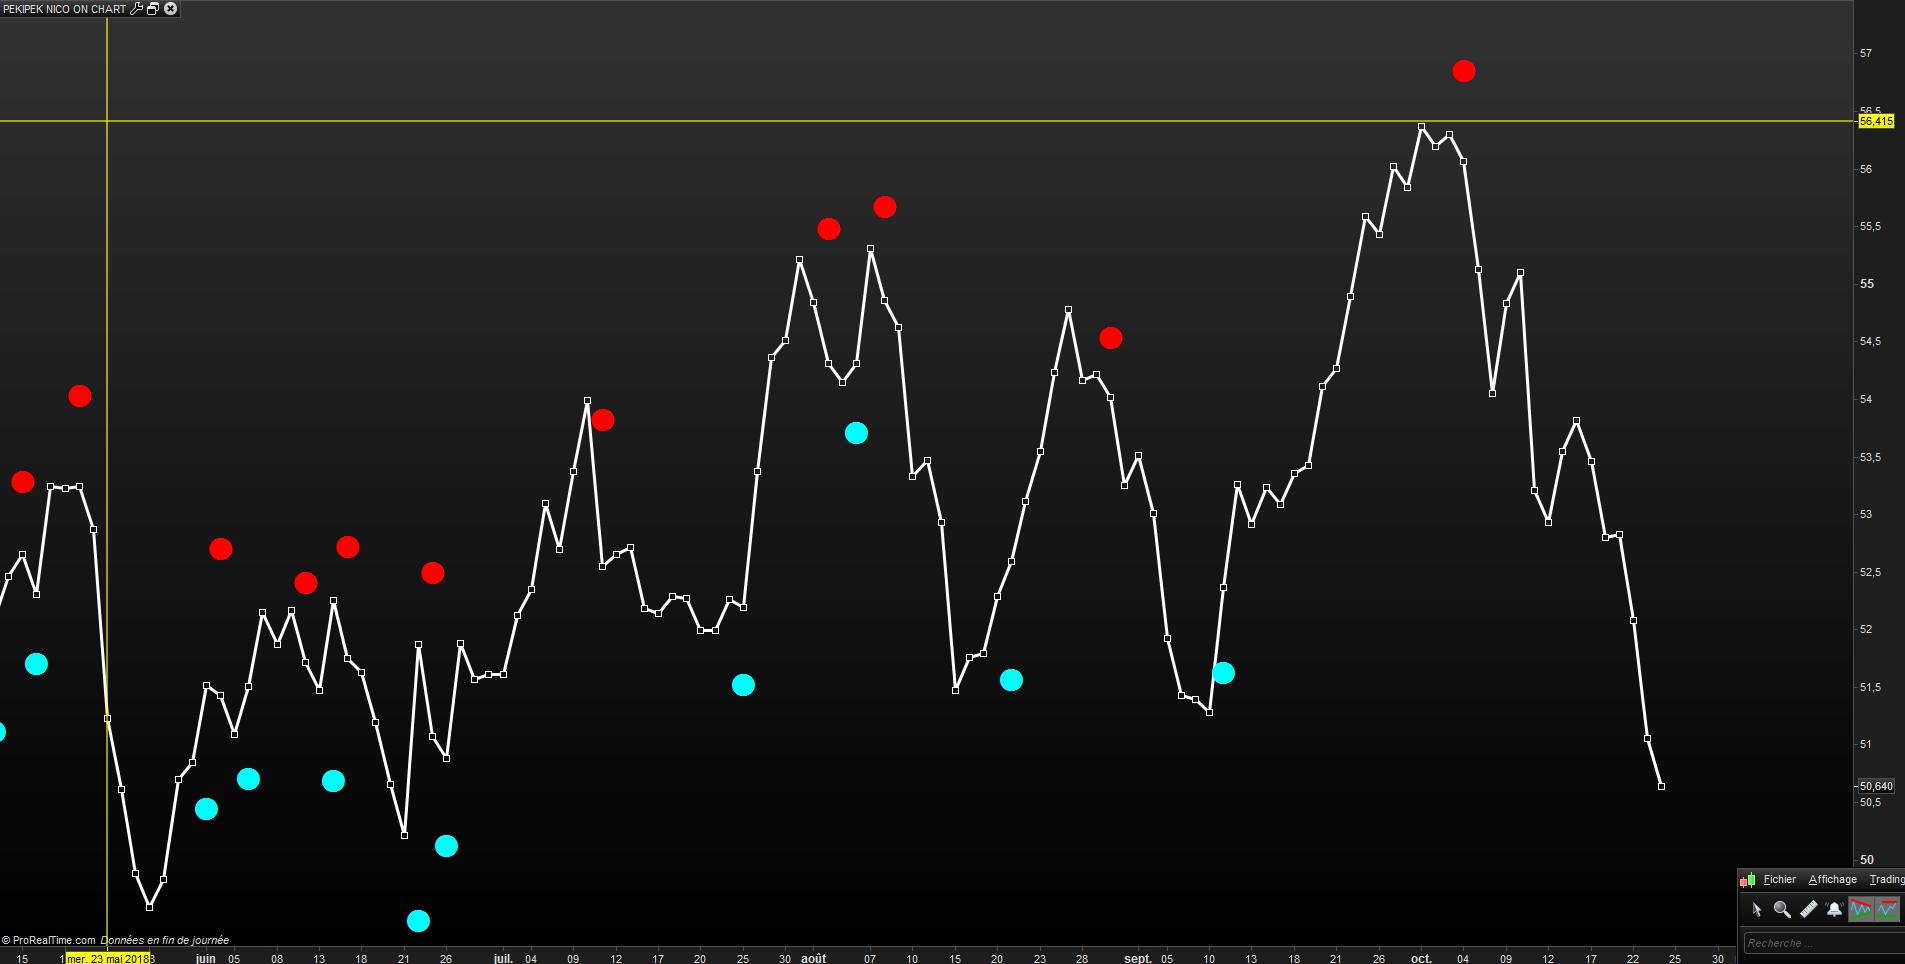
Merci pour ton aide précieuse , je n’ai gardé que les points forts de retournements sur le code ci-dessous , chacun fait comme il lui plait selon son trading.
Je joins un graphe de TOTAL
merci encore et bons trades.
// PEKIPEK NICO ON CHART by Matriciel 25.10.2018 // <pre class="lang:probuilder decode:true "> longtermdiv = 1 //input(true, title="Use long term Divergences?") divlookbackperiod = 55//input(55, minval=1, title="Lookback Period") fastLength = 12//input(12, minval=1), slowLength= 26 //input(26,minval=1) //signalLength= 9 //input(9,minval=1) smoother = 2 //input(2,minval=1) source = customclose P = (AverageTrueRange[2](close)) fastMA = average[fastLength,1](source) slowMA = average[slowLength,1](source) mmacd = fastMA - slowMA macd2=(mmacd/slowMA)*100 d = average[smoother](macd2) // smoothing PPO bullishPrice = low priceMins = (bullishPrice > bullishPrice[1] and bullishPrice[1] < bullishPrice[2]) or (low[1] = low[2] and low[1] < low and low[1] < low[3]) or (low[1] = low[2] and low[1] = low[3] and low[1] < low and low[1] < low[4]) or (low[1] = low[2] and low[1] = low[3] and low[1] and low[1] = low[4] and low[1] < low and low[1] < low[5]) // this line identifies bottoms and plateaus in the price oscMins= d > d[1] and d[1] < d[2] // this line identifies bottoms in the PPO BottomPointsInPPO = oscMins bearishPrice = high priceMax = (bearishPrice < bearishPrice[1] and bearishPrice[1] > bearishPrice[2]) or (high[1] = high[2] and high[1] > high and high[1] > high[3]) or( high[1] = high[2] and high[1] = high[3] and high[1] > high and high[1] > high[4]) or (high[1] = high[2] and high[1] = high[3] and high[1] and high[1] = high[4] and high[1] > high and high[1] > high[5]) // this line identifies tops in the price oscMax = d < d[1] and d[1] > d[2] // this line identifies tops in the PPO TopPointsInPPO = oscMax //avoid loops! if oscMins then currenttrough4=d[1] //valuewhen (oscMins, d[1], 0) // identifies the value of PPO at the most recent BOTTOM in the PPO oscMinsBar = barindex endif if oscMax then currenttrough5=d[1] //valuewhen (oscMax, d[1], 0) // identifies the value of PPO at the most recent TOP in the PPO oscMaxBar = barindex endif if priceMins then currenttrough6= low[1]//valuewhen (priceMins, low[1], 0) // this line identifies the low (price) at the most recent bottom in the Price priceMinsBar = barindex if barindex-oscMinsBar<3 then //=line 47 delayedlow=low[1] else delayedlow=0 endif if priceMins<>priceMins[1] then //=line62 longtermbullfilt=lowest[divlookbackperiod](source)[0] endif endif if priceMax then priceMaxBar = barindex currenttrough7= high[1]//valuewhen (priceMax, high[1], 0) // this line identifies the high (price) at the most recent top in the Price if barindex-oscMaxBar<3 then //=line48 delayedhigh=high[1] else delayedhigh=0 endif if priceMax<>priceMax[1] then //=line63 longtermbearfilt=highest[divlookbackperiod](source)[0] endif endif // only take tops/bottoms in price when tops/bottoms are less than 5 bars away //filter = barssince(priceMins) < 5 ? lowest(currenttrough6, 4) : na if barindex-priceMinsBar<5 then filter = lowest[4](currenttrough6) else filter=0 endif //filter2 = barssince(priceMax) < 5 ? highest(currenttrough7, 4) : na if barindex-priceMaxBar<5 then filter2=highest[4](currenttrough7) else filter2=0 endif //delayedbottom/top when oscillator bottom/top is earlier than price bottom/top //y11 = valuewhen(oscMins, delayedlow, 0) if oscMins then //y11=delayedlow y7=currenttrough4 //=line71 y9 = currenttrough6 //=line74 if oscMins<>oscMins[1] and filter2>0 then y2=filter2 //=line59 y8=currenttrough4[1] //=line72 endif endif //y12 = valuewhen(oscMax, delayedhigh, 0) if oscMax then //y12 = delayedhigh y3=currenttrough5 //=line 65 y10=currenttrough7 //=line75 if oscMax<>oscMax[1] and filter>0 then y6=filter //=line60 y4=currenttrough5[1] //=line66 endif endif // only take tops/bottoms in price when tops/bottoms are less than 5 bars away, since 2nd most recent top/bottom in osc //y2=0 //y6=0 //for xyz=0 to barindex do ////y2=valuewhen(oscMax, filter2, 1) // identifies the highest high in the tops of price with 5 bar lookback period SINCE the SECOND most recent top in PPO ////y6=valuewhen(oscMins, filter, 1) // identifies the lowest low in the bottoms of price with 5 bar lookback period SINCE the SECOND most recent bottom in PPO //if filter2[xyz]<>filter2 and filter2>0 then //y2=filter2[xyz] //endif //if filter[xyz]<>filter and filter>0 then //y6=filter[xyz] //endif //if y2>0 and y6>0 then //break //endif //next //bulldiv= BottomPointsInPPO ? d[1] : na // plots dots at bottoms in the PPO if BottomPointsInPPo then drawtext("●",barindex[1],low-P[1],dialog,bold,30) coloured(0,255,255) endif //beardiv= TopPointsInPPO ? d[1]: na // plots dots at tops in the PPO if TopPointsInPPO then drawtext("●",barindex[1],high+P[1],dialog,bold,30) coloured(255,0,0) endif i = currenttrough5 < highest[divlookbackperiod](d) // long term bearish oscilator divergence i2 = y10 > longtermbearfilt // long term bearish top divergence i3 = delayedhigh > longtermbearfilt and delayedhigh>0 // long term bearish delayedhigh divergence i4 = currenttrough4 > lowest[divlookbackperiod](d) // long term bullish osc divergence i5 = y9 < longtermbullfilt // long term bullish bottom div i6 = delayedlow < longtermbullfilt and delayedlow>0// long term bullish delayedbottom div //plot(y10>y2 and oscMax and y3 < y4 ? d :na, title = "Bearish Divergence2", color=orange, style= circles, linewidth=4) if y10>y2 and oscMax and y3 < y4 then //drawtext("●",barindex,low-P,dialog,bold,14) coloured(255,165,0) endif //plot(y9<y6 and oscMins and y7 > y8 ? d :na, title = "Bullish Divergence2", color=purple, style=circles, linewidth=4) if y9<y6 and oscMins and y7 > y8 then //drawtext("●",barindex,high+P,dialog,bold,14) coloured(128,0,128) endif //plot(delayedlow<y6 and y7 > y8 ? d :na, title = "Bullish Divergence2", color=purple, style=circles, linewidth=4) if delayedlow<y6 and y7 > y8 and delayedlow>0 then //drawtext("●",barindex,low-P,dialog,bold,14) coloured(128,0,128) endif //plot(delayedhigh>y2 and y3 < y4 ? d :na, title = "Bearish Divergence2", color=orange, style= circles, linewidth=4) if delayedhigh>y2 and y3 < y4 and delayedhigh>0 then //drawtext("●",barindex,high+P,dialog,bold,14) coloured(255,165,0) endif //plot(long_term_div and oscMax and i and i2 ? d :na, title = "Bearish Divergence2", color=orange, style= circles, linewidth=4) if longtermdiv and oscMax and i and i2 then //drawtext("●",barindex,low-P,dialog,bold,14) coloured(255,165,0) endif //plot(long_term_div and oscMins and i4 and i5 ? d : na, title = "Bullish Divergence2", color=purple, style=circles, linewidth=4) if longtermdiv and oscMins and i4 and i5 then //drawtext("●",barindex,high+P,dialog,bold,14) coloured(128,0,128) endif //plot(long_term_div and i and i3 ? d :na, title = "Bearish Divergence2", color=orange, style= circles, linewidth=4) if longtermdiv and i and i3 then //drawtext("●",barindex,low-P,dialog,bold,14) coloured(255,165,0) endif //plot(long_term_div and i4 and i6 ? d : na, title = "Bullish Divergence2", color=purple, style=circles, linewidth=4) if longtermdiv and i4 and i6 then //drawtext("●",barindex,high+P,dialog,bold,14) coloured(128,0,128) endif return customclose as " customclose "Merci beaucoup les amis, c’est super ! 🙂
En effet, pour le bouton, si vous encapsuler le code et que vous faîtes ensuite des retours en arrière ou des modifications du message, il est possible que les balises qui permettent le rendu du code soit effacé par inadvertance (l’idéal étant de vérifier dans l’onglet “text” de l’éditeur de message ou de ne plus toucher à rien du message une fois qu’on a utilisé le bouton).
Matriciel thanked this post -
AuthorPosts
- You must be logged in to reply to this topic.
PPK Tradingview
ProBuilder : Indicateurs & Outils Personnalisés
Author
Summary
This topic contains 29 replies,
has 4 voices, and was last updated by ![]() Nicolas
Nicolas
5 years ago.
Topic Details
| Forum: | ProBuilder : Indicateurs & Outils Personnalisés |
| Language: | French |
| Started: | 09/23/2017 |
| Status: | Active |
| Attachments: | 5 files |
About personal data collected
The information collected on this form is stored in a computer file by ProRealCode to create and access your ProRealCode profile. This data is kept in a secure database for the duration of the member's membership. They will be kept as long as you use our services and will be automatically deleted after 3 years of inactivity. Your personal data is used to create your private profile on ProRealCode. This data is maintained by SAS ProRealCode, 407 rue Freycinet, 59151 Arleux, France. If you subscribe to our newsletters, your email address is provided to our service provider "MailChimp" located in the United States, with whom we have signed a confidentiality agreement. This company is also compliant with the EU/Swiss Privacy Shield, and the GDPR. For any request for correction or deletion concerning your data, you can directly contact the ProRealCode team by email at privacy@prorealcode.com If you would like to lodge a complaint regarding the use of your personal data, you can contact your data protection supervisory authority.