Désolé le ctrl+f5 ne fonctionne pas pour entrer le code.
@JCbyWan
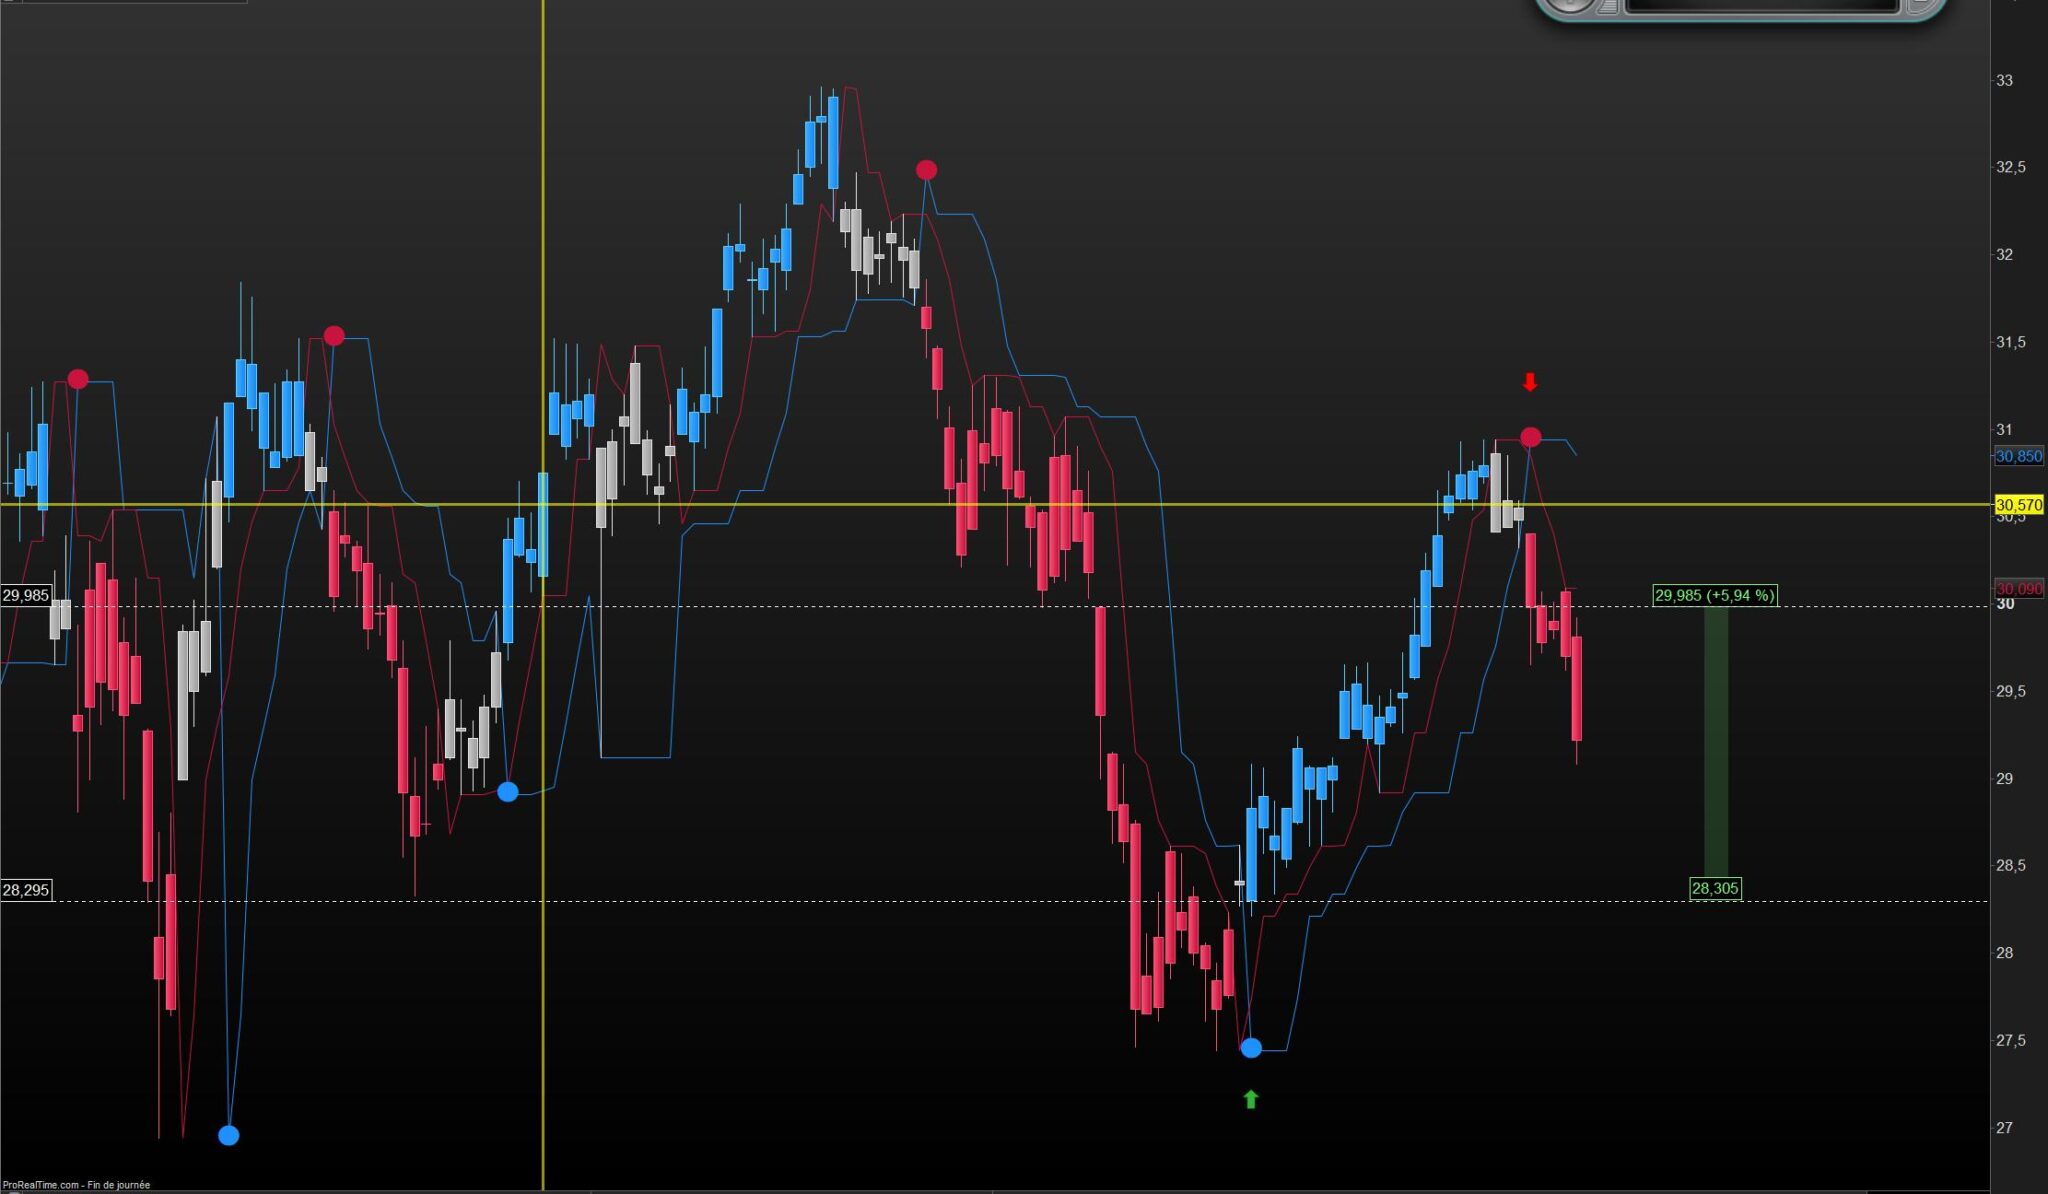
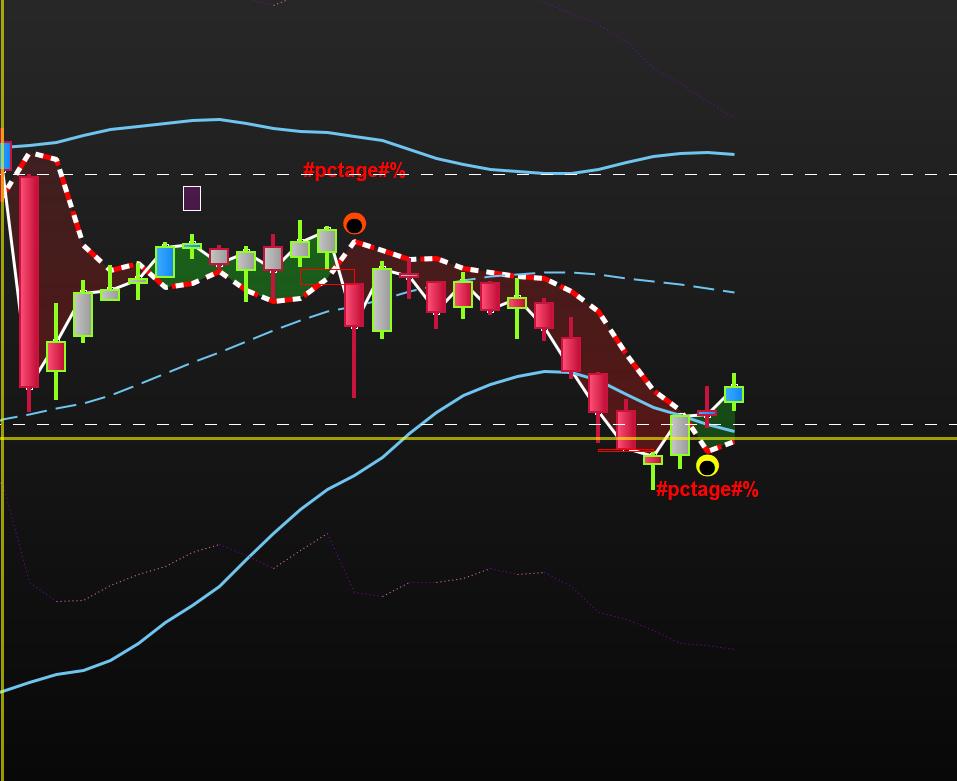
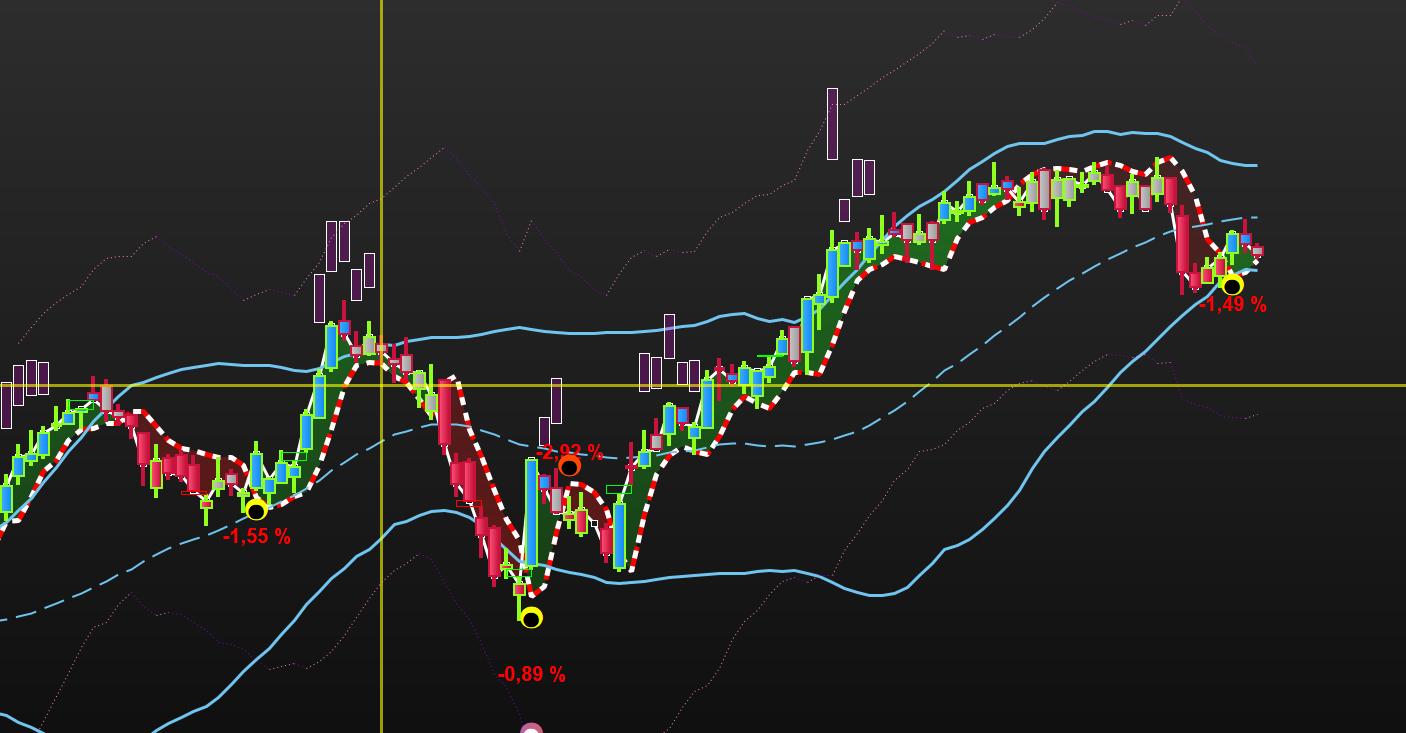
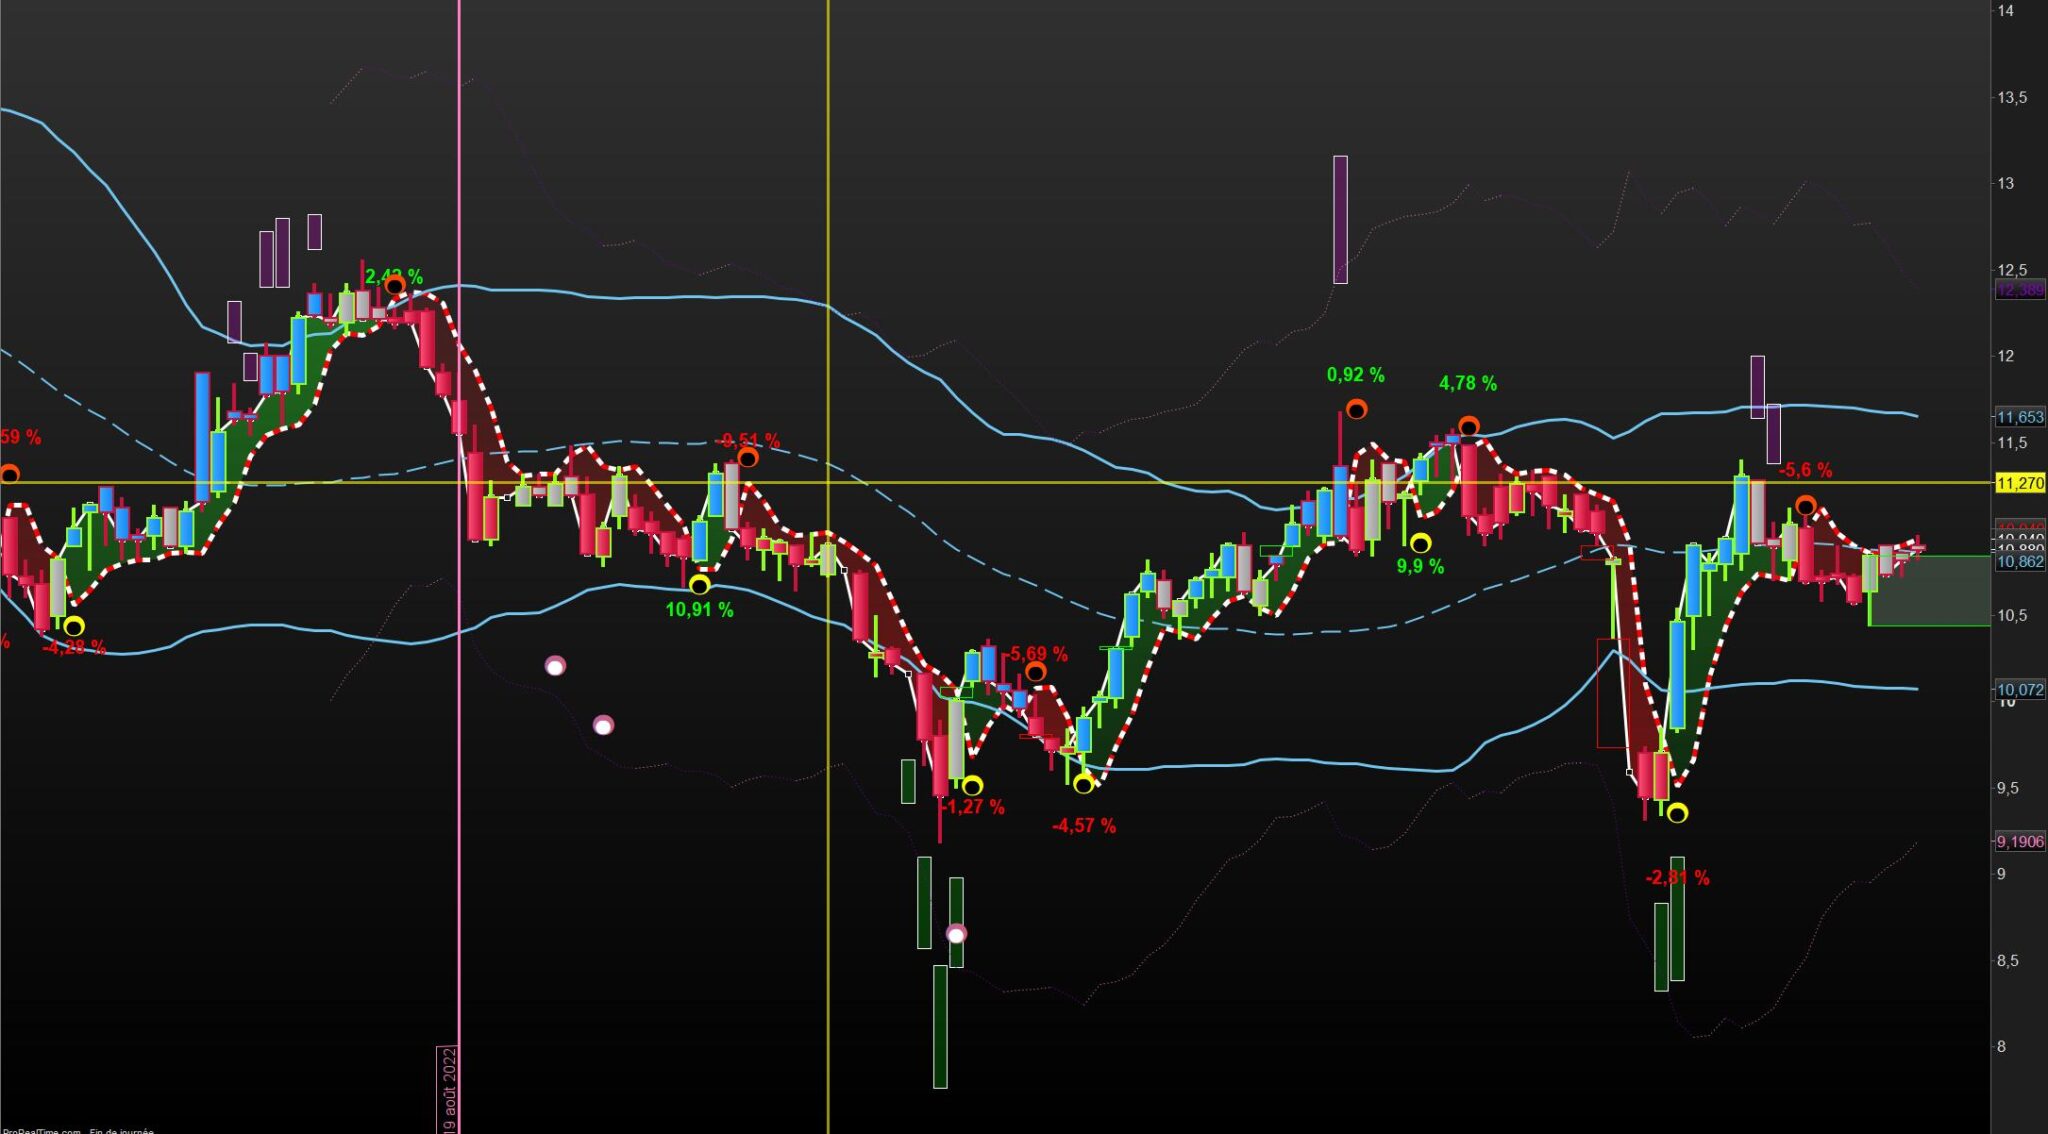
En réalité je viens de m’apercevoir que le code renvoit des pourcentages qui sont faux avec ce qui est ci-dessous.
moyen de voir d’où vient l’erreur ?
merci
meilleurs voeux pour 2023
//////////////////////////////////////////////////////////////////////////////////////////////////////

// PERFECT TRENDLINE2 MULTICOLORE V1 by DID 25.07.2022 modifié JCbyWan 28.12.2022

// PerfectTrendLine 2 PRC indicator //05.11.2020 modifié DID le 22.07.2022
//Nicolas @ http://www.prorealcode.com //Sharing ProRealTime knowledge
//converted from MT5 version (original author mladen)
//enhanced version by Nicolas
// OUVRIR le graphe PRIX en premier puis mettre les indicateurs …
// — settings
//SlowLength = 7
//FastLength = 3
//p=2
//m = type de moyenne perso = pondérée (2)
// — end of settings
defparam calculateonlastbars = 150
fasthigh = Highest[SlowLength](high)//[1]
fastlow = Lowest[SlowLength](low)//[1]
slowhigh = Highest[FastLength](high)//[1]
slowlow = Lowest[FastLength](low)//[1]

if high<slowhigh then
thighs=slowhigh
else
thighs=high
endif
if low>slowlow then
tlows=slowlow
else
tlows=low
endif
if high<fasthigh then
thighf=fasthigh
else
thighf=high
endif
if low>fastlow then
tlowf=fastlow
else
tlowf=low
endif

if close>slowln[1] then
slowln=tlows
else
slowln=thighs
endif
if close>fastln[1] then
fastln=tlowf
else
fastln=thighf
endif

once trend=-1
if close<slowln and close<fastln then
trend=1
endif
if close>slowln and close>fastln then
trend=0
endif

if trend<>trend[1] then
if trend=0 then
r=247//30 // jaune
g=255//144
b=0//255
deltaY= -range/2
else
r=255//200 // Orange
g=72//20
b=0//60
deltaY= range/2
endif
/////////////////////////////////////////////////////////////////////////////
if newsignal>=oldsignal then
rtext=0
gtext=255
btext=0
else
rtext=255
gtext=0
btext=0
endif
drawtext(“#pctage#%”,barindex,fastln+deltaY,Dialog,Bold,20) coloured(rtext,gtext,btext)
/////////////////////////////////////////////////////////////////////////////

oldsignal=newsignal
newsignal=close
//pctage=100*(newsignal-oldsignal)/oldsignal
pctage=round(100*(newsignal-oldsignal)/oldsignal,2)
drawtext(“●”,barindex,fastln,Dialog,Bold,30) coloured(r,g,b)
drawtext(“●”,barindex,fastln,Dialog,Bold,20) coloured(0,0,0)
//drawtext(“#pctage#%”,barindex,fastln+deltaY,Dialog,Bold,20) coloured(239,216,7)//jaune
endif
//////////////////////////////////////////////////////////////////
If close > open then
drawcandle(open,high,low,close) coloured(30,144,255) bordercolor (143,255,31)
endif
If close < open then
drawcandle(open,high,low,close) coloured(200,20,60) bordercolor (200,20,60)
endif

/////////////////////////////////////////////////////////////////
drawcandle(open,high,low,close) coloured (168,168,168)

if trend=0 then
if close>slowln then
drawcandle(open,high,low,close) coloured(30,144,255)
endif
elsif trend=1 then
if close<slowln then
drawcandle(open,high,low,close) coloured(200,20,60)
endif
endif
////////////////////////////////////////////////////
MASLOW = average [p,m](slowln)
MASFAST = average [p,m](fastln)
/////////////////////////////////////////////////////
/////////////////////////////////////////////////////////////////////////////////////
ONCE CciPeriod = 20
ONCE RsiPeriod = 12 //perso = 12
ONCE N = 14
ONCE K = 3
ONCE DiPeriod = 14
ONCE MAperiod = 20 // perso = 7 NON UTILISE
ONCE MAtype = 0 // 0=SMA NON UTILISE
ONCE UseCci = 1 // BOOLEEN VRAI =1 // CANDLE + COMMODITY CHANNEL INDEX
ONCE UseRsi = 1 //BOOLEEN VRAI =1 // CANDLE + RSI COLOUR
ONCE UseStochastic = 1 //BOOLEEN VRAI =1 // CANDLE + STOCASTIC COLOUR
ONCE UseCycle = 1 //BOOLEEN VRAI =1 // CANDLE + CYCLE COLOUR
ONCE UseDI = 1 //BOOLEEN VRAI =1 // CANDLE + DIRECTIONAL INDEX
// — end of settings

If UseCci then // CANDLE + COMMODITY CHANNEL INDEX COLOUR
MyCci = Cci[max(1,CciPeriod)](customclose)
R = (200-MyCci)
G = (200+MyCci)
Elsif UseRsi then // CANDLE + RSI COLOUR
MyRsi = RSI[max(1,RsiPeriod)](customclose)
R =50+(200-(MyRsi-50)*12)
G =50+(200+(MyRsi-50)*12)
Elsif UseStochastic then // CANDLE + STOCHASTIC COLOUR
MyStoch = Stochastic[max(1,N),max(1,K)](customclose)
R =50+(200-(MyStoch-50)*6)
G =50+(200+(MyStoch-50)*6)
Elsif UseCycle then // CANDLE + CYCLE COLOUR
MyCycle = Cycle(customclose)
R = (200-MyCycle*10)
G = (200+MyCycle*10)
Elsif UseDI then // CANDLE + DIRECTIONAL INDEX
MyDi = DI[max(1,DiPeriod)](customclose)
R = 50+(200-MyDi*10)
G = 50+(200+MyDi*10)
endif
////////////////////////////////////////////////////////////
// BANDES de BOLLINGER DID by Nicolas 02.09.2022

data = customclose
MA = average[20,m1](data)
BolUp = MA+STD[20]*dev
BolDn = MA-STD[20]*dev

// Return MA as ” MM34 ” , Bolup as ” Bolup ” , Boldn as ” Boldn ”

// Variables
// period = 20
// dev = 2
// m1 = 0 simple
//////////////////////////////////////////////////////////////////////////////////////
//////////////////////////////////////////////////////////////////////////////////////
return fastln coloured(30,144,255) as “fast line”,slowln coloured(200,20,60) as “slow line” , MASLOW as ” MASLOW ” coloured (R,G,0) , MASFAST as ” MASFAST ” , MASFAST as ” MASFAST ” ,close as “close” , MA as ” MM34 ” , Bolup as ” Bolup ” , Boldn as ” Boldn ” //, trend as “trend”