Bonjour, j aimerai avoir le plus haut quand le prix est haut dessus de la moyenne mobile et le plus plus bas si le prix est plus bas que la moyenne mobile,
j ai commencer un code mais il me met plusieurs plus haut et plusieurs plus bas
HLC3=(HIGH[1]+LOW[1]+CLOSE[1])/3
HLC=AVERAGE[5](HLC3)
EMA2=EXPONENTIALAVERAGE[2](CLOSE)
IF EMA2>HLC THEN
if(HIGH>Highest[N](CLOSE)) THEN
bandH = High
DRAWSEGMENT(BARINDEX,BANDH,BARINDEX+5,BANDH)COLOURED(0,200,250)
ENDIF
ENDIF
IF EMA2<HLC THEN
if(LOW<LOWest[N](close)) THEN
bandL = LOW
DRAWSEGMENT(BARINDEX,BANDL,BARINDEX+5,BANDL)COLOURED(250,0,0)
ENDIF
ENDIF
RETURN
C’est logique selon moi puisque le plus haut et le plus change.
J’ai recodé cette détection pour qu’elle soit bien visible:
HLC3=(HIGH[1]+LOW[1]+CLOSE[1])/3
HLC=AVERAGE[5](HLC3)
EMA2=EXPONENTIALAVERAGE[2](CLOSE)

if ema2 crosses over hlc then
hh=high
drawarrowup(barindex,low) coloured("lime")
endif
if ema2 crosses under hlc then
ll=low
drawarrowdown(barindex,low) coloured("red")
endif

IF EMA2>HLC THEN
hh=max(hh,high)
else
ll=min(ll,low)
endif

return hh,ll
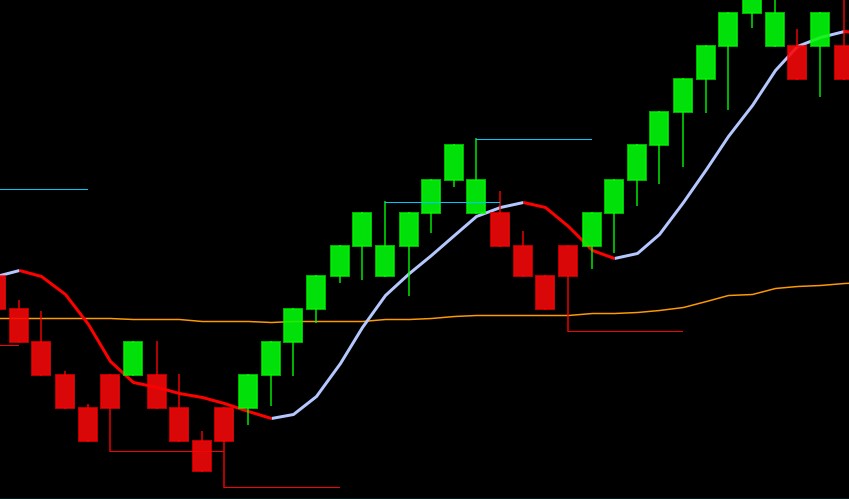
En fait j aimerai le plus haut des briques quand elles sont vertes (ema>hlc) et le plus bas des briques quand elles sont rouges (EMA<HLC) et pas quand les moyenne mobile se croise.CAD quand ca passe du vert au rouge on a le highest des briques vertes et vice versa. J espere que c est comprehensible.
j ai ecrit ce code pour recuperer les plus haut quand ema2>hlc et les plus bas quand ema2<hlc avec des tableaux mais ca ne fonctionne pas, je pense qu il faudrait un reset a chaque croisement mais je sais pas comment faire
HLC3=(HIGH[1]+LOW[1]+CLOSE[1])/3
HLC=AVERAGE[5](HLC3)
EMA2=EXPONENTIALAVERAGE[2](CLOSE)
GREEN=HLC<EMA2
RED=HLC>EMA2

IF GREEN THEN
$HH[I]=HIGH
I=I+1
HH=ARRAYMAX($HH)
DRAWSEGMENT(BARINDEX,HH,BARINDEX+5,HH)COLOURED(0,200,250)
ENDIF

IF RED THEN
$LL[I]=LOW
I=I+1
LL=ARRAYMin($LL)
DRAWSEGMENT(BARINDEX,LL,BARINDEX+5,LL)COLOURED(0,200,250)
ENDIF

return
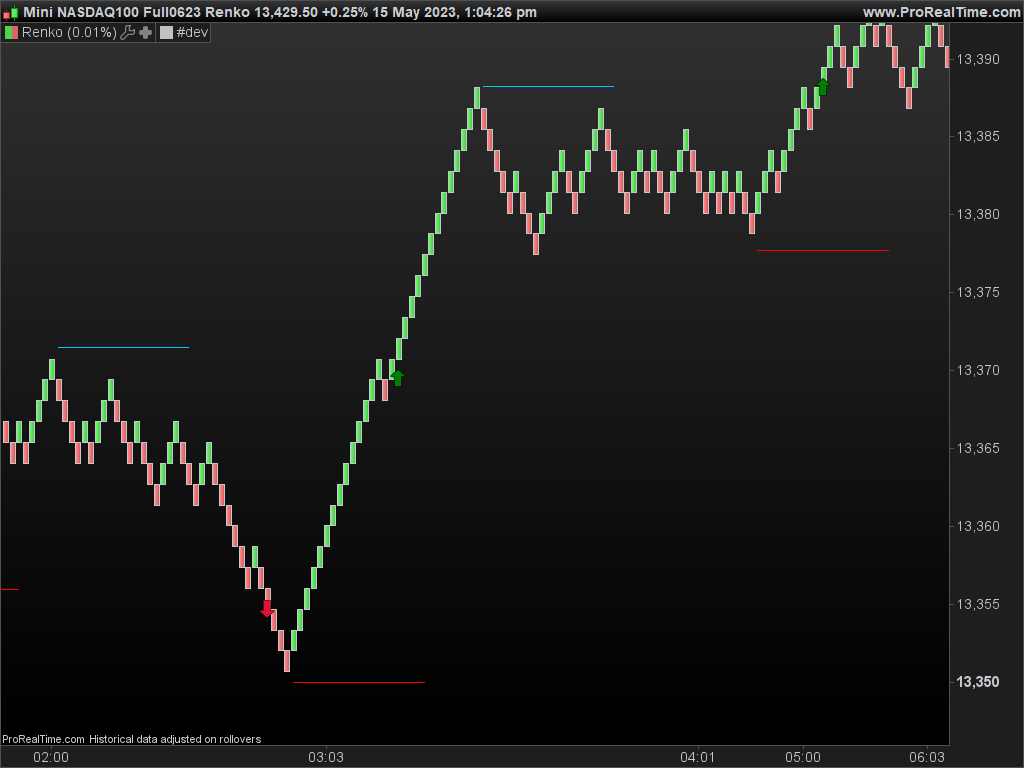
Au final j ai trouver un code a toi nicolas qui me convient bien.
j aimerai rajouter ce code pour avoir les retournement mais ca ne marche pas. comment recuperer les valeur llminorprice et hhminorprice ?.
IF llminorprice[1]<LLminorprice[2] AND llminorprice[1]<hhminorprice AND llminorprice <hhminorprice AND close> hhminorprice
drawtext("↑",barindex,LOW-ATR,dialog,BOLD,18) coloured(0,155,250)
ENDIF
hhminorprice=0
llminorprice=close*1000

for i = 1 to PeriodsInMinorSwing*2 do
if high[i]>hhminorprice then
hhminorbar = barindex[i]
hhminorprice = high[i]
$LL[II]=LLminorprice
II=I+1
endif
if low[i]<llminorprice then
llminorbar=barindex[i]
llminorprice=low[i]
$HH[II]=hhminorprice
II=II+1
endif
$HH[II]=hhminorprice
$LL[II]=LLminorprice
next

if barindex-hhminorbar=PeriodsInMinorSwing  then

DRAWSEGMENT(hhminorbar,hhminorprice,hhminorbar+5,hhminorprice)COLOURED(0,200,250)
endif
if barindex-llminorbar=PeriodsInMinorSwing then

DRAWSEGMENT(llminorbar,llminorprice,llminorbar+5,llminorprice)COLOURED(250,0,0)
endif

return
Si j’a bien compris il faut signaler les breakouts des derniers plus hauts et bas, ci-joint le code:
PeriodsInMinorSwing=20

hhminorprice=0
llminorprice=close*1000

for i = 1 to PeriodsInMinorSwing*2 do
if high[i]>hhminorprice then
hhminorbar = barindex[i]
hhminorprice = high[i]
$LL[II]=LLminorprice
II=I+1
endif
if low[i]<llminorprice then
llminorbar=barindex[i]
llminorprice=low[i]
$HH[II]=hhminorprice
II=II+1
endif
$HH[II]=hhminorprice
$LL[II]=LLminorprice
next

if barindex-hhminorbar=PeriodsInMinorSwing  then
DRAWSEGMENT(hhminorbar,hhminorprice,barindex,hhminorprice)COLOURED(0,200,250)
hh=hhminorprice
endif
if barindex-llminorbar=PeriodsInMinorSwing then
DRAWSEGMENT(llminorbar,llminorprice,barindex,llminorprice)COLOURED(250,0,0)
ll=llminorprice
endif

if close crosses over hh and hh<>lastsig then
drawarrowup(barindex,low) coloured("green")
lastsig = hh
endif
if close crosses under ll and ll<>lastsig then
drawarrowdown(barindex,low) coloured("crimson")
lastsig = ll
endif


return
C est ca mais pour que le breakout soit valide il faut qu il y est un plus haut de plus en plus haut et un plus bas de plus en plus haut et vice versa.
ex: ll[1] <ll and hh[1]<hh and close crosses over hh.
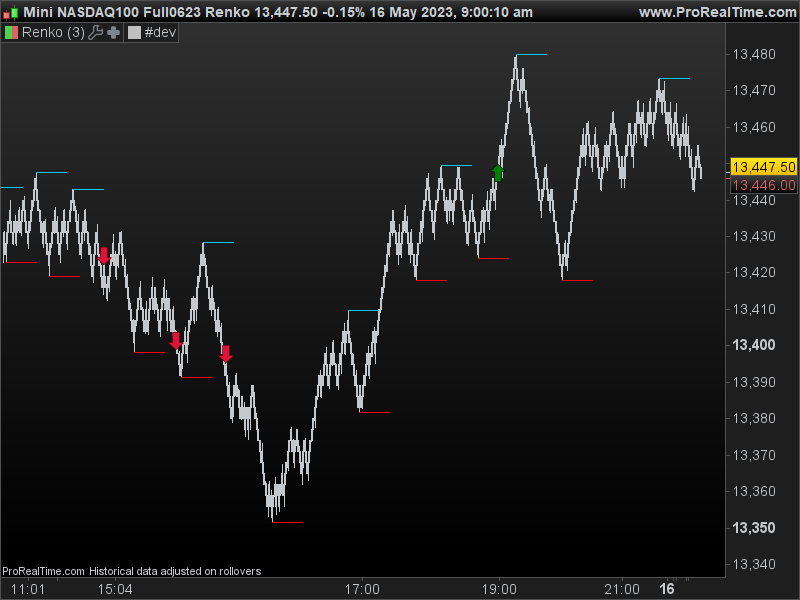
Très bien, dans ce cas la version ci-dessous affiche des signaux uniquement si on casse un plus haut plus haut que le précédent et qu’il existe un plus bas plus haut que le précédent pour les achats et vice versa pour les ventes.
PeriodsInMinorSwing=20

hhminorprice=0
llminorprice=close*1000

for i = 1 to PeriodsInMinorSwing*2 do
if high[i]>hhminorprice then
hhminorbar = barindex[i]
hhminorprice = high[i]
$LL[II]=LLminorprice
II=I+1
endif
if low[i]<llminorprice then
llminorbar=barindex[i]
llminorprice=low[i]
$HH[II]=hhminorprice
II=II+1
endif
$HH[II]=hhminorprice
$LL[II]=LLminorprice
next

if barindex-hhminorbar=PeriodsInMinorSwing  then
DRAWSEGMENT(hhminorbar,hhminorprice,barindex,hhminorprice)COLOURED(0,200,250)
$top[a]=hhminorprice
$topbar[a]=hhminorbar
a=a+1
endif
if barindex-llminorbar=PeriodsInMinorSwing then
DRAWSEGMENT(llminorbar,llminorprice,barindex,llminorprice)COLOURED(250,0,0)
$bot[b]=llminorprice
$botbar[b]=llminorbar
b=b+1
endif

//signals
if a>2 and b>2 then
uptrend = $top[a-1]>$top[a-2] and $bot[b-1]>$bot[b-2]
dntrend = $top[a-1]<$top[a-2] and $bot[b-1]<$bot[b-2]
if uptrend and close>$top[a-1] and close[1]<$top[a-1] and lastsig<>$top[a-1] then
drawarrowup(barindex,low) coloured("green")
lastsig =$top[a-1]
endif
if dntrend and close<$bot[b-1] and close[1]>$bot[b-1] and lastsig<>$bot[b-1] then
drawarrowdown(barindex,high) coloured("crimson")
lastsig =$bot[b-1]
endif
endif

return
C est parfait merci pour ton aide Nicolas!