Hi
Could somebody please help with the creation of the following indicator.
Plot Yesterday’s High, Low and Close. The instrument trades 24 hours so the parameters necessary for calculating the indicator: Open- 083000 Close 160000. Must display on lower timeframe charts.
Thank you
Hi,
This exists as an indicator in your PRT platform per default.
If I translate it from french it should be called “price line”. You can select “previous period” which will display yesterday’s values. According to your wish, you will create 3 indicators like this : one for the Close, one for the Highest, one for the Lowest (select “close”, “high” “low” in the indicator properties).
BR,
Precisely what was wanted. Merci.
Actually this is not what you asked for. The inbuilt PRT function works quite OK (there is also little problems) for high and low of the last 24h but open and close will not give you the open at 8:30 or whichever open you mean. The open tex for the Dax will give you the price from 0:00 since IG gives you a price for the dax 24h.
So if you want an indicator that shows yesterdays open at 8:30 you will have to code it yourself and this will only work on timeframes 30min or lower. Same for the close, though if you want to have it from 16:00 1h timeframe will of course also work.
You are absolutely right – noticed it this morning. Unable to code though. So will continue to draw manually………………
 AVT
AVTParticipant
Senior
@denmar
Would you please tell me exactely what lines you need? Yesterdays high, low, close is something differen than 8h open and 16h close. Or do you want all those lines, and for how long do need them in the chart?. I am plotting a lot of such lines in my window, so maybe I could change my code to your needs.
Hi AVt
I am interested in the previous days HIGH, LOW reached between 0830 and 1630 and CLOSE at 1630 plotted for current day and the current day’s OPEN 0830.
Thanks
It is problematic to code such an indicator if it shall work on different timeframes. Especially there is no possibility to make this work on TF larger than 30min.
Hi Despair – I am realizing there are limitations to Prorealtime – but one just adapts to these and makes do.
AVTParticipant
Senior
The first part is easy, so get at least some lines automatic painted, I give you the code for painting the closing of yesterday and todays open.
MarketRange = (time>=083000 AND time<=163000) // 8:30-16:30
// --- the trick for this is to go until midnight and start at midnight again
PrintCloseRange = ( (time>=000000 AND time<=162959) OR (time>163100 AND time<235959) )
IF Time = 083000 THEN
EightHOpenVal = open     // 8:30 open
ELSIF Time = 163000 THEN
XClose = close           // 16:30 close
ENDIF
IF MarketRange THEN         // 8:30 orange
DRAWSEGMENT(barindex-1,EightHOpenVal,barindex,EightHOpenVal) coloured(255,128,0)
ENDIF

IF PrintCloseRange THEN    // yesterday-today 16:30 black
DRAWSEGMENT(barindex-1,XClose,barindex,XClose) coloured(0,0,0)
ENDIF

RETURN
I know there’s a trick to get the other too, still working on that one, cause I don’t paint yesterdays high/low into todays chart (my own limit would be short before today opens, because I have enough lines in my day chart).
Check the first two, would be for now 2 lines less, if it works the way you wanted.
AVTParticipant
Senior
I think I got it working. Would you please test if it works as we want it. Thanks. Code:
MarketRange = (time>=083000 AND time<=163000) // 8:30-16:30
// --- the trick for this is to go until midnight and start at midnight again
PrintCloseRange = ( (time>=000000 AND time<=162959) OR (time>163100 AND time<235959) )
//PrintHighLowRange = ( (time>=163100 AND time<=000000) OR (time>=000001 AND time<=163000) )
IF Time = 083000 THEN
EightHOpenVal = open     // 8:30 open
ELSIF Time = 163000 THEN
XClose = close           // 16:30 close
ENDIF
IF MarketRange THEN         // 8:30 orange
DRAWSEGMENT(barindex,EightHOpenVal,barindex+1,EightHOpenVal) coloured(255,128,0)
ENDIF
IF PrintCloseRange THEN    // yesterday-today 16:30 black
DRAWSEGMENT(barindex-1,XClose,barindex,XClose) coloured(0,0,0)
ENDIF

Once MyDayOfWeek=CurrentDayOfWeek  // returns 5
Drawtext("wd#MyDayOfWeek#",barindex-20,0.4)
IF (IntradayBarIndex=0) AND (DayOfWeek[0]<>MyDayOfWeek) THEN  // DayOfWeek[0] returns 4 yesterday
YhighestPrice = 0              // Y ultimate low
YlowestPrice = close * 1000    // Y ultimate high
ENDIF
IF Marketrange THEN    //
YhighestPrice = max(YhighestPrice,high)
YlowestPrice = min(YlowestPrice,low)
YHighest = YhighestPrice
YLowest = YlowestPrice
ENDIF

if BarIndex < 3 then
MyDay=openday
dayminutes = 1440*(MyDay-MyDay[1])
MyHour=openhour
hourminutes = 60*(MyHour-MyHour[1])
MyMin=openminute
barminutes = MyMin - MyMin[1] + hourminutes + dayminutes
barminutes=abs(barminutes)
Mybarminutes = lowest[1](barminutes)[1]
endif
IF Mybarminutes = 1 THEN
Future=480
ELSIF Mybarminutes = 5 THEN
Future=100
ELSIF Mybarminutes = 10 THEN
Future=48
ELSIF Mybarminutes = 15 THEN
Future=34
ELSIF Mybarminutes = 30 THEN
Future=18
ELSIF Mybarminutes = 60 THEN
Future=9
ELSIF Mybarminutes = 120 THEN
Future=4
ELSE
Future=1
ENDIF

IF (time>=170000 AND time<245959) OR (time>=00000 AND time<=082959) THEN // yesterday blue
DRAWSEGMENT(barindex,YHighest,barindex+Future,YHighest) coloured(0,0,255)
DRAWSEGMENT(barindex,YLowest,barindex+Future,YLowest) coloured(0,0,255)
ENDIF

RETURN
Sorry that comments are not as usual, is just my “working sheet”. 😉
Thanks AVT .. will definitely try it out on Monday .. The market I am interested in closed about 1/2 an hour ago… thumbs crossed.
AVTParticipant
Senior
Thanks denmar, DAX is also closed. I checked the paintings for the last few days on DAX and they look like it is what you wanted. Have a nice weekend.
Hi AVT, couldn’t wait for Monday. So have been checking it out this morning – certainly seems correct. Many, many thanks. Will confirm that all is in order next week. Big thumbs up.
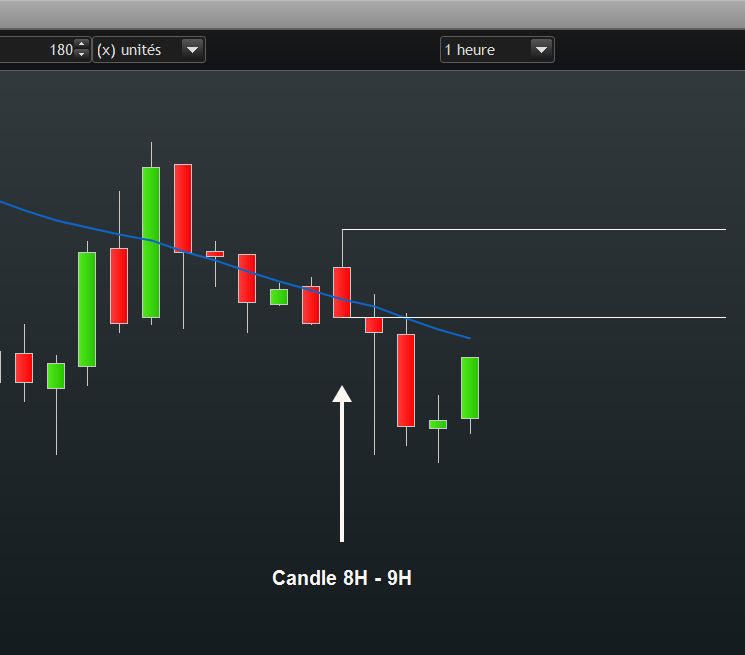
Hello,
I have similar request, I need to draw 2 segments (or a rectangle) to see the levels of 8:00 and 9:00 in my 15 minutes or hourly chart (cf. screenshot)
please advice how to implement this (ideally in a flexible way so that I can change the interval…).