Plot indicator on the Chart

Viewing 6 posts - 1 through 6 (of 6 total)
  • Author
    Posts
  • #126725 quote
    vcharlescvcharlesc
    Participant
    Average

    Dear friends,

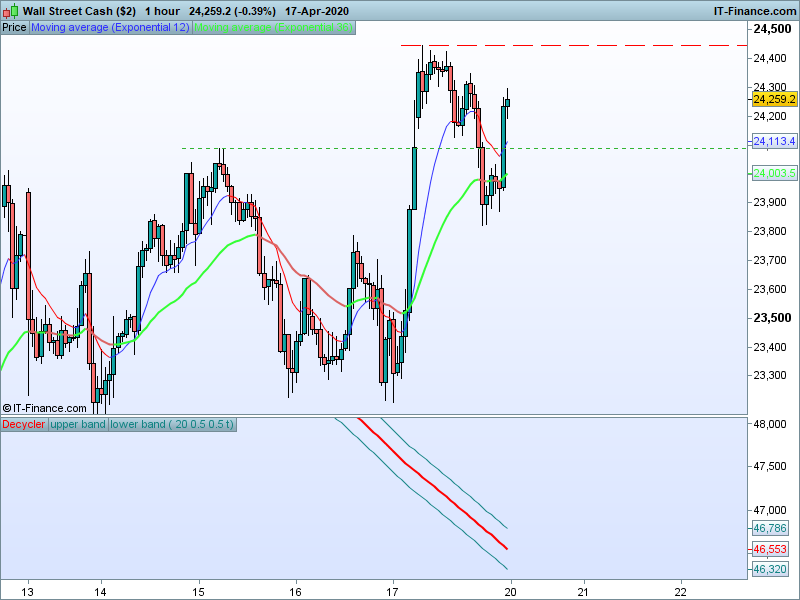
    I having problem with plotting indicator (itf. file) on the chart , it was plotted below from the chart.

    How do set this indicator on the chart.

    DOW-1-hour.png DOW-1-hour.png
    #126728 quote
    NicolasNicolas
    Keymaster
    Legend

    Add it on the price, by clicking on “price” then “add indicator”.

    #126747 quote
    vcharlescvcharlesc
    Participant
    Average

    Dear Nicolas,

    Thanks for your prompt response.

    #242381 quote
    vcharlescvcharlesc
    Participant
    Average

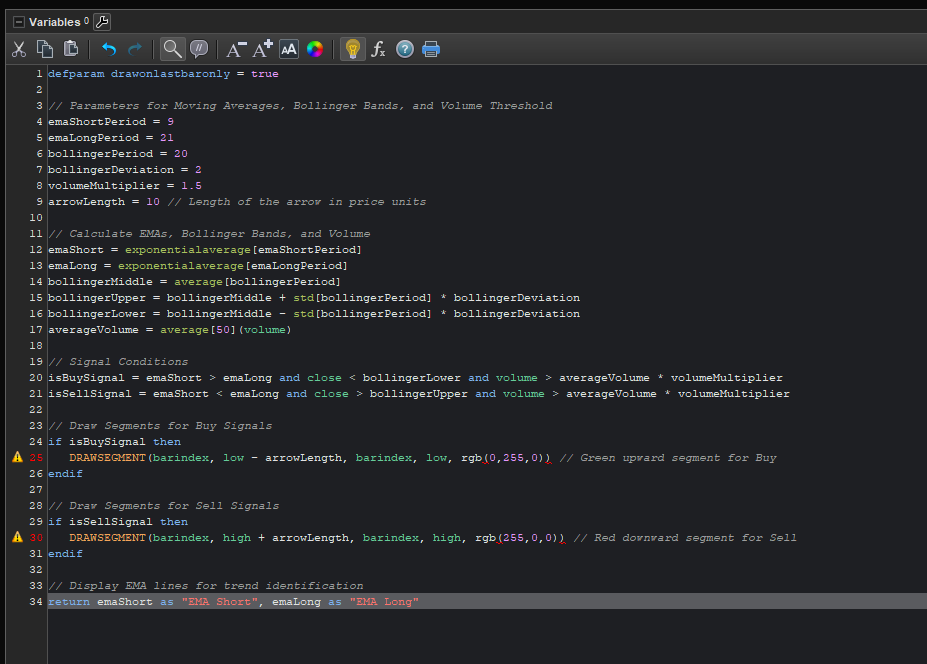
    defparam drawonlastbaronly = true

    // Parameters for Moving Averages, Bollinger Bands, and Volume Threshold
    emaShortPeriod = 9
    emaLongPeriod = 21
    bollingerPeriod = 20
    bollingerDeviation = 2
    volumeMultiplier = 1.5
    arrowLength = 10 // Length of the arrow in price units

    // Calculate EMAs, Bollinger Bands, and Volume
    emaShort = exponentialaverage[emaShortPeriod]
    emaLong = exponentialaverage[emaLongPeriod]
    bollingerMiddle = average[bollingerPeriod]
    bollingerUpper = bollingerMiddle + std[bollingerPeriod] * bollingerDeviation
    bollingerLower = bollingerMiddle – std[bollingerPeriod] * bollingerDeviation
    averageVolume = average[50](volume)

    // Signal Conditions
    isBuySignal = emaShort > emaLong and close < bollingerLower and volume > averageVolume * volumeMultiplier
    isSellSignal = emaShort < emaLong and close > bollingerUpper and volume > averageVolume * volumeMultiplier

    // Draw Segments for Buy Signals
    if isBuySignal then
    DRAWSEGMENT(barindex, low – arrowLength, barindex, low, rgb(0,255,0)) // Green upward segment for Buy
    endif

    // Draw Segments for Sell Signals
    if isSellSignal then
    DRAWSEGMENT(barindex, high + arrowLength, barindex, high, rgb(255,0,0)) // Red downward segment for Sell
    endif

    // Display EMA lines for trend identification
    return emaShort as “EMA Short”, emaLong as “EMA Long”

    Capture.png Capture.png
    #242383 quote
    vcharlescvcharlesc
    Participant
    Average

    defparam drawonlastbaronly = true

    // Parameters for Moving Averages, Bollinger Bands, and Volume Threshold

    emaShortPeriod = 9

    emaLongPeriod = 21

    bollingerPeriod = 20

    bollingerDeviation = 2

    volumeMultiplier = 1.5

    arrowLength = 10 // Length of the arrow in price units

    // Calculate EMAs, Bollinger Bands, and Volume

    emaShort = exponentialaverage[emaShortPeriod]

    emaLong = exponentialaverage[emaLongPeriod]

    bollingerMiddle = average[bollingerPeriod]

    bollingerUpper = bollingerMiddle + std[bollingerPeriod] * bollingerDeviation

    bollingerLower = bollingerMiddle – std[bollingerPeriod] * bollingerDeviation

    averageVolume = average[50](volume)

    // Signal Conditions

    isBuySignal = emaShort > emaLong and close < bollingerLower and volume > averageVolume * volumeMultiplier

    isSellSignal = emaShort < emaLong and close > bollingerUpper and volume > averageVolume * volumeMultiplier

    // Draw Segments for Buy Signals

    if isBuySignal then

    DRAWSEGMENT(barindex, low – arrowLength, barindex, low, rgb(0,255,0)) // Green upward segment for Buy

    endif

    // Draw Segments for Sell Signals

    if isSellSignal then

    DRAWSEGMENT(barindex, high + arrowLength, barindex, high, rgb(255,0,0)) // Red downward segment for Sell

    endif

    // Display EMA lines for trend identification

    return emaShort as “EMA Short”, emaLong as “EMA Long”

    Help me fix this error

    #242394 quote
    JC_BywanJC_Bywan
    Moderator
    Master

    Hi,

    DRAWSEGMENT(barindex, low – arrowLength, barindex, low, rgb(0,255,0)) // Green upward segment for Buy

    … is not the correct syntax to assign a color to your segment, instead it should be written as follows:

    DRAWSEGMENT(barindex, low – arrowLength, barindex, low) coloured(0,255,0) // Green upward segment for Buy


    Same thing for the red one and its incorrect rgb(255,0,0), full line to be replaced with:

    DRAWSEGMENT(barindex, high + arrowLength, barindex, high) coloured(255,0,0) // Red downward segment for Sell

    vcharlesc thanked this post
Viewing 6 posts - 1 through 6 (of 6 total)

  • You must be logged in to reply to this topic.

ProRealAI ProRealAI New

Stuck on this ProBuilder code?

Describe what this topic is trying to build, in plain English, and ProRealAI writes the ProRealTime™ indicator, screener or system for you.

Available in 7 languages
Try ProRealAI

Plot indicator on the Chart


ProBuilder: Indicators & Custom Tools

New Reply
Author
author-avatar
vcharlesc @vcharlesc Participant
Summary

This topic contains 5 replies,
has 2 voices, and was last updated by JC_BywanJC_Bywan

1 year, 8 months ago.

Topic Details
Forum: ProBuilder: Indicators & Custom Tools
Language: English
Started: 04/18/2020
Status: Active
Attachments: 2 files
ProRealCode ProRealCode
Loading...