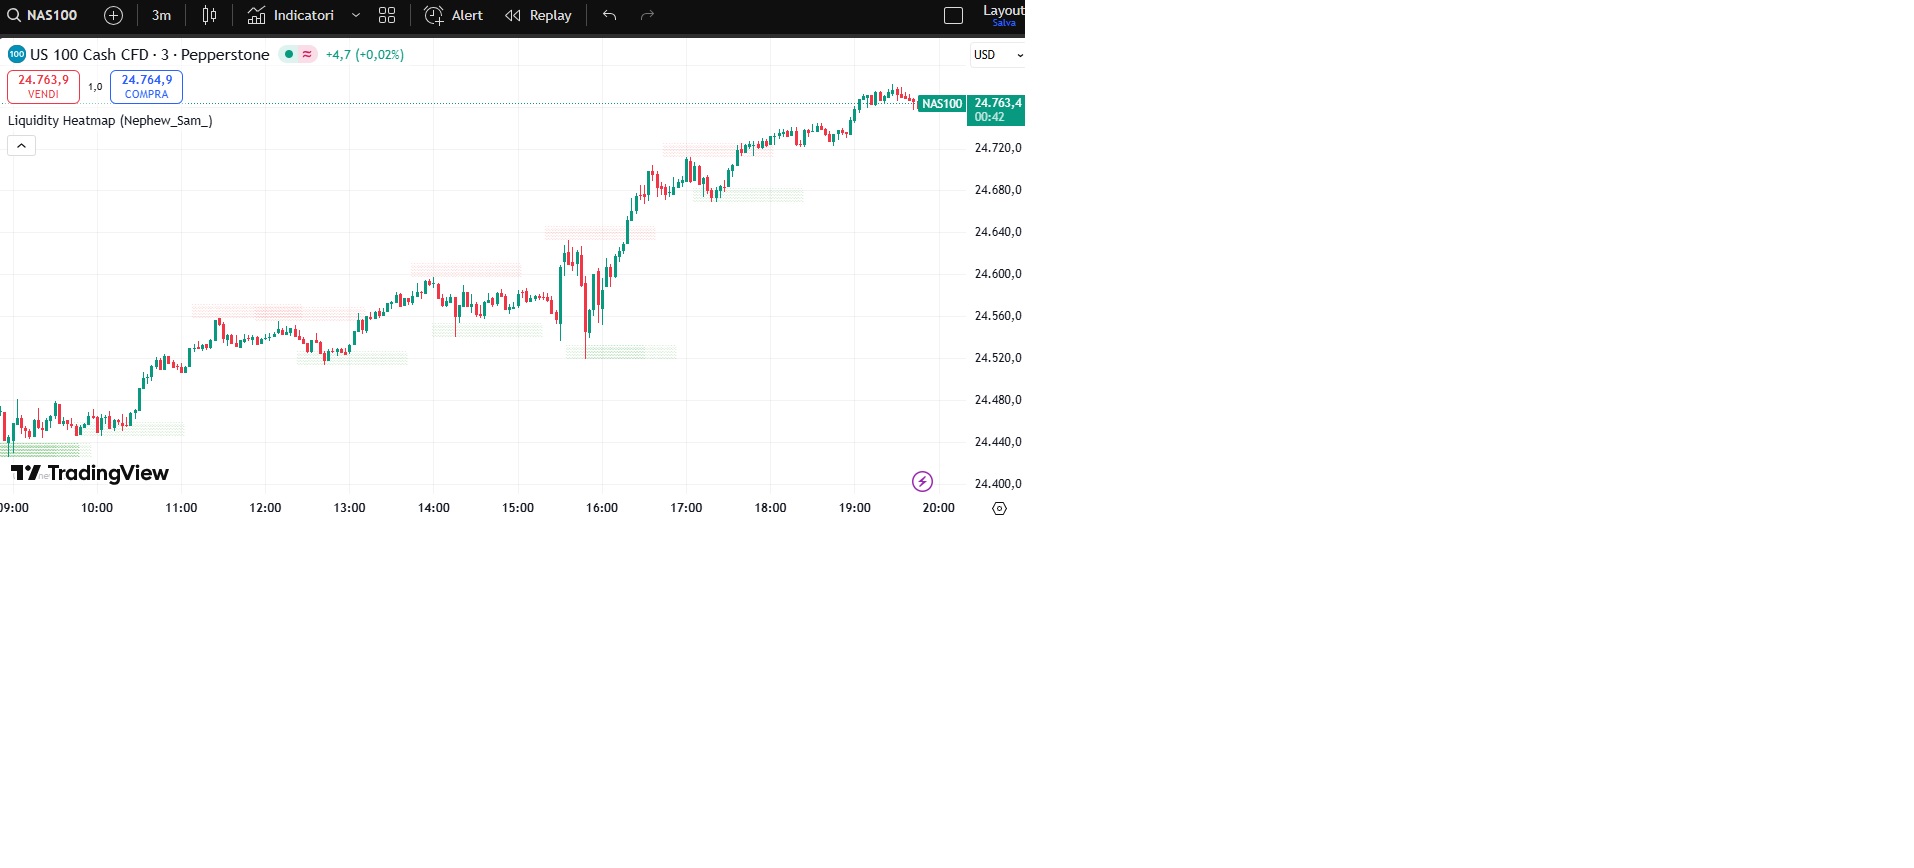
// © Nephew_Sam_
//@version=5
indicator(‘Liquidity Heatmap (Nephew_Sam_)’, overlay=true, max_bars_back=500, max_lines_count=500, max_boxes_count=500, max_labels_count=500)
// ————— INPUTS —————
var GRP1 = “•••••••••• INTRADAY TIMEFRAMES ••••••••••”
// 1
ltimeframe1Show = input.bool(true, title=”, inline=’1′, group=GRP1)
ltimeframe1 = input.timeframe(’15’, title=”, inline=’1′, group=GRP1)
lleftBars1 = input.int(defval=7, title=’Left’, minval=2, maxval=20, group=GRP1, inline=’1′)
lrightBars1 = input.int(defval=7, title=’Right’, minval=2, maxval=20, group=GRP1, inline=’1′, tooltip=”Highest/lowest point in x right and left bars.”)
// 2
ltimeframe2Show = input.bool(true, title=”, inline=’2′, group=GRP1)
ltimeframe2 = input.timeframe(’30’, title=”, inline=’2′, group=GRP1)
lleftBars2 = input.int(defval=7, title=’Left’, minval=2, maxval=20, group=GRP1, inline=’2′)
lrightBars2 = input.int(defval=7, title=’Right’, minval=2, maxval=20, group=GRP1, inline=’2′, tooltip=”Highest/lowest point in x right and left bars.”)
// 3
ltimeframe3Show = input.bool(true, title=”, inline=’3′, group=GRP1)
ltimeframe3 = input.timeframe(’60’, title=”, inline=’3′, group=GRP1)
lleftBars3 = input.int(defval=7, title=’Left’, minval=2, maxval=20, group=GRP1, inline=’3′)
lrightBars3 = input.int(defval=6, title=’Right’, minval=2, maxval=20, group=GRP1, inline=’3′, tooltip=”Highest/lowest point in x right and left bars.”)
// 4
ltimeframe4Show = input.bool(true, title=”, inline=’4′, group=GRP1)
ltimeframe4 = input.timeframe(‘120′, title=”, inline=’4’, group=GRP1)
lleftBars4 = input.int(defval=7, title=’Left’, minval=2, maxval=20, group=GRP1, inline=’4′)
lrightBars4 = input.int(defval=6, title=’Right’, minval=2, maxval=20, group=GRP1, inline=’4′, tooltip=”Highest/lowest point in x right and left bars.”)
// 5
ltimeframe5Show = input.bool(true, title=”, inline=’5′, group=GRP1)
ltimeframe5 = input.timeframe(‘240′, title=”, inline=’5’, group=GRP1)
lleftBars5 = input.int(defval=6, title=’Left’, minval=2, maxval=20, group=GRP1, inline=’5′)
lrightBars5 = input.int(defval=6, title=’Right’, minval=2, maxval=20, group=GRP1, inline=’5′, tooltip=”Highest/lowest point in x right and left bars.”)
// 6
ltimeframe6Show = input.bool(true, title=”, inline=’6′, group=GRP1)
ltimeframe6 = input.timeframe(‘D’, title=”, inline=’6′, group=GRP1)
lleftBars6 = input.int(defval=5, title=’Left’, minval=2, maxval=20, group=GRP1, inline=’6′)
lrightBars6 = input.int(defval=5, title=’Right’, minval=2, maxval=20, group=GRP1, inline=’6′, tooltip=”Highest/lowest point in x right and left bars.”)
var GRP2 = “•••••••••• HIGHER TIMEFRAMES (> 4HR) ••••••••••”
// 1
htimeframe1Show = input.bool(true, title=”, inline=’1′, group=GRP2)
htimeframe1 = input.timeframe(‘480′, title=”, inline=’1’, group=GRP2)
hleftBars1 = input.int(defval=7, title=’Left’, minval=2, maxval=20, group=GRP2, inline=’1′)
hrightBars1 = input.int(defval=7, title=’Right’, minval=2, maxval=20, group=GRP2, inline=’1′, tooltip=”Highest/lowest point in x right and left bars.”)
// 2
htimeframe2Show = input.bool(true, title=”, inline=’2′, group=GRP2)
htimeframe2 = input.timeframe(‘D’, title=”, inline=’2′, group=GRP2)
hleftBars2 = input.int(defval=7, title=’Left’, minval=2, maxval=20, group=GRP2, inline=’2′)
hrightBars2 = input.int(defval=7, title=’Right’, minval=2, maxval=20, group=GRP2, inline=’2′, tooltip=”Highest/lowest point in x right and left bars.”)
// 3
htimeframe3Show = input.bool(true, title=”, inline=’3′, group=GRP2)
htimeframe3 = input.timeframe(‘3D’, title=”, inline=’3′, group=GRP2)
hleftBars3 = input.int(defval=7, title=’Left’, minval=2, maxval=20, group=GRP2, inline=’3′)
hrightBars3 = input.int(defval=6, title=’Right’, minval=2, maxval=20, group=GRP2, inline=’3′, tooltip=”Highest/lowest point in x right and left bars.”)
// 4
htimeframe4Show = input.bool(true, title=”, inline=’4′, group=GRP2)
htimeframe4 = input.timeframe(‘W’, title=”, inline=’4′, group=GRP2)
hleftBars4 = input.int(defval=7, title=’Left’, minval=2, maxval=20, group=GRP2, inline=’4′)
hrightBars4 = input.int(defval=6, title=’Right’, minval=2, maxval=20, group=GRP2, inline=’4′, tooltip=”Highest/lowest point in x right and left bars.”)
// 5
htimeframe5Show = input.bool(true, title=”, inline=’5′, group=GRP2)
htimeframe5 = input.timeframe(‘M’, title=”, inline=’5′, group=GRP2)
hleftBars5 = input.int(defval=6, title=’Left’, minval=2, maxval=20, group=GRP2, inline=’5′)
hrightBars5 = input.int(defval=6, title=’Right’, minval=2, maxval=20, group=GRP2, inline=’5′, tooltip=”Highest/lowest point in x right and left bars.”)
// 6
htimeframe6Show = input.bool(false, title=”, inline=’6′, group=GRP2)
htimeframe6 = input.timeframe(‘2M’, title=”, inline=’6′, group=GRP2)
hleftBars6 = input.int(defval=5, title=’Left’, minval=2, maxval=20, group=GRP2, inline=’6′)
hrightBars6 = input.int(defval=5, title=’Right’, minval=2, maxval=20, group=GRP2, inline=’6′, tooltip=”Highest/lowest point in x right and left bars.”)
var GRP3 = “•••••••••• Other Settings ••••••••••”
hideLTF = input.bool(true, “Hide lines lower than enabled timeframes?”, group = GRP3)
// ————— INPUTS —————
// ————— COLORS AND LENGTH —————
topColor1 = color.new(color.red, 70)
bottomColor1 = color.new(color.green, 70)
lineLength1 = 6
topColor2 = color.new(color.red, 60)
bottomColor2 = color.new(color.green, 60)
lineLength2 = 10
topColor3 = color.new(color.red, 50)
bottomColor3 = color.new(color.green, 50)
lineLength3 = 10
topColor4 = color.new(color.red, 40)
bottomColor4 = color.new(color.green, 40)
lineLength4 = 10
topColor5 = color.new(color.red, 30)
bottomColor5 = color.new(color.green, 30)
lineLength5 = 15
topColor6 = color.new(color.red, 20)
bottomColor6 = color.new(color.green, 20)
lineLength6 = 15
// ————— COLORS AND LENGTH —————
// ————— FUNCTIONS —————
getPivotData(lb, rb) =>
ph = ta.pivothigh(lb, rb)
phtimestart = ph ? time[rb-1] : na
pl = ta.pivotlow(lb, rb)
pltimestart = pl ? time[rb-1] : na
[ph, phtimestart, pl, pltimestart]
getLineStyle(_style) =>
_linestyle = _style == “Solid” ? line.style_solid : _style == “Dashed” ? line.style_dashed : line.style_dotted
_linestyle
resolutionInMinutes(tf = “”) =>
chartTf = timeframe.multiplier * (timeframe.isseconds ? 1. / 60 : timeframe.isminutes ? 1. : timeframe.isdaily ? 60. * 24 : timeframe.isweekly ? 60. * 24 * 7 : timeframe.ismonthly ? 60. * 24 * 30.4375 : na)
float result = tf == “” ? chartTf : request.security(syminfo.tickerid, tf, chartTf)
f_timeFrom(length, _units) =>
int _timeFrom = na
_unit = str.replace_all(_units, ‘s’, ”)
_timeFrom := int(time + resolutionInMinutes() * 60 * 1000 * length)
_timeFrom
notLowerTimeframe(tf) =>
_cond = hideLTF ? resolutionInMinutes() < resolutionInMinutes(tf) : true
_cond
// ▓ ▒ ░ ░
generateText(_n = 5, _large = false) =>
_symbol = “░”
_text = “”
for i = _n to 0
_text := _text + ” “
for i = _n to 0
_text := _text + _symbol
if _large
_text := _text + “\n” + _text
_text
// ————— FUNCTIONS —————
isLtf = resolutionInMinutes() < resolutionInMinutes(“240”)
// ————— Calculate Pivots —————
[phchart, phtimestartchart, plchart, pltimestartchart] = request.security(syminfo.tickerid, “5”, getPivotData(6, 6), lookahead = barmerge.lookahead_on)
[lph1, lphtimestart1, lpl1, lpltimestart1] = request.security(syminfo.tickerid, ltimeframe1, getPivotData(lleftBars1, lrightBars1), lookahead = barmerge.lookahead_on)
[lph2, lphtimestart2, lpl2, lpltimestart2] = request.security(syminfo.tickerid, ltimeframe2, getPivotData(lleftBars2, lrightBars2), lookahead = barmerge.lookahead_on)
[lph3, lphtimestart3, lpl3, lpltimestart3] = request.security(syminfo.tickerid, ltimeframe3, getPivotData(lleftBars3, lrightBars3), lookahead = barmerge.lookahead_on)
[lph4, lphtimestart4, lpl4, lpltimestart4] = request.security(syminfo.tickerid, ltimeframe4, getPivotData(lleftBars4, lrightBars4), lookahead = barmerge.lookahead_on)
[lph5, lphtimestart5, lpl5, lpltimestart5] = request.security(syminfo.tickerid, ltimeframe5, getPivotData(lleftBars5, lrightBars5), lookahead = barmerge.lookahead_on)
[lph6, lphtimestart6, lpl6, lpltimestart6] = request.security(syminfo.tickerid, ltimeframe6, getPivotData(lleftBars6, lrightBars6), lookahead = barmerge.lookahead_on)
[hph1, hphtimestart1, hpl1, hpltimestart1] = request.security(syminfo.tickerid, htimeframe1, getPivotData(hleftBars1, hrightBars1), lookahead = barmerge.lookahead_on)
[hph2, hphtimestart2, hpl2, hpltimestart2] = request.security(syminfo.tickerid, htimeframe2, getPivotData(hleftBars2, hrightBars2), lookahead = barmerge.lookahead_on)
[hph3, hphtimestart3, hpl3, hpltimestart3] = request.security(syminfo.tickerid, htimeframe3, getPivotData(hleftBars3, hrightBars3), lookahead = barmerge.lookahead_on)
[hph4, hphtimestart4, hpl4, hpltimestart4] = request.security(syminfo.tickerid, htimeframe4, getPivotData(hleftBars4, hrightBars4), lookahead = barmerge.lookahead_on)
[hph5, hphtimestart5, hpl5, hpltimestart5] = request.security(syminfo.tickerid, htimeframe5, getPivotData(hleftBars5, hrightBars5), lookahead = barmerge.lookahead_on)
[hph6, hphtimestart6, hpl6, hpltimestart6] = request.security(syminfo.tickerid, htimeframe6, getPivotData(hleftBars6, hrightBars6), lookahead = barmerge.lookahead_on)
ph1 = isLtf ? lph1 : hph1
phtimestart1 = isLtf ? lphtimestart1 : hphtimestart1
pl1 = isLtf ? lpl1 : hpl1
pltimestart1 = isLtf ? lpltimestart1 : hpltimestart1
ph2 = isLtf ? lph2 : hph2
phtimestart2 = isLtf ? lphtimestart2 : hphtimestart2
pl2 = isLtf ? lpl2 : hpl2
pltimestart2 = isLtf ? lpltimestart2 : hpltimestart2
ph3 = isLtf ? lph3 : hph3
phtimestart3 = isLtf ? lphtimestart3 : hphtimestart3
pl3 = isLtf ? lpl3 : hpl3
pltimestart3 = isLtf ? lpltimestart3 : hpltimestart3
ph4 = isLtf ? lph4 : hph4
phtimestart4 = isLtf ? lphtimestart4 : hphtimestart4
pl4 = isLtf ? lpl4 : hpl4
pltimestart4 = isLtf ? lpltimestart4 : hpltimestart4
ph5 = isLtf ? lph5 : hph5
phtimestart5 = isLtf ? lphtimestart5 : hphtimestart5
pl5 = isLtf ? lpl5 : hpl5
pltimestart5 = isLtf ? lpltimestart5 : hpltimestart5
ph6 = isLtf ? lph6 : hph6
phtimestart6 = isLtf ? lphtimestart6 : hphtimestart6
pl6 = isLtf ? lpl6 : hpl6
pltimestart6 = isLtf ? lpltimestart6 : hpltimestart6
pivothighchart = na(phchart[1]) and phchart ? phchart : na
pivotlowchart = na(plchart[1]) and plchart ? plchart : na
pivothigh1 = na(ph1[1]) and ph1 ? ph1 : na
pivotlow1 = na(pl1[1]) and pl1 ? pl1 : na
pivothigh2 = na(ph2[1]) and ph2 ? ph2 : na
pivotlow2 = na(pl2[1]) and pl2 ? pl2 : na
pivothigh3 = na(ph3[1]) and ph3 ? ph3 : na
pivotlow3 = na(pl3[1]) and pl3 ? pl3 : na
pivothigh4 = na(ph4[1]) and ph4 ? ph4 : na
pivotlow4 = na(pl4[1]) and pl4 ? pl4 : na
pivothigh5 = na(ph5[1]) and ph5 ? ph5 : na
pivotlow5 = na(pl5[1]) and pl5 ? pl5 : na
pivothigh6 = na(ph6[1]) and ph6 ? ph6 : na
pivotlow6 = na(pl6[1]) and pl6 ? pl6 : na
// ————— Calculate Pivots —————
// ————— Add to array —————
var float[] pivothighs1 = array.new_float(0)
var float[] pivotlows1 = array.new_float(0)
var float[] pivothighs2 = array.new_float(0)
var float[] pivotlows2 = array.new_float(0)
var float[] pivothighs3 = array.new_float(0)
var float[] pivotlows3 = array.new_float(0)
var float[] pivothighs4 = array.new_float(0)
var float[] pivotlows4 = array.new_float(0)
var float[] pivothighs5 = array.new_float(0)
var float[] pivotlows5 = array.new_float(0)
var float[] pivothighs6 = array.new_float(0)
var float[] pivotlows6 = array.new_float(0)
// ————— Add to array —————
// ————— Plot pivot points —————
// if barstate.islast
// label.new(bar_index, high, str.tostring(resolutionInMinutes()) +”\n”+ str.tostring(resolutionInMinutes(“3”)))
// ONLY LOW TIMEFRAME > 3
showTimeframe1 = isLtf ? ltimeframe1Show : htimeframe1Show
validTimeframe1 = isLtf ? notLowerTimeframe(ltimeframe1) : notLowerTimeframe(htimeframe1)
if showTimeframe1 and pivothighchart and resolutionInMinutes() <= resolutionInMinutes(“3”)
label.new(phtimestartchart, phchart, xloc=xloc.bar_time, text=generateText(12), style=label.style_none, textcolor=topColor1)
if showTimeframe1 and pivotlowchart and resolutionInMinutes() <= resolutionInMinutes(“3”)
label.new(pltimestartchart, plchart, xloc=xloc.bar_time, text=generateText(12), style=label.style_none, textcolor=bottomColor1)
// Timeframe 1
if showTimeframe1 and pivothigh1 and validTimeframe1
label.new(phtimestart1, ph1, xloc=xloc.bar_time, text=generateText(lineLength1), style=label.style_none, textcolor=topColor1)
if showTimeframe1 and pivotlow1 and validTimeframe1
label.new(pltimestart1, pl1, xloc=xloc.bar_time, text=generateText(lineLength1), style=label.style_none, textcolor=bottomColor1)
// Timeframe 2
showTimeframe2 = isLtf ? ltimeframe2Show : htimeframe2Show
validTimeframe2 = isLtf ? notLowerTimeframe(ltimeframe2) : notLowerTimeframe(htimeframe2)
if showTimeframe2 and pivothigh2 and validTimeframe2
label.new(phtimestart2, ph2, xloc=xloc.bar_time, text=generateText(lineLength2), style=label.style_none, textcolor=topColor2)
if showTimeframe2 and pivotlow2 and validTimeframe2
label.new(pltimestart2, pl2, xloc=xloc.bar_time, text=generateText(lineLength2), style=label.style_none, textcolor=bottomColor2)
// Timeframe 3
showTimeframe3 = isLtf ? ltimeframe3Show : htimeframe3Show
validTimeframe3 = isLtf ? notLowerTimeframe(ltimeframe3) : notLowerTimeframe(htimeframe3)
if showTimeframe3 and pivothigh3 and validTimeframe3
label.new(phtimestart3, ph3, xloc=xloc.bar_time, text=generateText(lineLength3), style=label.style_none, textcolor=topColor3)
if showTimeframe3 and pivotlow3 and validTimeframe3
label.new(pltimestart3, pl3, xloc=xloc.bar_time, text=generateText(lineLength3), style=label.style_none, textcolor=bottomColor3)
// Timeframe 4
showTimeframe4 = isLtf ? ltimeframe4Show : htimeframe4Show
validTimeframe4 = isLtf ? notLowerTimeframe(ltimeframe4) : notLowerTimeframe(htimeframe4)
if showTimeframe4 and pivothigh4 and validTimeframe4
label.new(phtimestart4, ph4, xloc=xloc.bar_time, text=generateText(lineLength4), style=label.style_none, textcolor=topColor4)
if showTimeframe4 and pivotlow4 and validTimeframe4
label.new(pltimestart4, pl4, xloc=xloc.bar_time, text=generateText(lineLength4), style=label.style_none, textcolor=bottomColor4)
// Timeframe 5
showTimeframe5 = isLtf ? ltimeframe5Show : htimeframe5Show
validTimeframe5 = isLtf ? notLowerTimeframe(ltimeframe5) : notLowerTimeframe(htimeframe5)
if showTimeframe5 and pivothigh5 and validTimeframe5
label.new(phtimestart5, ph5, xloc=xloc.bar_time, text=generateText(lineLength5, true), style=label.style_none, textcolor=topColor5)
if showTimeframe5 and pivotlow5 and validTimeframe5
label.new(pltimestart5, pl5, xloc=xloc.bar_time, text=generateText(lineLength5, true), style=label.style_none, textcolor=bottomColor5)
// Timeframe 6
showTimeframe6 = isLtf ? ltimeframe6Show : htimeframe6Show
validTimeframe6 = isLtf ? notLowerTimeframe(ltimeframe6) : notLowerTimeframe(htimeframe6)
if showTimeframe6 and pivothigh6 and validTimeframe6
label.new(phtimestart6, ph6, xloc=xloc.bar_time, text=generateText(lineLength6, true), style=label.style_none, textcolor=topColor6)
if showTimeframe6 and pivotlow6 and validTimeframe6
label.new(pltimestart6, pl6, xloc=xloc.bar_time, text=generateText(lineLength6, true), style=label.style_none, textcolor=bottomColor6)
// ————— Plot pivot points —————
// ————— Equal highs —————
// WATERMARK
if barstate.islast
_table = table.new(“bottom_left”, 1, 1)
table.cell(_table, 0, 0, text=”@Nephew_Sam_”, text_size=size.small, text_color=color.new(color.gray, 50))