PLEASE CON VERT vSI VOL X FROM TRADDING VIEW

Viewing 8 posts - 1 through 8 (of 8 total)
  • Author
    Posts
  • #244079 quote
    Patrick K Templar
    Participant
    Average
    // VSI-Input ======================================================================================= //
    
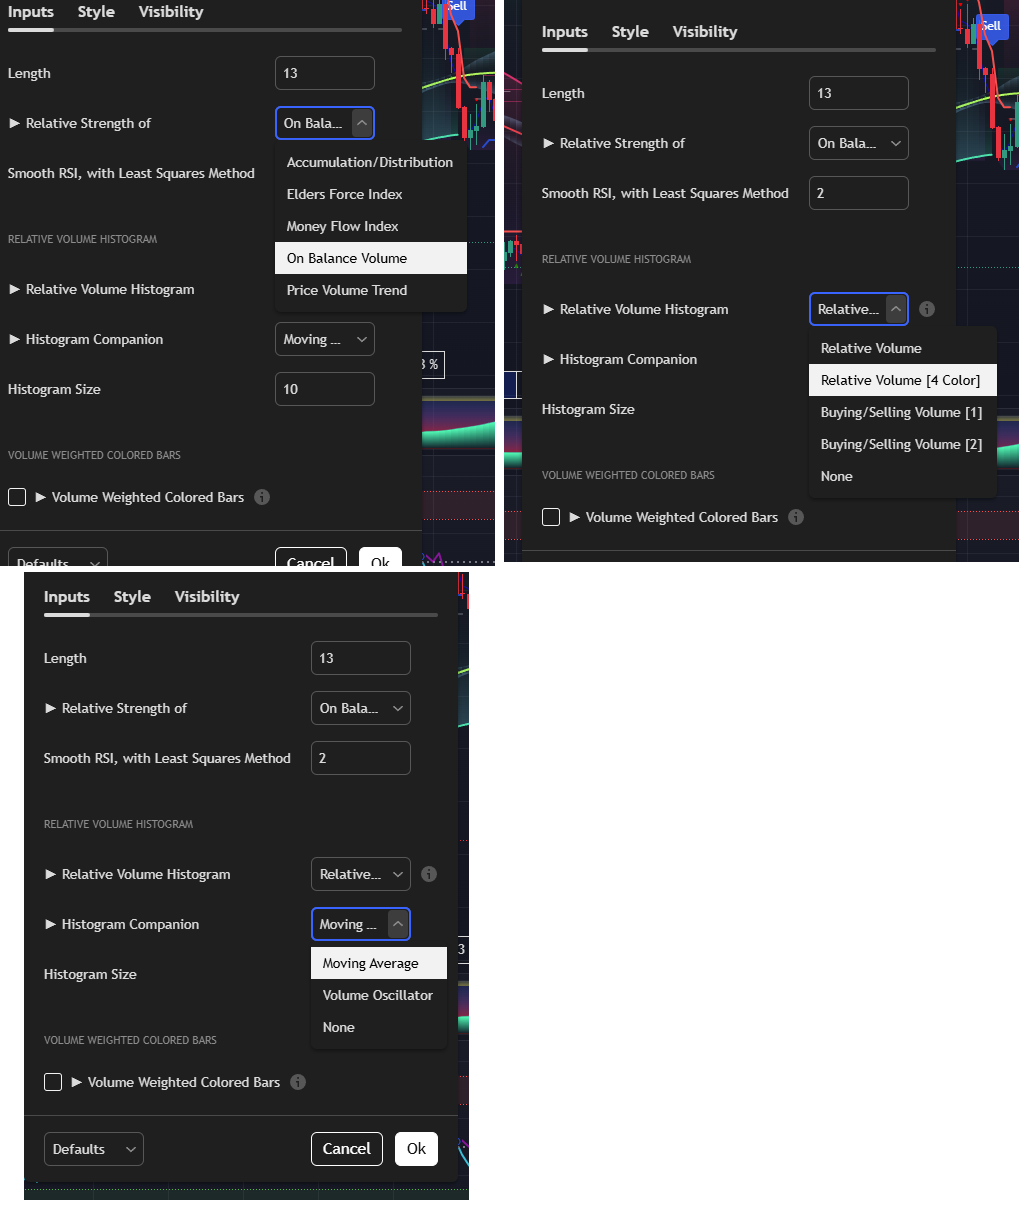
    length = input.int(13, minval=1, title='Length')
    
    // Relative Strength application on Volume Indicators
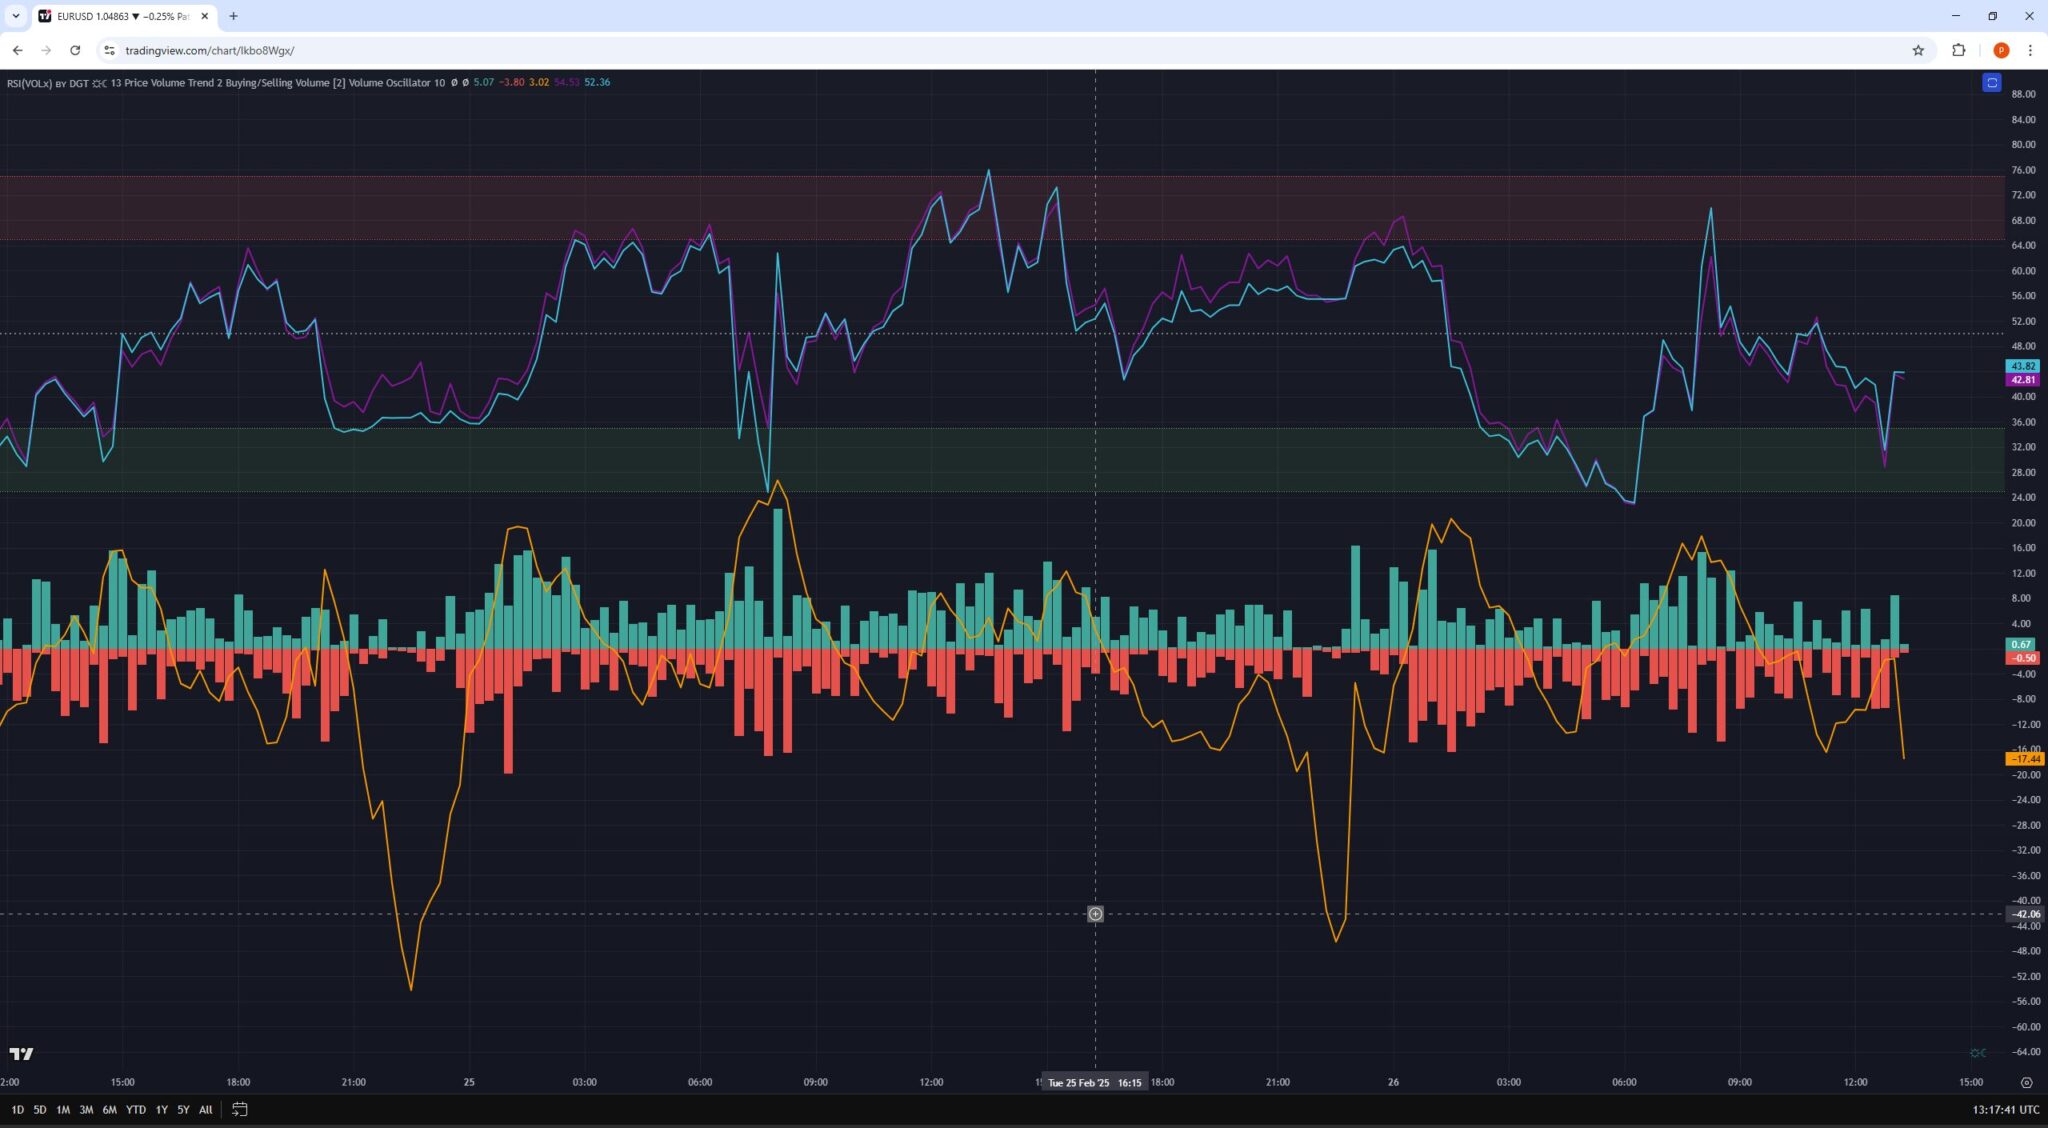
    addRsiX = input.string('On Balance Volume', '► Relative Strength of', options=['Accumulation/Distribution', 'Elders Force Index', 'Money Flow Index', 'On Balance Volume', 'Price Volume Trend'])
    smooth  = input.int(2, 'Smooth RSI, with Least Squares Method', minval=2)
    
    // Volume Histogram
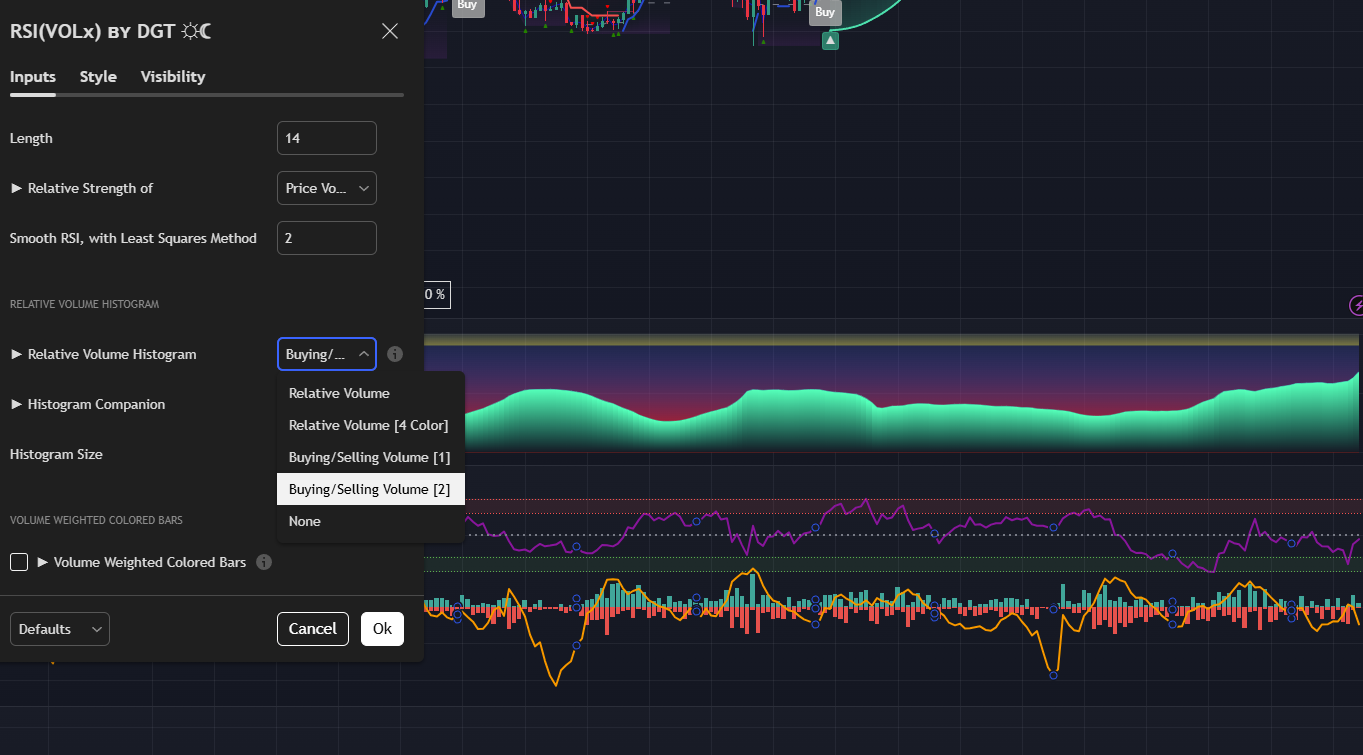
    group_hist='Relative Volume Histogram'
    tp_rvol  = 'Relative Volume (RVOL) compares current volume levels to average volume levels over a specified look-back period. \nRVOL = CurrentVolume / AverageVolume'
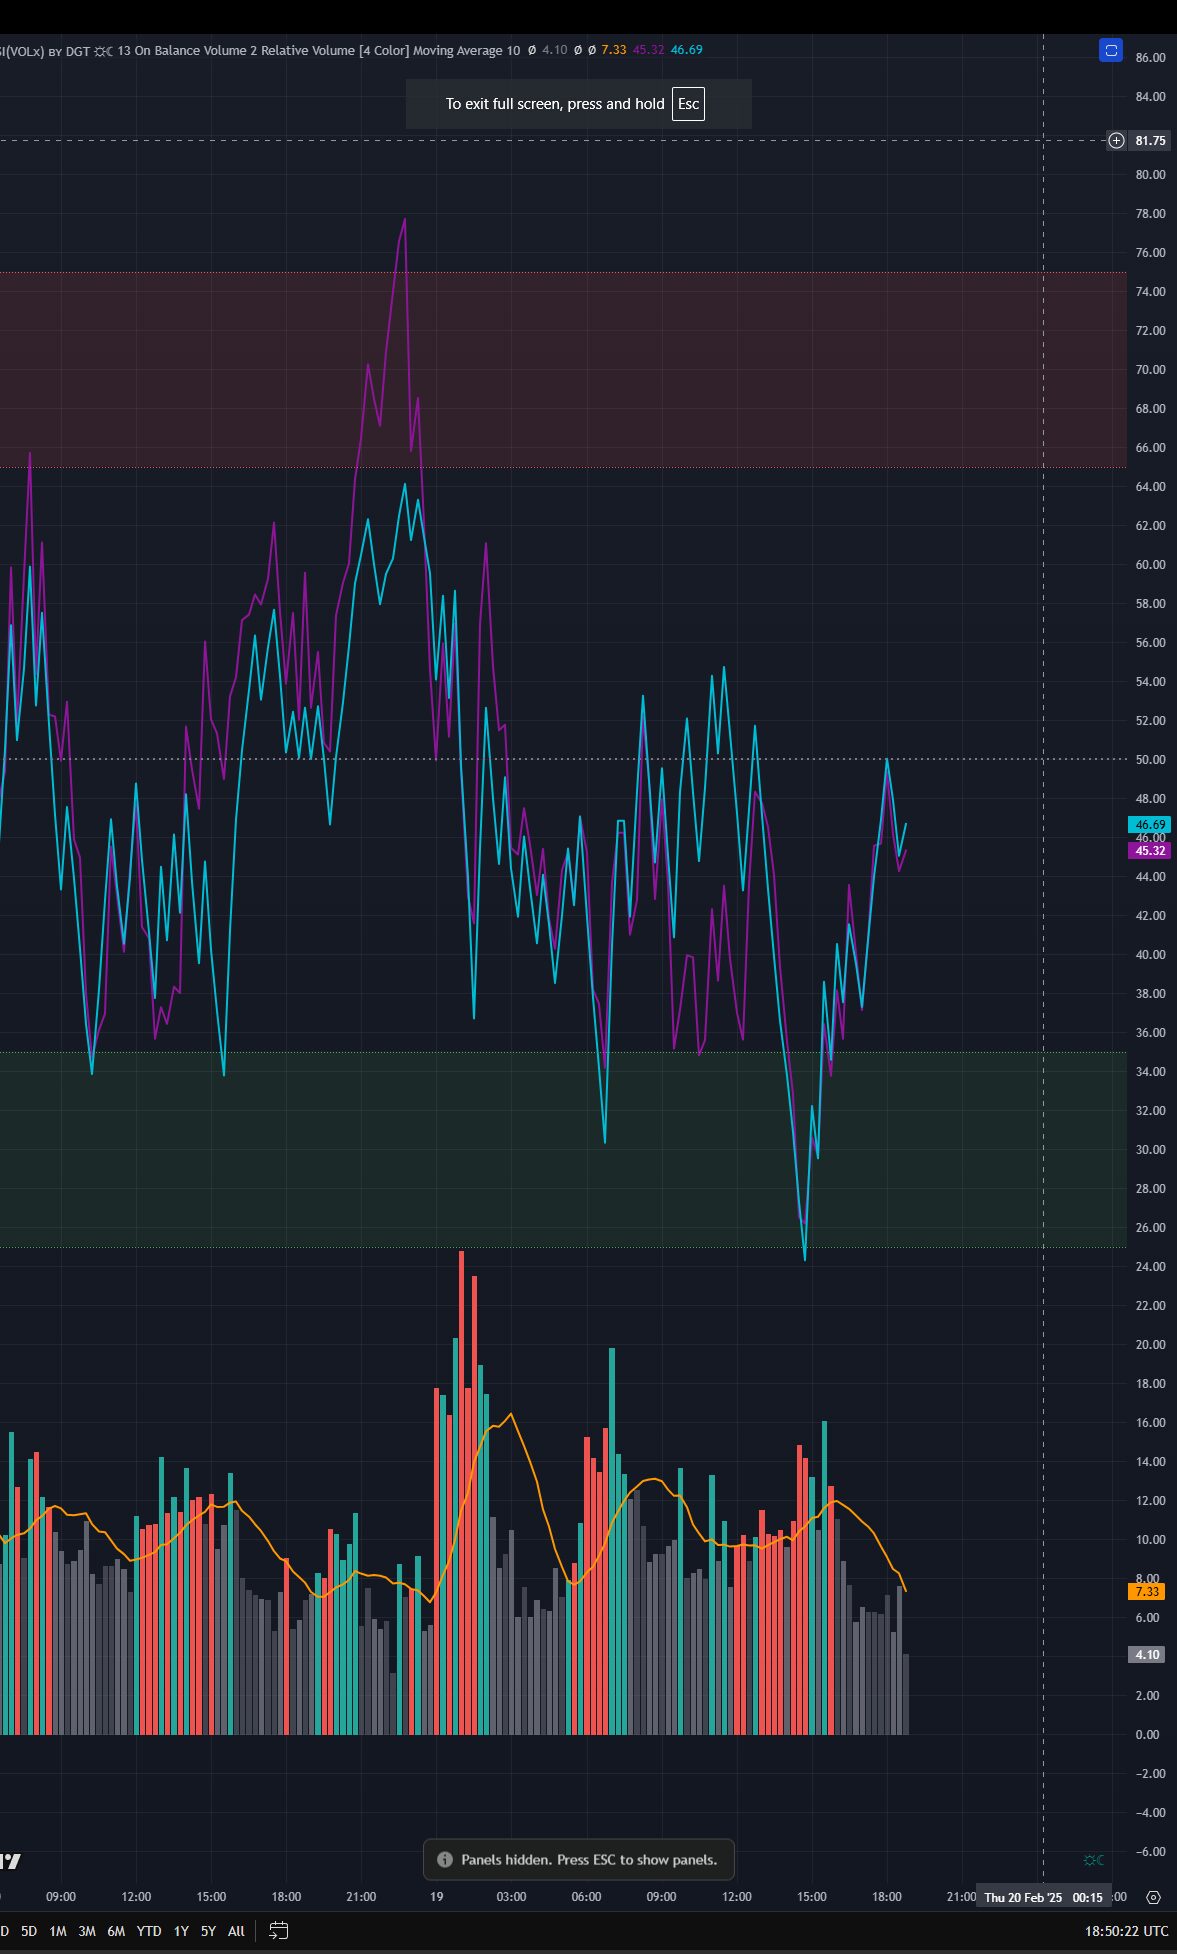
    volHist = input.string('Relative Volume [4 Color]', '► Relative Volume Histogram', options=['Relative Volume', 'Relative Volume [4 Color]', 'Buying/Selling Volume [1]', 'Buying/Selling Volume [2]', 'None'], group = group_hist, tooltip = tp_rvol)
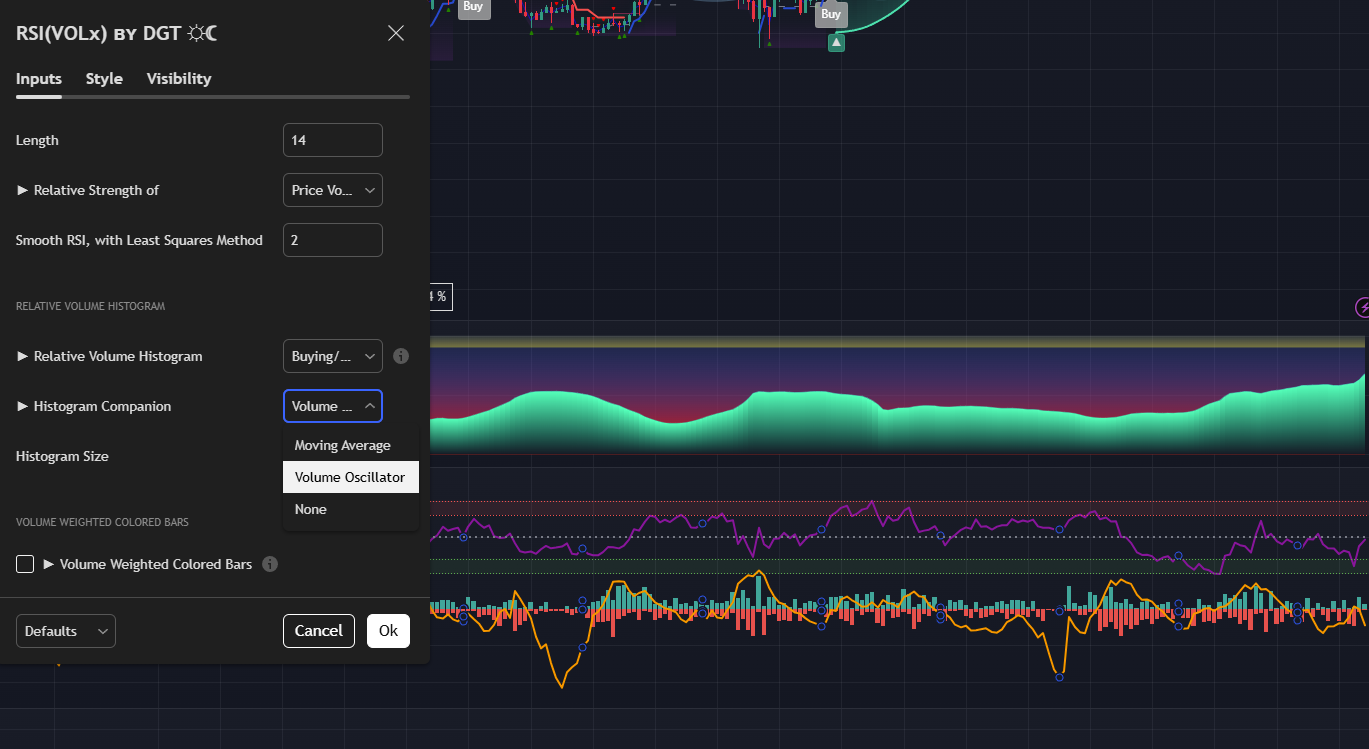
    volComp = input.string('Volume Oscillator', '► Histogram Companion', options=['Moving Average', 'Volume Oscillator', 'None'], group = group_hist)
    size    = input(10, 'Histogram Size', group = group_hist)
    
    // Volume Based Colored Bars
    vbcb = input(true, title='► Volume Weighted Colored Bars', group='Volume Weighted Colored Bars', tooltip='Colors bars based on the bar\'s volume relative to volume moving average')
    
    
    // -Calculation ================================================================================= //
    
    nzVolume = nz(volume)
    O = open, H = high, L = low, C = close
    
    // RSI
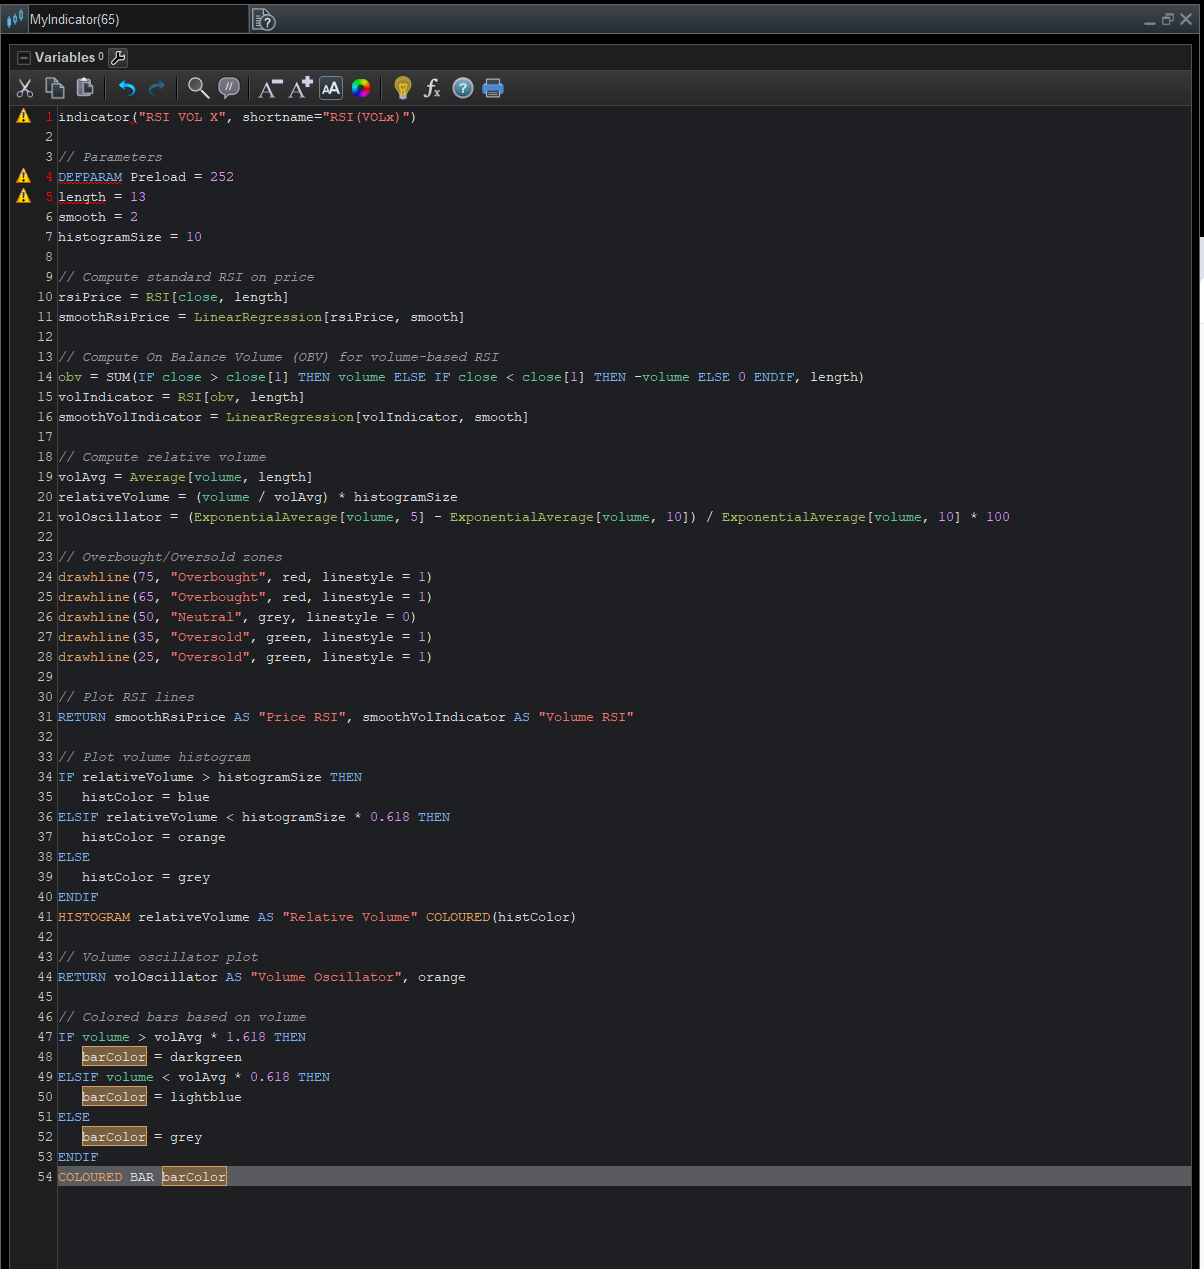
    rsi  = ta.rsi(C, length)
    srsi = ta.linreg(rsi, smooth, 0)
    
    float rsix = switch addRsiX
    	'Accumulation/Distribution' => ta.rsi(ta.cum(C == H and C == L or H == L ? 0 : (2 * C - L - H) / (H - L) * nzVolume), length)
    	'Elders Force Index' => ta.rsi(ta.ema(ta.change(C) * nzVolume, length), length)
    	'Money Flow Index' => 100.0 - 100.0 / (1.0 + math.sum(nzVolume * (ta.change(hlc3) <= 0 ? 0 : hlc3), length) / math.sum(nzVolume * (ta.change(hlc3) >= 0 ? 0 : hlc3), length))
    	'On Balance Volume' => ta.rsi(ta.cum(math.sign(ta.change(C)) * nzVolume), length)
    	'Price Volume Trend' => ta.rsi(ta.cum(ta.change(C) / C[1] * nzVolume), length)
    
    srsix = ta.linreg(rsix, smooth, 0)
    
    // Volume Histogram
    vAvg  = ta.sma(nzVolume, length)
    rvAvg = ta.sma(nzVolume / vAvg * size, length)
    B = nzVolume * (C - L) / (H - L) / vAvg * size
    S = nzVolume * (H - C) / (H - L) / vAvg * size
    
    // Histogram Companion
    volx = switch volComp
    	'Moving Average' => rvAvg//ta.sma(nzVolume / vAvg * size, length)
    	'Volume Oscillator' => (ta.ema(nzVolume, 5) - ta.ema(nzVolume, 10)) / ta.ema(nzVolume, 10) * 100
    
    // -Plot ======================================================================================== //
    // Volume Histogram
    plot(nzVolume and volHist == 'Relative Volume' ? nzVolume / vAvg * size : na, 'Volume, normalized to fit the Scale', 
         O > C ? color.new(#ef5350, 0) : color.new(#26a69a, 0), style=plot.style_columns, editable=false)
    plot(nzVolume and volHist == 'Relative Volume [4 Color]' ? nzVolume / vAvg * size : na, 'Volume, normalized to fit the Scale', 
         O > C ? nzVolume / vAvg * math.abs(size) > math.abs(rvAvg) ? color.new(#ef5350, 0) : color.new(color.gray, 25) : 
                 nzVolume / vAvg * math.abs(size) > math.abs(rvAvg) ? color.new(#26a69a, 0) : color.new(color.gray, 55), style=plot.style_columns, editable=false)
    plot(nzVolume and (volHist == 'Buying/Selling Volume [1]' or volHist == 'Buying/Selling Volume [2]') ? volHist == 'Buying/Selling Volume [1]' ? S + B  : B : na, 'Total/Buying Volume' , color.new(#26a69a, 0) , style=plot.style_columns, editable=false)
    plot(nzVolume and (volHist == 'Buying/Selling Volume [1]' or volHist == 'Buying/Selling Volume [2]') ? volHist == 'Buying/Selling Volume [1]' ? S : -S     : na, 'Selling Volume'      , color.new(#ef5350, 0) , style=plot.style_columns, editable=false)
    
    // Histogram Companion
    plot(nzVolume and volHist != 'None' ? volx : na, 'Volume MA/OCS', color.orange, 2)
    
    // Threshold Lines
    p1 = hline(75, color=color.red, title='Overbought Higher Theshold Level', linestyle=hline.style_dotted)
    p2 = hline(65, color=color.red, title='Overbought Lower Theshold Level' , linestyle=hline.style_dotted)
    fill(p1, p2, color=color.new(color.red, 89), title='Overbought Background')
    
    hline(50, color=color.gray, title='Middle Line (Bull/Bear Border Line)', linestyle=hline.style_dotted, linewidth=2)
    
    p3 = hline(35, color=color.green, title='Oversold Higher Theshold Level', linestyle=hline.style_dotted)
    p4 = hline(25, color=color.green, title='Oversold Lower Theshold Level' , linestyle=hline.style_dotted)
    fill(p3, p4, color=color.new(color.green, 89), title='Oversold Background')
    
    // VSI
    plot(srsi, 'Relative Strength of Price', #8E1599, 2)
    plot(nzVolume ? srsix : na, 'Relative Strength of Volume X', color.aqua, 2)
    
    // Volume Based Colored Bars by KIVANÇ ÖZBİLGİÇ
    barcolor(vbcb and nzVolume ? nzVolume > vAvg * 1.618 ? C > O ? #006400 : #910000 : nzVolume < vAvg * 0.618 ? C > O ? #7FFFD4 : #FF9800 : C > O ? color.green : color.red : na, title='Volume Weighted Colored Bars', editable=false)
    
    var table logo = table.new(position.bottom_right, 1, 1)
    if barstate.islast
        table.cell(logo, 0, 0, '☼☾  ', text_size=size.normal, text_color=color.teal)

    HELLO   COULD PLESES CONVERT FROM TRADDING VIEW WITH THE OPTION SETTING       THANNK YOU

    #244081 quote
    Patrick K Templar
    Participant
    Average

    COULD PLES MAKE SURE  it has the setting  setup with in      plz       here  are pitcures of the setting  thannk you  THANNK YOU

    #244106 quote
    Patrick K Templar
    Participant
    Average

    I HAVER ETRROS     on my try

    DEFPARAM PRELOADBARS = 150
    length = 13
    smooth = 2
    histogramSize = 10
    
    // Compute standard RSI on price
    rsiPrice = RSI[close, length]
    smoothRsiPrice = LinearRegression[rsiPrice, smooth]
    
    // Compute On Balance Volume (OBV) for volume-based RSI
    obv = SUM(IF close > close[1] THEN volume ELSE IF close < close[1] THEN -volume ELSE 0 ENDIF, length)
    volIndicator = RSI[obv, length]
    smoothVolIndicator = LinearRegression[volIndicator, smooth]
    
    // Compute relative volume
    volAvg = Average[volume, length]
    relativeVolume = (volume / volAvg) * histogramSize
    volOscillator = (ExponentialAverage[volume, 5] - ExponentialAverage[volume, 10]) / ExponentialAverage[volume, 10] * 100
    
    // Overbought/Oversold zones
    drawhline(75, "Overbought", red, linestyle = 1)
    drawhline(65, "Overbought", red, linestyle = 1)
    drawhline(50, "Neutral", grey, linestyle = 0)
    drawhline(35, "Oversold", green, linestyle = 1)
    drawhline(25, "Oversold", green, linestyle = 1)
    
    // Plot RSI lines
    RETURN smoothRsiPrice AS "Price RSI", smoothVolIndicator AS "Volume RSI"
    
    // Plot volume histogram
    IF relativeVolume > histogramSize THEN
    histColor = blue
    ELSIF relativeVolume < histogramSize * 0.618 THEN
    histColor = orange
    ELSE
    histColor = grey
    ENDIF
    HISTOGRAM relativeVolume AS "Relative Volume" COLOURED(histColor)
    
    // Volume oscillator plot
    RETURN volOscillator AS "Volume Oscillator", orange
    
    // Colored bars based on volume
    IF volume > volAvg * 1.618 THEN
    barColor = darkgreen
    ELSIF volume < volAvg * 0.618 THEN
    barColor = lightblue
    ELSE
    barColor = grey
    ENDIF
    COLOURED BAR barColor
    #244116 quote
    robertogozzi
    Moderator
    Master

    After the RETURN line there can’t be additional lines, unless they are comments.

    #244117 quote
    robertogozzi
    Moderator
    Master

    But yours is not PRT code, as well.

    #244130 quote
    Patrick K Templar
    Participant
    Average

    im not very good at all at coding     it hurts my brain     but at least i give it a try

    #244133 quote
    Iván González
    Moderator
    Master

    Hi! Here you have the code:

    //------------------------------------------------------//
    // Input
    //------------------------------------------------------//
    length=13 // Length
    addRsiX=1 // Relative Strength of 1=On Balance Volume
    smooth=2 // Smooth RSI
    size= 10 // Histogram size
    volComp=1 // Histogram companion 1=volume oscillator 0=Moving average
    //------------------------------------------------------//
    // RSI 
    //------------------------------------------------------//
    myrsi=rsi[length](close)
    sRsi=LinearRegression[smooth](myrsi)
    
    if addRsiX=1 then
    if close=close[1] then
    src=0
    elsif close>close[1] then
    src=volume
    elsif close<close[1] then
    src=-volume
    endif
    CumSrc=cumsum(src)
    rsix=rsi[length](CumSrc)
    endif
    
    sRsix=LinearRegression[smooth](rsix)
    
    //------------------------------------------------------//
    // Volume Histogram
    //------------------------------------------------------//
    vAvg=average[length](volume)
    rvAvg=average[length](volume*size/vAvg)
    B=volume*(close-low)/(high-low)/vAvg*size
    S=volume*(high-close)/(high-low)/vAvg*size
    if volComp then
    volx=(average[5,1](volume)-average[10,1](volume))/average[10,1](volume)*100
    else
    volx=rvAvg
    endif
    //------------------------------------------------------//
    // Plot
    //------------------------------------------------------//
    volHist=volume/vAvg*size
    if open>close then
    if volume/vAvg*abs(size)>abs(rvAvg) then
    r=239
    g=83
    b=80
    a=255
    else
    r=120
    g=123
    b=134
    a=25
    endif
    else
    if volume/vAvg*abs(size)>abs(rvAvg) then
    r=36
    g=166
    b=154
    a=255
    else
    r=120
    g=123
    b=134
    a=55
    endif
    endif
    //------------------------------------------------------//
    //Overbougth
    drawhline(75)coloured("red")style(dottedline3)
    drawhline(65)coloured("red")style(dottedline3)
    colorbetween(75,65,"red",40)
    // Middle
    drawhline(50)coloured("grey")style(dottedline3)
    
    //OverSold
    drawhline(35)coloured("green")style(dottedline3)
    drawhline(25)coloured("green")style(dottedline3)
    colorbetween(35,25,"green",40)
    //------------------------------------------------------//
    return volHist coloured(r,g,b,a)style(histogram), rvavg coloured("orange"), srsi as "Relative Strength of price" coloured(142,21,153)style(line,2), srsix as "Relative Strength of Volume" coloured(0,188,212)style(line,2)
    robertogozzi and Patrick K Templar thanked this post
    #244377 quote
    Patrick K Templar
    Participant
    Average

    THANNK YOU


    Hello could you kindly just help me with some more settings I’ve showed some photos is due to with the options on the trading view version what makes it very easy to switch between things I’d also like to know how to code this in for future indicators as well so it would be a great place to have a template to go back to as well as I show you the images that you understand basically I think one of the turning the volume into more of an oscillation and I can’t yeah on both the bars and the movering average that goes across I think

Viewing 8 posts - 1 through 8 (of 8 total)
  • You must be logged in to reply to this topic.

PLEASE CON VERT vSI VOL X FROM TRADDING VIEW


ProBuilder: Indicators & Custom Tools

New Reply
Summary

This topic contains 7 replies,
has 3 voices, and was last updated by Patrick K Templar
11 months, 2 weeks ago.

Topic Details
Forum: ProBuilder: Indicators & Custom Tools
Language: English
Started: 02/19/2025
Status: Active
Attachments: 7 files
Logo Logo
Loading...