Bonjour,
Je cherche à intégrer cet indicateur dans PRT.
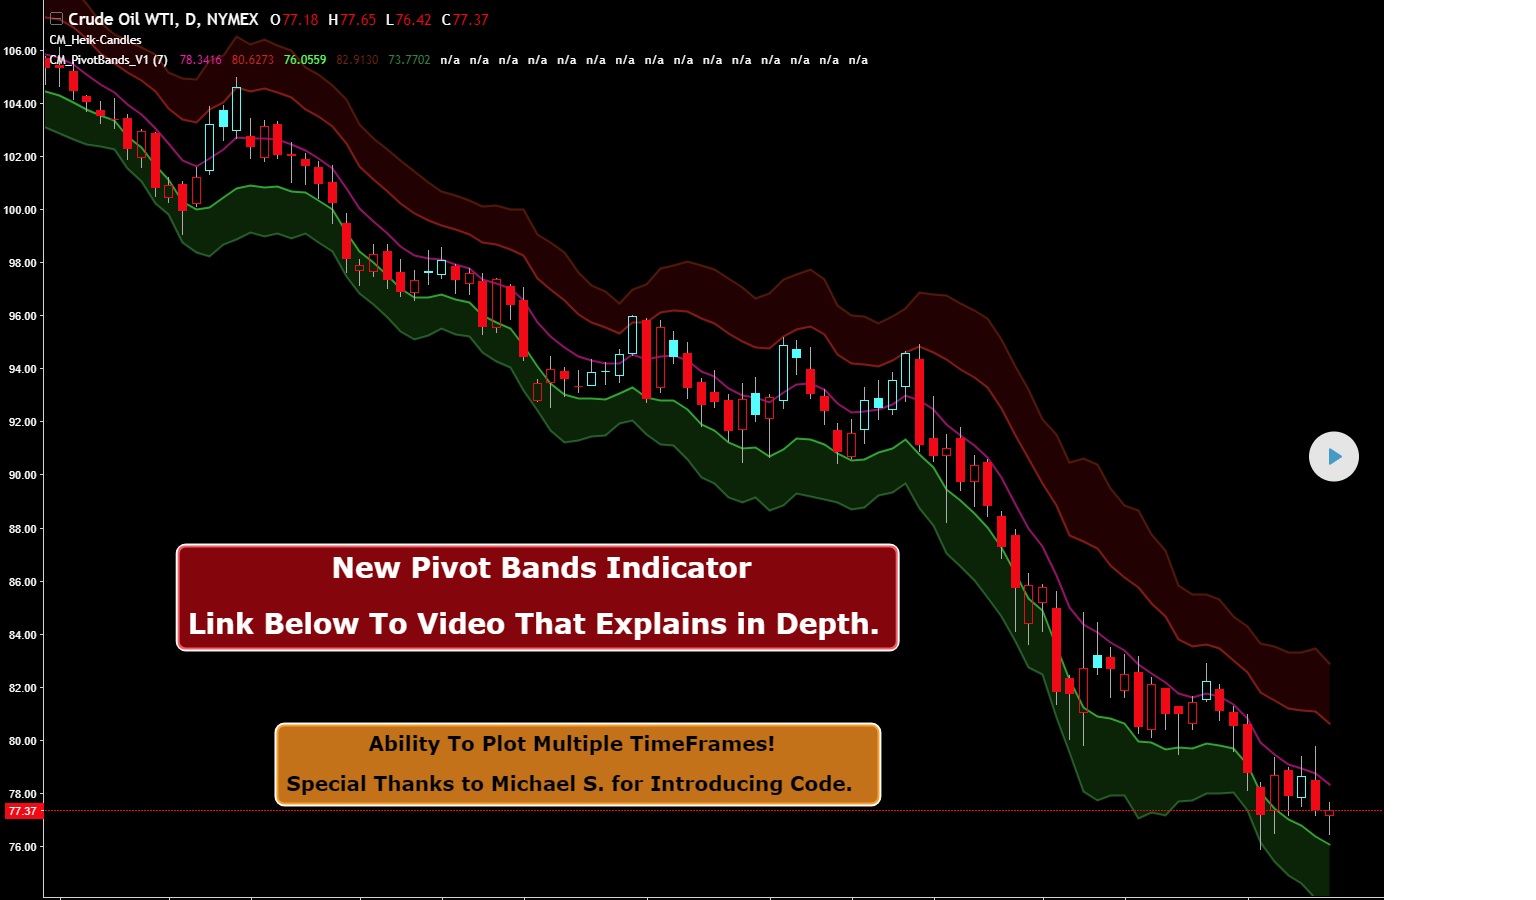
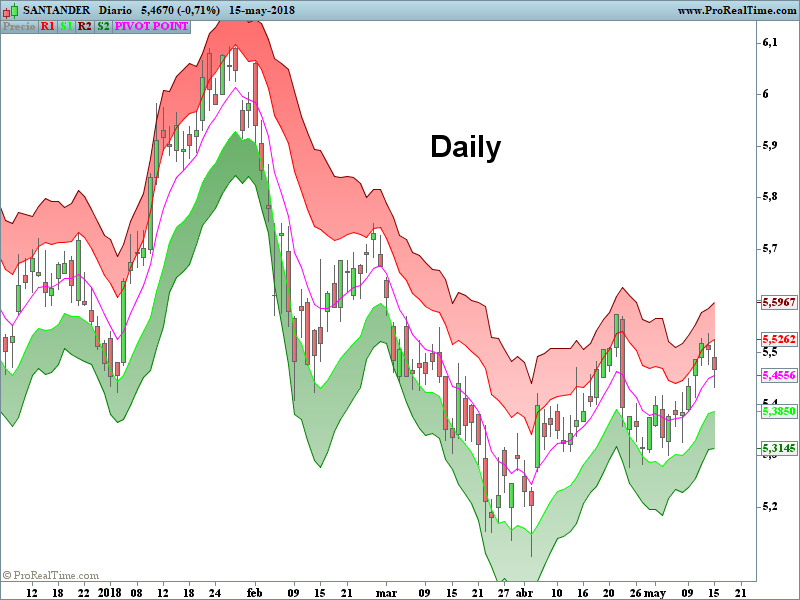
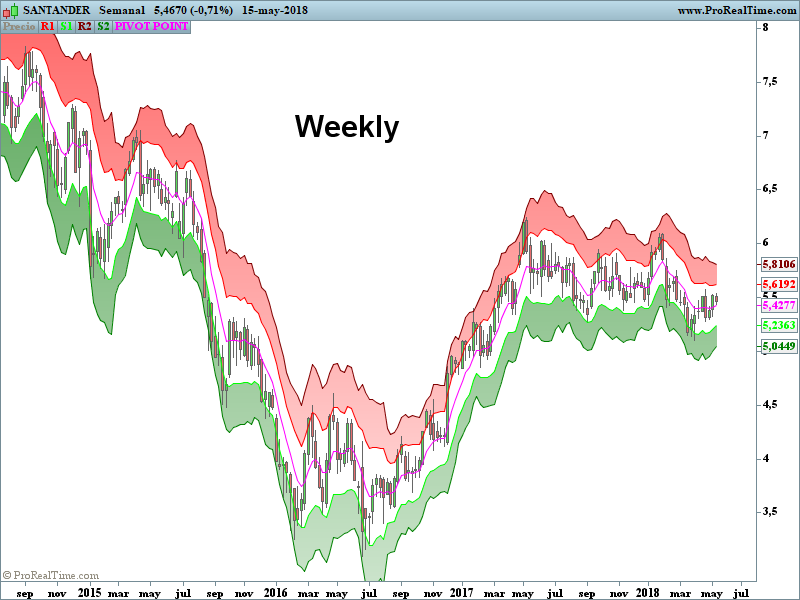
Il a été mis en libre accès par Chris Moods. L’idée originale vient de Joe Duffy.
Cet indicateur identifie les zones qui ont une grande probabilité d’être supports ou résistances. A la différence des autres points pivots, il est plus intuitif, plus visuel, et je le trouve plus efficace .
Maintenant, pour le rentrer dans PRT, c’est une tout autre paire de manche…
Je n’arrive pas à le valider.
Il y a notamment des erreurs de syntaxes dont je ne sais pas par quoi remplacer comme “title” par ex.
Désolé je débute.
Si vous pouviez me donner petit un coup de main, je vous en remercie par avance.
//Created by ChrisMoody 11/11/2014
//Current Timeframe, Daily, Weekly, Monthly Pivot Bands
//Special Thanks to Michael S. For Providing Original Code.
study(title="CM_Pivot Bands V1", shorttitle="CM_PivotBands_V1", overlay=true)
lengthMA=input(7, title="EMA Length To Calculate Bands")
sc = input(true, title="Show Current Chart Timeframe Pivot Bands?")
sd = input(false, title="Show Daily Pivot Bands?")
sw = input(false, title="Show Weekly Pivot Bands?")
sm = input(false, title="Show Monthly Pivot Bands?")

PP = (high + low  + close)/ 3
PPEMA = ema(PP, lengthMA)
HP1 = (PP + (PP-low))
LP1 = (PP - (high-PP))
HP2 = (PP + 2*(PP-low))
LP2 = (PP - 2*(high-PP))

// PPD71 = Difference from HP1 and LP1 for the last 7 days
PPD71 = (((HP1-LP1)+(HP1[1]-LP1[1])+(HP1[2]-LP1[2])+(HP1[3]-LP1[3])+(HP1[4]-LP1[4])+(HP1[5]-LP1[5])+(HP1[6]-LP1[6]))/7)
// PPD72 = Difference from HP2 and LP2 for the last 7 days
PPD72 = (((HP2-LP2)+(HP2[1]-LP2[1])+(HP2[2]-LP2[2])+(HP2[3]-LP2[3])+(HP2[4]-LP2[4])+(HP2[5]-LP2[5])+(HP2[6]-LP2 [6]))/7)

r1 = PPEMA + PPD71
s1 = PPEMA - PPD71
r2 = PPEMA + PPD72
s2 = PPEMA - PPD72

plot(sc and PPEMA ? PPEMA : na, title="Current Timeframe Pivot Point ", style=linebr, linewidth=2, color=fuchsia)
p1=plot(sc and r1 ? r1 : na,   title="Current Timeframe R1", style=linebr, linewidth=2, color=#DC143C)
p2=plot(sc and s1 ? s1 : na, title="Current Timeframe S1", style=linebr, linewidth=2, color=lime)
p3=plot(sc and r2 ? r2 : na, title="Current Timeframe R2", style=linebr, linewidth=2, color=maroon)
p4=plot(sc and s2 ? s2 : na, title="Current Timeframe S2", style=linebr, linewidth=2, color=#228B22)
fill(p1, p3, color=red, transp = 85)
fill(p2, p4, color=lime, transp = 85)

//Daily Pivot Bands
d_PPEMA = security(tickerid, 'D', PPEMA)
d_r1 = security(tickerid, 'D', r1)
d_s1 = security(tickerid, 'D', s1)
d_r2 = security(tickerid, 'D', r2)
d_s2 = security(tickerid, 'D', s2)

plot(sd and d_PPEMA ? d_PPEMA : na, title="Daily Pivot Point ", style=circles, linewidth=2, color=fuchsia)
p11=plot(sd and d_r1 ? d_r1 : na,   title="Daily R1", style=circles, linewidth=2, color=#DC143C)
p12=plot(sd and d_s1 ? d_s1 : na, title="Daily S1", style=circles, linewidth=2, color=lime)
p13=plot(sd and d_r2 ? d_r2 : na, title="Daily R2", style=circles, linewidth=2, color=maroon)
p14=plot(sd and d_s2 ? d_s2 : na, title="Daily S2", style=circles, linewidth=2, color=#228B22)
fill(p11, p13, color=red, transp = 80)
fill(p12, p14, color=lime, transp = 80)

//Weekly Pivot Bands
w_PPEMA = security(tickerid, 'W', PPEMA)
w_r1 = security(tickerid, 'W', r1)
w_s1 = security(tickerid, 'W', s1)
w_r2 = security(tickerid, 'W', r2)
w_s2 = security(tickerid, 'W', s2)

plot(sw and w_PPEMA ? w_PPEMA : na, title="Weekly Pivot Point ", style=linebr, linewidth=4, color=fuchsia)
p21=plot(sw and w_r1 ? w_r1 : na,   title="Weekly R1", style=linebr, linewidth=4, color=#DC143C)
p22=plot(sw and w_s1 ? w_s1 : na, title="Weekly S1", style=linebr, linewidth=4, color=lime)
p23=plot(sw and w_r2 ? w_r2 : na, title="Weekly R2", style=linebr, linewidth=4, color=maroon)
p24=plot(sw and w_s2 ? w_s2 : na, title="Weekly S2", style=linebr, linewidth=4, color=#228B22)
fill(p21, p23, color=red, transp = 75)
fill(p22, p24, color=lime, transp = 75)

//Weekly Pivot Bands
M_PPEMA = security(tickerid, 'M', PPEMA)
M_r1 = security(tickerid, 'M', r1)
M_s1 = security(tickerid, 'M', s1)
M_r2 = security(tickerid, 'M', r2)
M_s2 = security(tickerid, 'M', s2)

plot(sm and w_PPEMA ? M_PPEMA : na, title="Monthly Pivot Point ", style=cross, linewidth=4, color=fuchsia)
p31=plot(sm and M_r1 ? M_r1 : na,   title="Monthly R1", style=cross, linewidth=4, color=#DC143C)
p32=plot(sm and M_s1 ? M_s1 : na, title="Monthly S1", style=cross, linewidth=4, color=lime)
p33=plot(sm and M_r2 ? M_r2 : na, title="Monthly R2", style=cross, linewidth=4, color=maroon)
p34=plot(sm and M_s2 ? M_s2 : na, title="Monthly S2", style=cross, linewidth=4, color=#228B22)
fill(p31, p33, color=red, transp = 70)
fill(p32, p34, color=lime, transp = 70)