Festive greetings everyone. Can someone help please. Have been backtesting daily pivot points – a simple system; buy when close crosses over r1 or r2 and short when close crosses under s1 or s2. What I’m finding is that there are a number of trades that are coming up that don’t fit this criteria – for example a short trade is recorded even though it hasnt crossed s1 or s2 (in fact hasnt crossed anything!). I’m not sure what I’m doing wrong. Any suggestions?
//support level 2
indicator1 = (DHigh(1) + DLow(1) + DClose(1))/3-(DHigh(1)-DLow(1))
c1 = (close CROSSES OVER indicator1)

//support level 1
indicator2 = 2*((DHigh(1) + DLow(1) + DClose(1))/3) - DHigh(1)
c2 = (close CROSSES OVER indicator2)

//resistance level 2
indicator3 = (DHigh(1) + DLow(1) + DClose(1))/3+(DHigh(1)-DLow(1))
c3 = (close CROSSES UNDER indicator3)

//resistance level 1
indicator4 = 2*((DHigh(1) + DLow(1) + DClose(1))/3) - DLow(1)
c4 = (close CROSSES UNDER indicator4)
It depends on how conditions are used when placing the order and at which point, in the strategy, they are used.
If you post your code we might be of some help.
Much obliged Roberto. I’m still playing around with the code. I thought it maybe just something do with how I’m calculating the pivot points. looks like the issue occurs on Mondays. Code still in development:
// Definition of code parameters
DEFPARAM CumulateOrders = False // Cumulating positions deactivated

// Conditions to enter long positions
indicator1 = (DHigh(1) + DLow(1) + DClose(1))/3-(DHigh(1)-DLow(1))
c1 = (close CROSSES OVER indicator1)

IF c1 THEN
BUY 1 PERPOINT AT MARKET
ENDIF

// Conditions to exit long positions
indicator2 = 2*((DHigh(1) + DLow(1) + DClose(1))/3) – DLow(1)
c2 = (close CROSSES OVER indicator2)

IF c2 THEN
SELL AT MARKET
ENDIF

// Conditions to enter short positions
indicator3 = (DHigh(1) + DLow(1) + DClose(1))/3+(DHigh(1)-DLow(1))
c3 = (close CROSSES UNDER indicator3)

IF c3 THEN
SELLSHORT 1 PERPOINT AT MARKET
ENDIF

// Conditions to exit short positions
indicator4 = 2*((DHigh(1) + DLow(1) + DClose(1))/3) – DHigh(1)
c4 = (close CROSSES UNDER indicator4)

IF c4 THEN
EXITSHORT AT MARKET
ENDIF
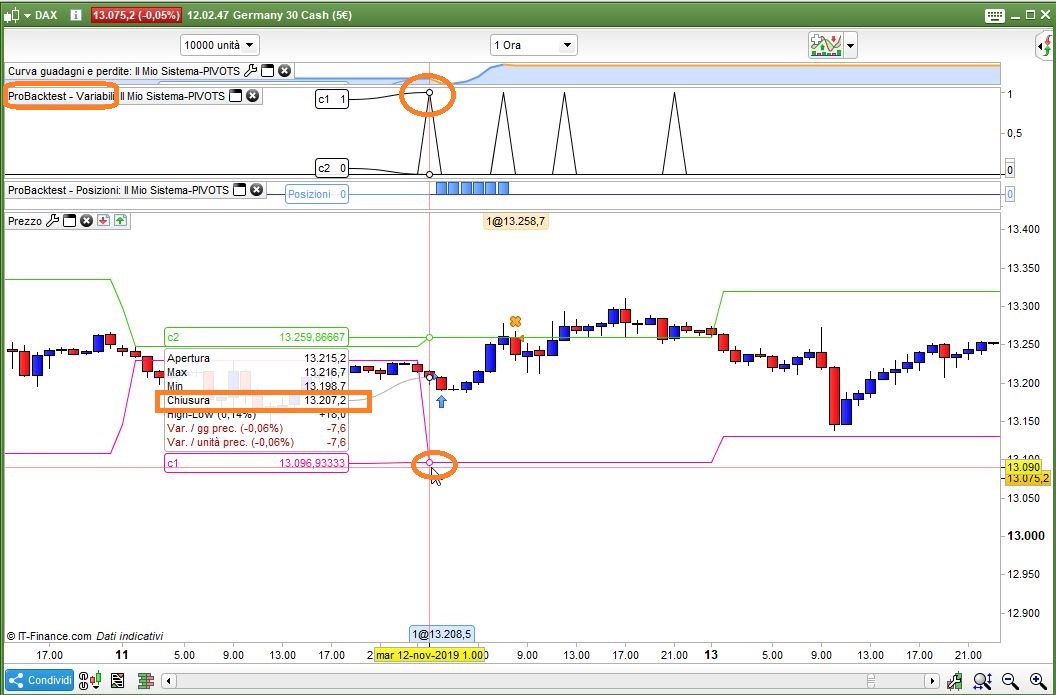
I tried only LONG trades first, and it’s all good. As you can see from the attached pic, on the setup candle (where the mouse is sitting) there was a crossover compared to the previous candle, though it’s almost vertical and not horizontal. All other LONG trades confirm this correct behaviour.
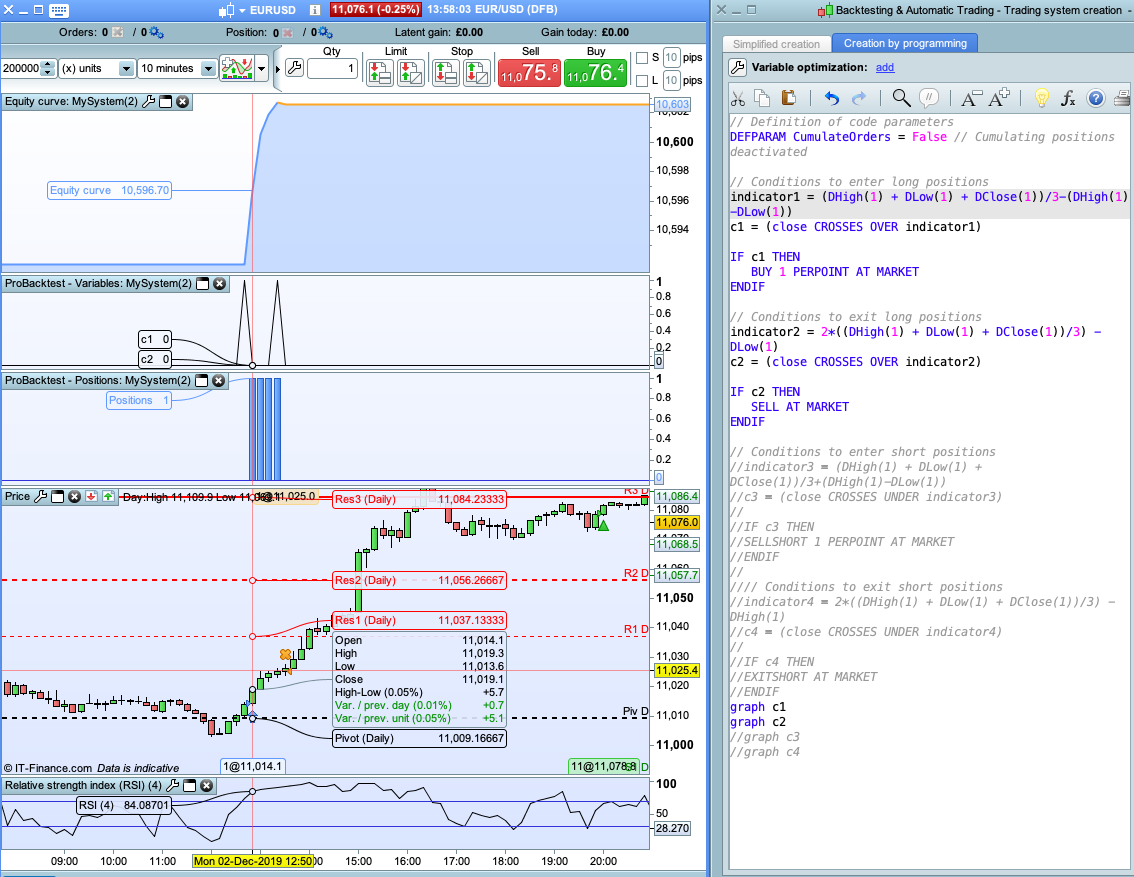
I suggest that you add GRAPH to monitor variables candle by candle, as in my code (slightly modified to enter LONGs only):
// Definition of code parameters
DEFPARAM CumulateOrders = False // Cumulating positions deactivated

// Conditions to enter long positions
indicator1 = (DHigh(1) + DLow(1) + DClose(1))/3-(DHigh(1)-DLow(1))
c1 = (close CROSSES OVER indicator1)

IF c1 THEN
BUY 1 PERPOINT AT MARKET
ENDIF

// Conditions to exit long positions
indicator2 = 2*((DHigh(1) + DLow(1) + DClose(1))/3) - DLow(1)
c2 = (close CROSSES OVER indicator2)

IF c2 THEN
SELL AT MARKET
ENDIF

// Conditions to enter short positions
//indicator3 = (DHigh(1) + DLow(1) + DClose(1))/3+(DHigh(1)-DLow(1))
//c3 = (close CROSSES UNDER indicator3)
//
//IF c3 THEN
//SELLSHORT 1 PERPOINT AT MARKET
//ENDIF
//
//// Conditions to exit short positions
//indicator4 = 2*((DHigh(1) + DLow(1) + DClose(1))/3) - DHigh(1)
//c4 = (close CROSSES UNDER indicator4)
//
//IF c4 THEN
//EXITSHORT AT MARKET
//ENDIF
graph c1
graph c2
//graph c3
//graph c4
it works fine for SHORT trades, as well.
Thanks Roberto, I’m still a bit confused about what you mean by ‘here was a crossover compared to the previous candle, though it’s almost vertical and not horizontal’ – apologies I’m still a beginner at this. Using your code above (long only) I tested against EURUSD and had some unexpected trades – seems Mondays only or midnight time. I think its do with the timing based on previous day/week that causes some sort of shift in the resistance/support levels maybe??? – I’m not sure really. See attached screenshots
Yes, but if you do not plot pivots on your chart I can’t see if there is a crossover or not.
Look at my previous pic, there is a bearish candle where the mouse is sitting, then there is another bearish candle on its left. THAT is a bullish crossover!
The previous candle closed BELOW the pivot line, the following candle (where the mouse is sitting) closed ABOVE (despite il looks like on the right side) ABOVE the pivot line!
On Monday daily pivot lines will be calculated on the Sunday candle data. You need to ignore Sunday candles and use Friday data if it is a Monday and either include Sunday data with Monday data of ignore Sunday data if it is a Tuesday to get meaningful pivot lines. There is some code somewhere on this forum that does it or I have some code I wrote on one of my accounts – finding it might take a while though as I have not looked at pivot lines for years!
Here is some code that calculates R1, S1 and the central pivot and fixes the Sunday problem. On a Sunday and Monday it uses Friday data to calculate the lines. On Tuesday it uses Sunday and Monday combined to calculate the lines.
//Pivot Lines with Sunday Fix

b1=DHigh(1)
b2=DHigh(2)
c1=DLow(1)
c2=DLow(2)
d1=DClose(1)
d2=DClose(2)

IF OpenDayOfWeek = 1 THEN
b1=b2
c1=c2
d1=d2
endif

if OpenDayOfWeek = 2 then
b1 = max(b1,b2)
c1 = min(c1,c2)
ENDIF

H1 = b1//High
L1 = c1//Low
C = d1//Close

Pivot = (H1 + L1 + C) / 3
R1 = 2*((H1 + L1 + C) / 3)- L1
S1 = 2*((H1 + L1 + C) / 3)- H1

return Pivot style(dottedline,1) as "Point Pivot", R1 as "R1", S1 as "S1"
ah thank you both, splendid. Vonasi, do you know where I could find the code? I would really appreciate it. I could only find this? – https://www.prorealcode.com/reply/70436/
sorry Vonasi, just saw your previous message – many thanks! have a good weekend