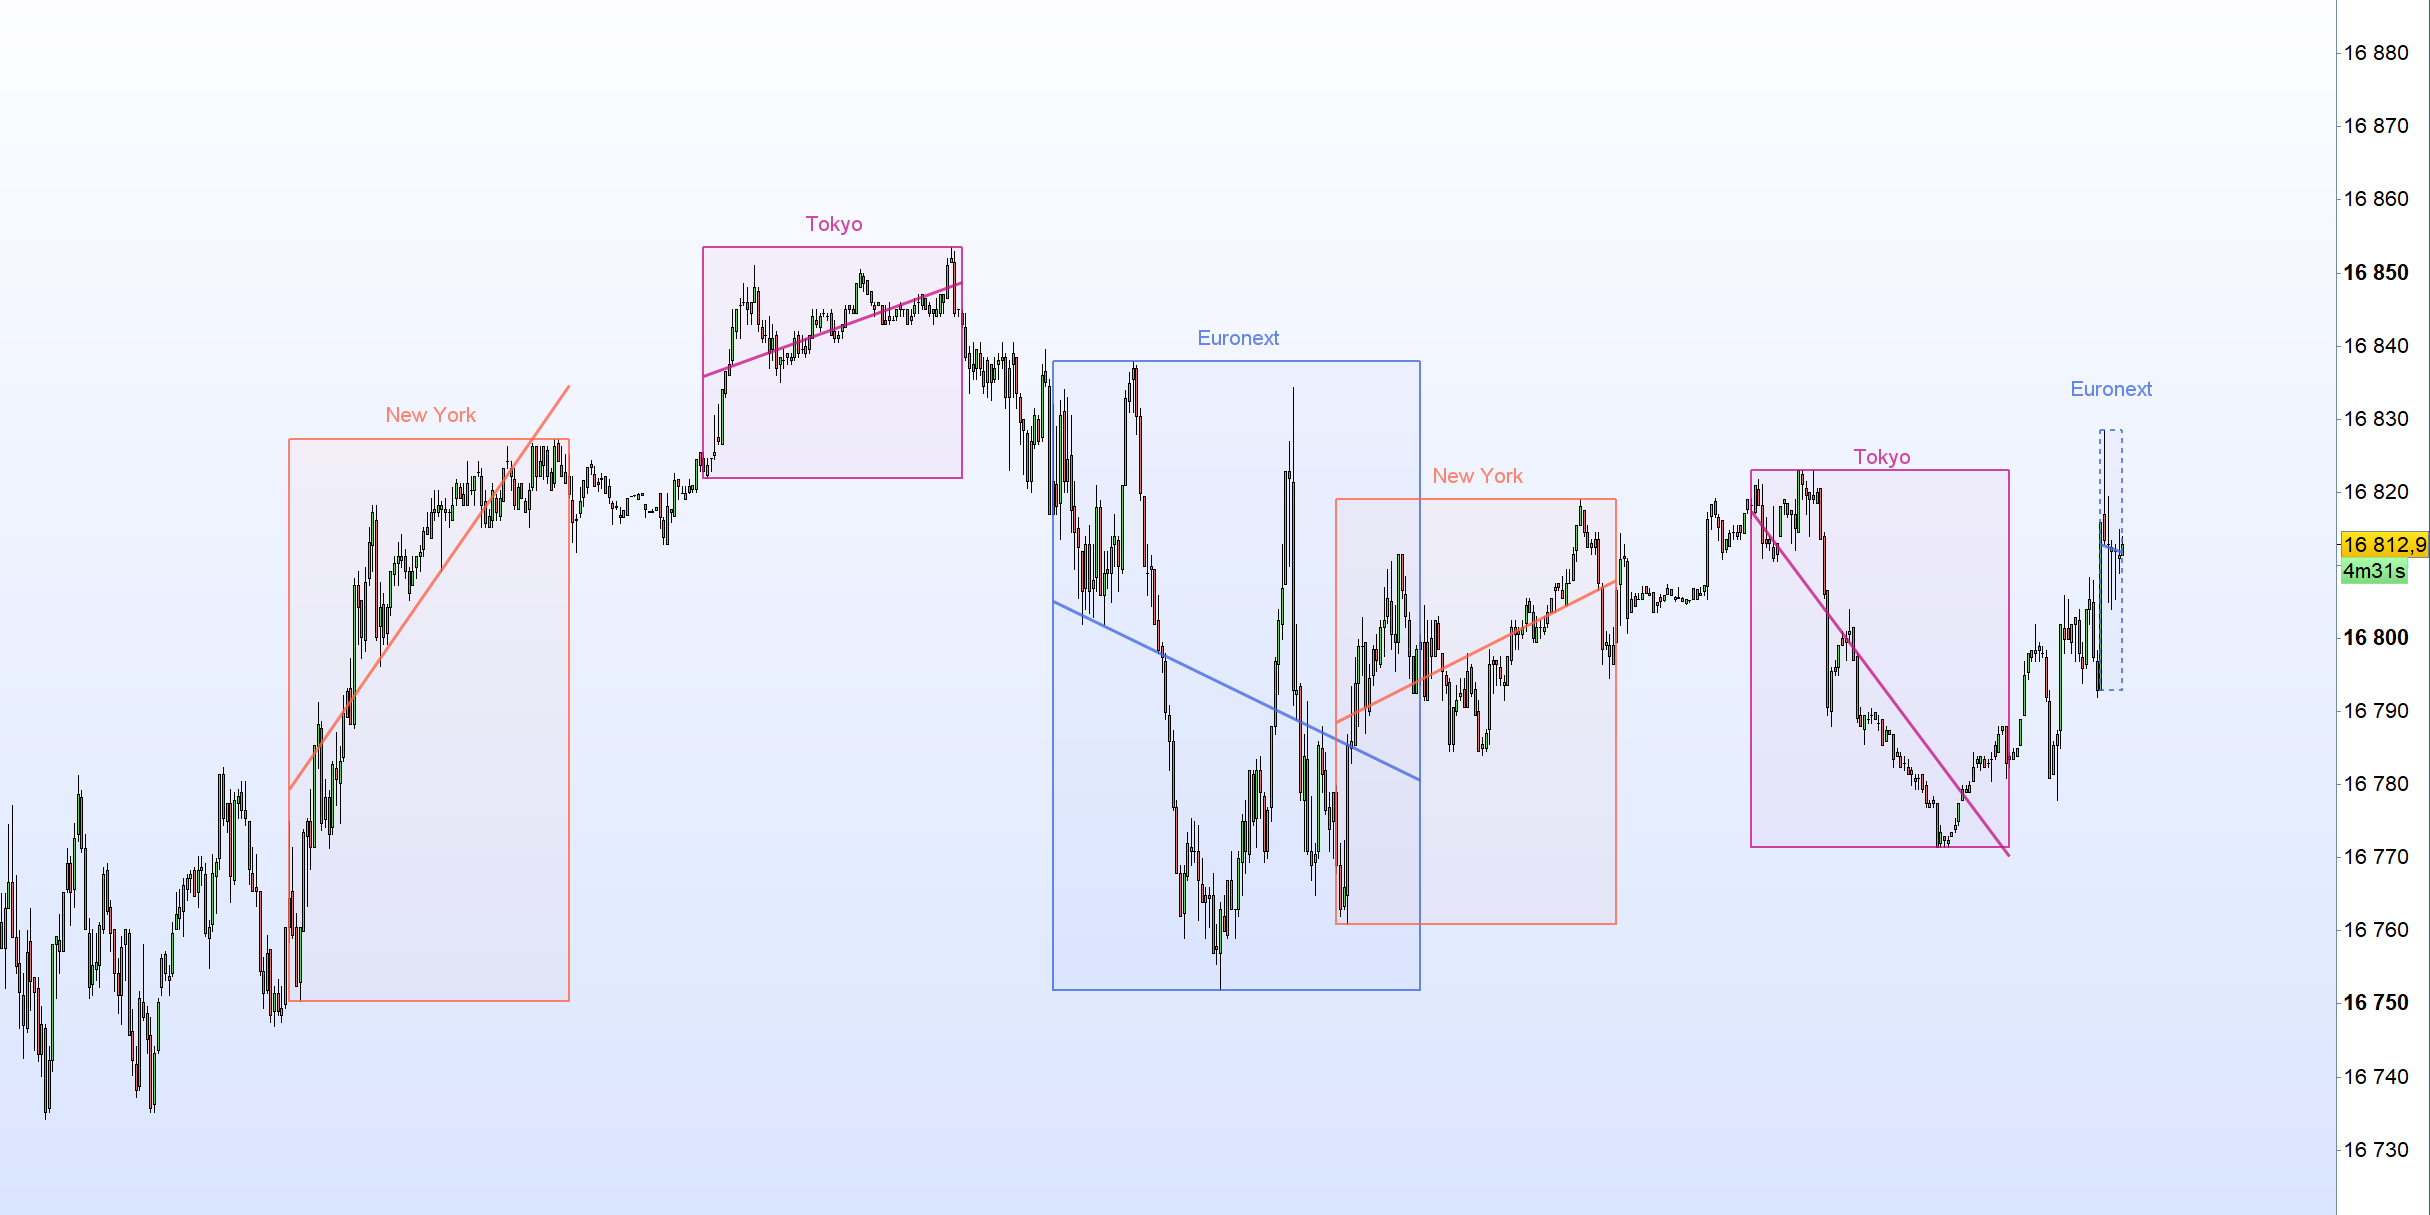
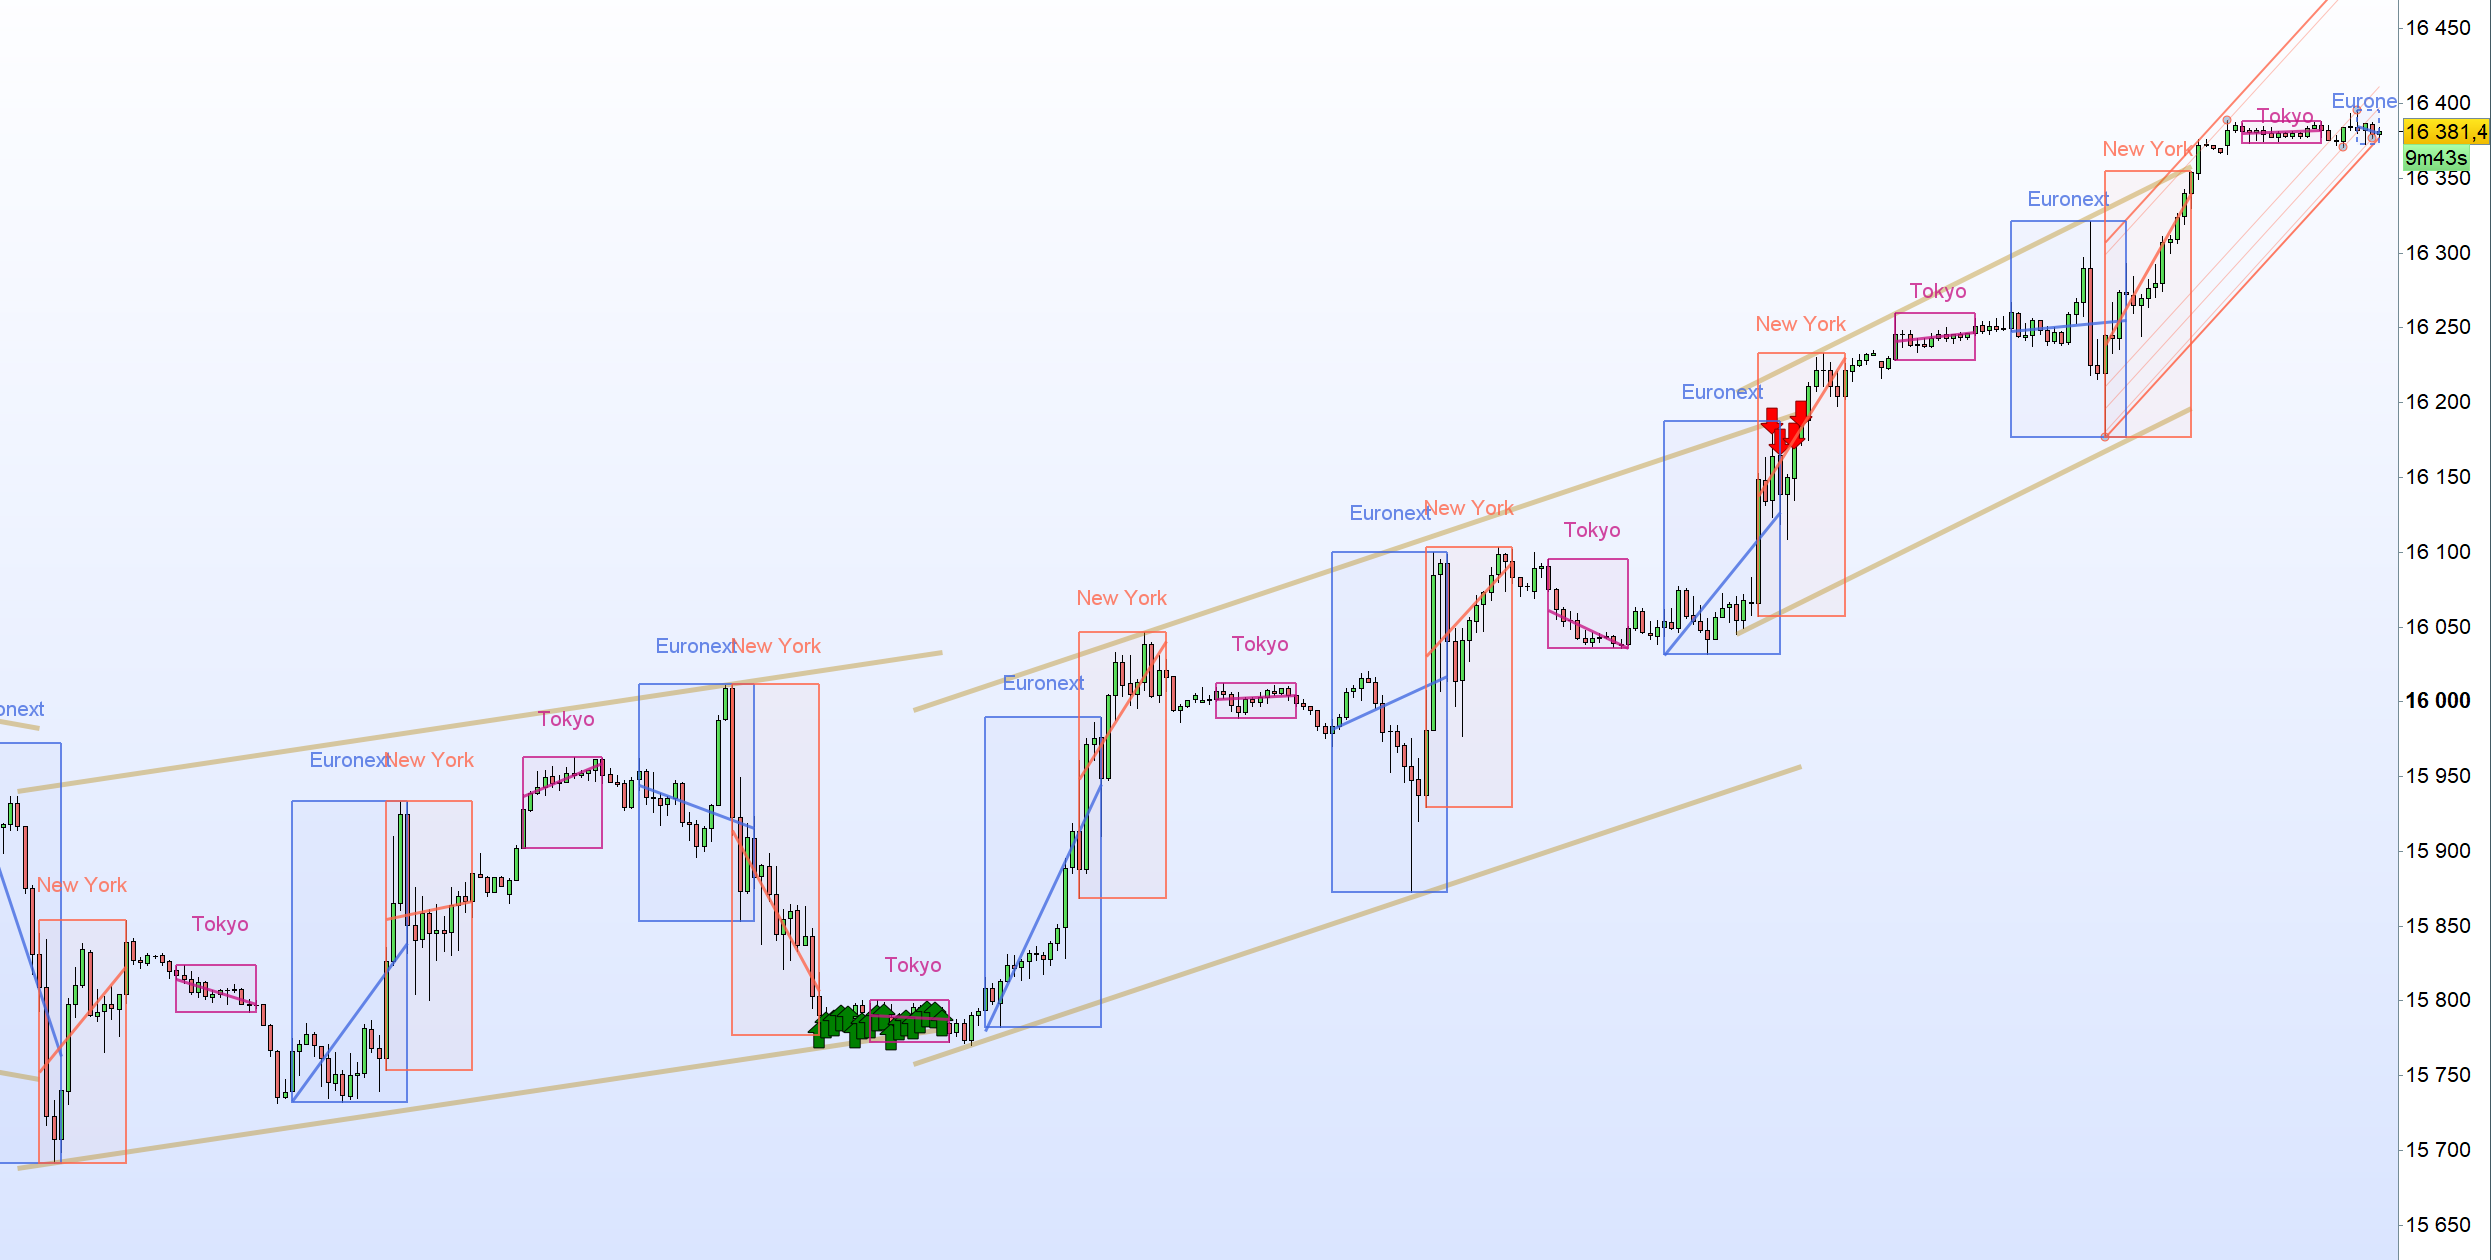
With Tokyo session added…
DefParam DrawOnLastBarOnly = true
Once EUIndex = 0
Once NYIndex = 0
Once JPIndex = 0
////////////////////
// EUROPE Session //
////////////////////
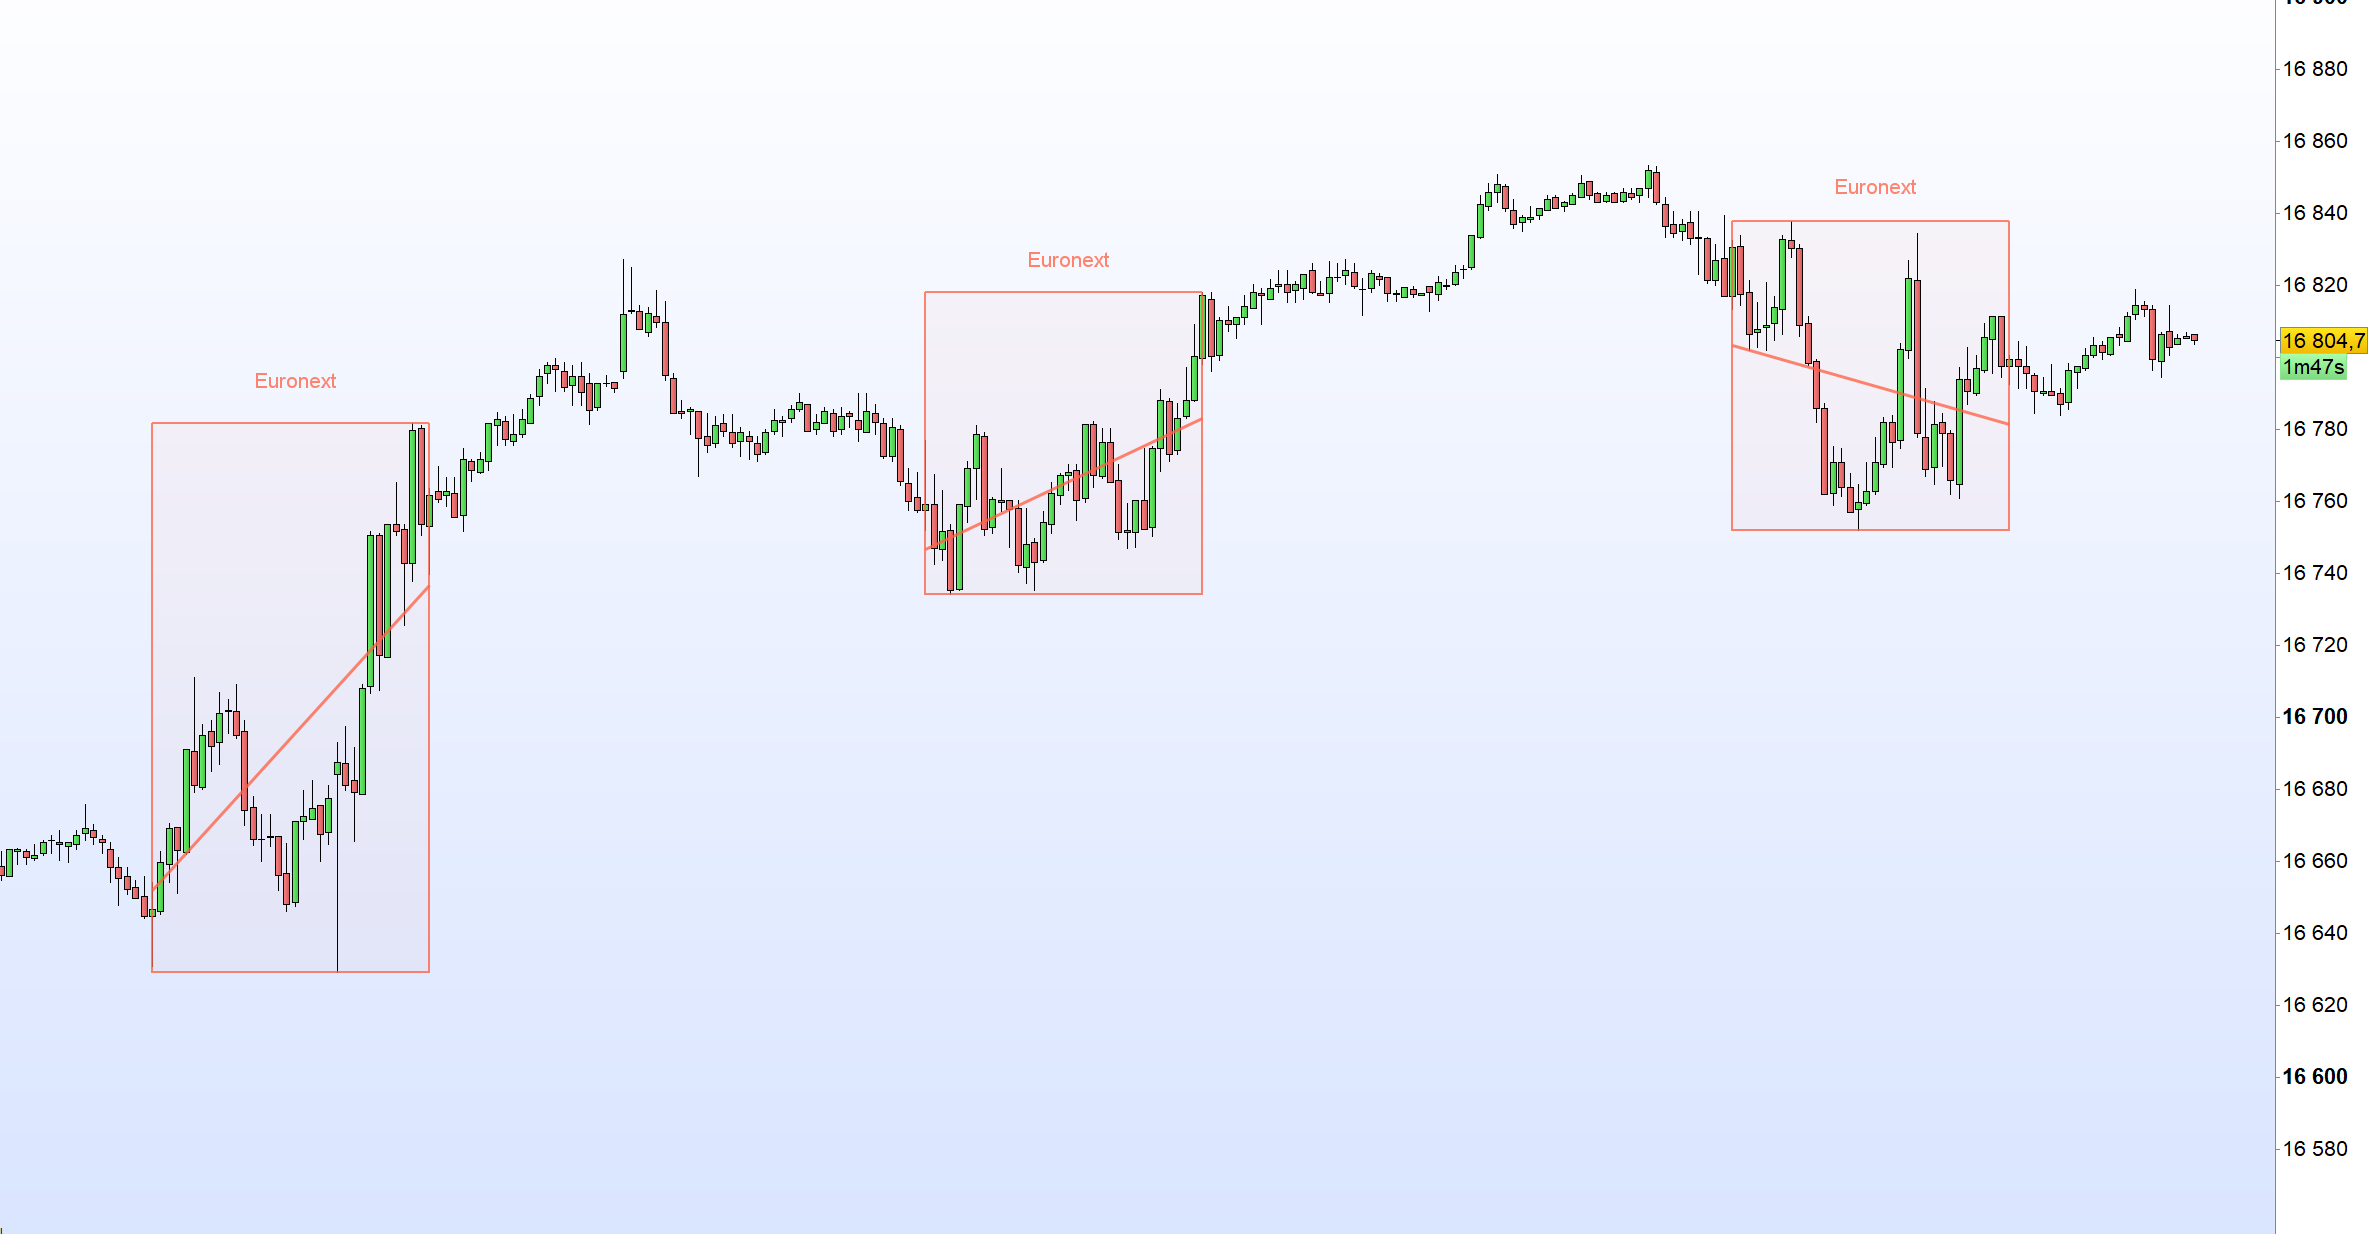
If ShowEuropeSession then
If OpenTime >= 090000 AND OpenTime < 173000 THEN
IF OpenTime = 090000 THEN
EUBegin = Barindex
EUHigh = high
EULow = low
EUActive = 1
ENDIF
EUEnd = Barindex
EUHigh = max(EUHigh,high)
EULow = min(EULow,low)
Offset = Average[1+EUEnd-EUBegin](TR(close))
If ShowMedianPrice then
EUMedian = (EUHigh+EULow)/2
Drawsegment(EUBegin,EUMedian,EUEnd,EUMedian) style(line,3) coloured("royalblue",200)
Endif
If ShowMeanPrice then
EUAverage = Average[EUEnd-EUBegin+1](Close)
Drawsegment(EUBegin,EUAverage,EUEnd,EUAverage) style(line,3) coloured("royalblue",200)
Endif
If ShowVWAP then
If barindex = EUBegin then
PreviousEUVWAP = typicalprice
Endif
If barindex >= EUBegin+1 then
For k = EUBegin+1 to barindex do
If volume>0 then
EUVWAP = SUMMATION[k-EUBegin](volume[Barindex-k]*typicalprice[Barindex-k])/SUMMATION[k-EUBegin](volume[Barindex-k])
Drawsegment(k-1,PreviousEUVWAP,k,EUVWAP) style(line,3) coloured("royalblue",200)
PreviousEUVWAP = EUVWAP
Endif
Next
Endif
Endif
If ShowTrendLine then
If Barindex > EUBegin then
b=linearregression[EUEnd-EUBegin](close)
a=linearregressionslope[EUEnd-EUBegin](close)
y=b-a*(EUEnd-EUBegin-1)
Drawsegment(EUBegin,y,EUEnd,b)Style(dottedline2,4) style(line,3) coloured("royalblue",200)
Endif
Endif
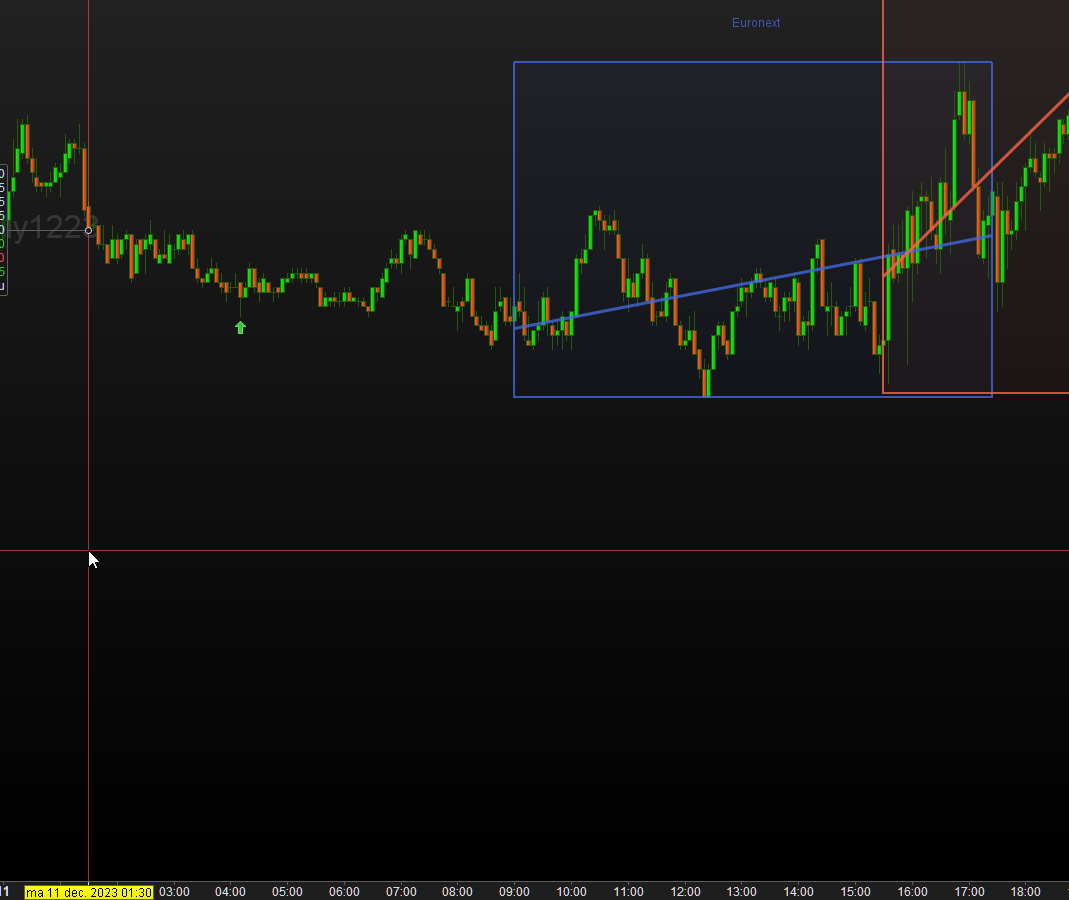
Drawrectangle(EUBegin,EUHigh,EUEnd,EULow) coloured("royalblue",10) bordercolor("royalblue",200) style(dottedline,2)
Drawtext("Euronext",(EUBegin+EUEnd)/2,EUHigh+Offset/2) coloured("royalblue",200)
ENDIF
If Opentime = 173000 then
$EUBegin[EUIndex] = EUBegin
$EUEnd[EUIndex] = EUEnd
$EUHigh[EUIndex] = EUHigh
$EULow[EUIndex] = EULow
$Offset[EUIndex] = Offset
EUActive = 0
EUIndex = EUIndex + 1
Endif
Endif
//////////////////////
// New York Session //
//////////////////////
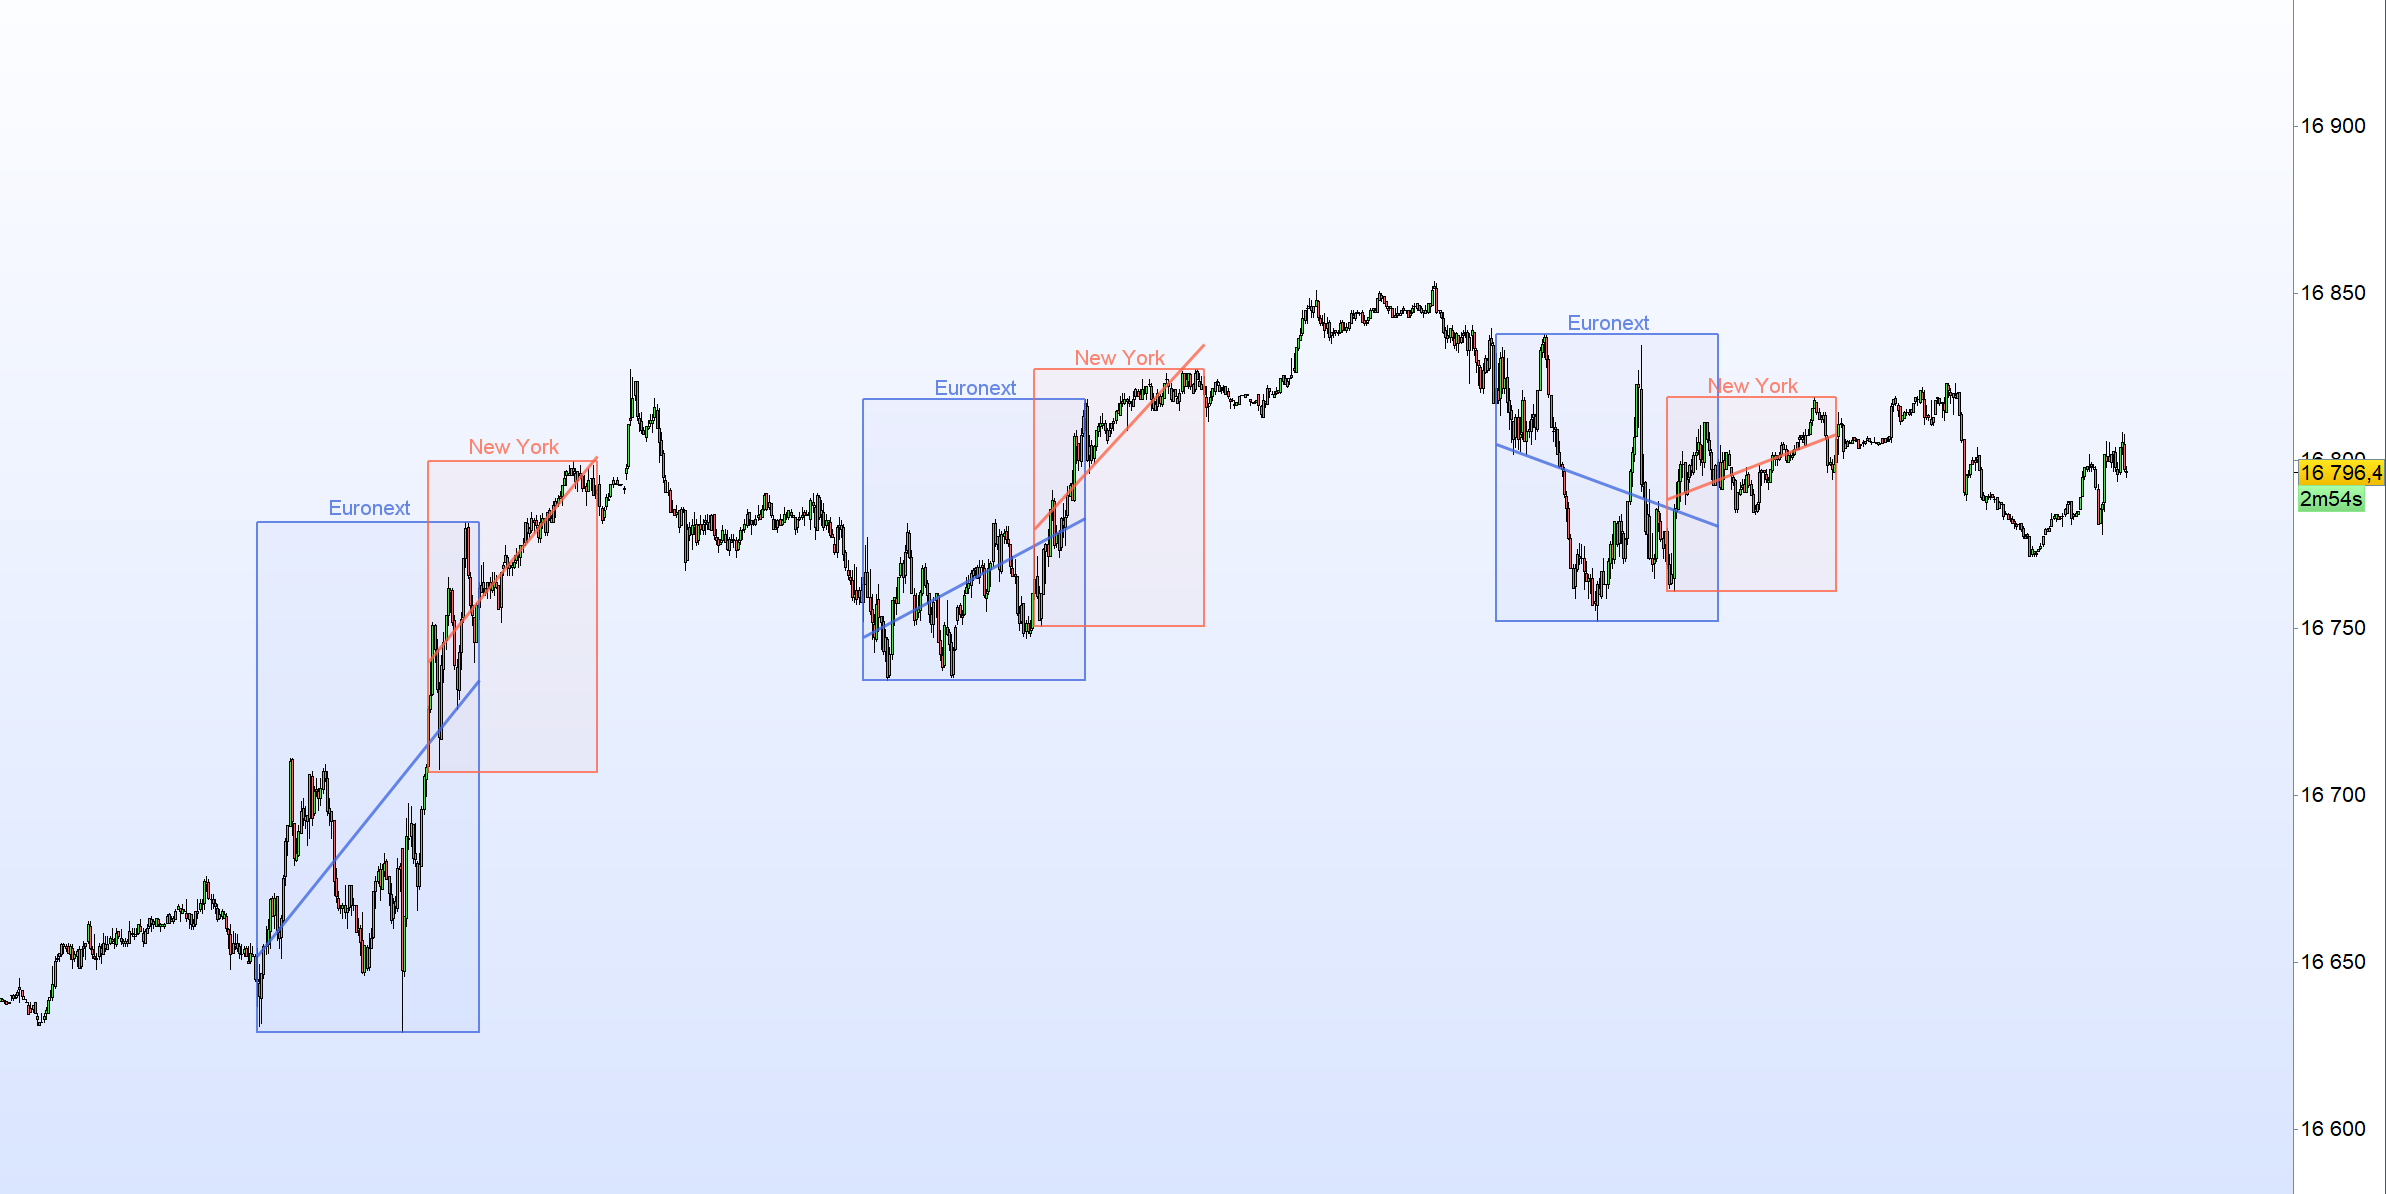
If ShowNewYorkSession then
If OpenTime >= 153000 AND OpenTime < 220000 THEN
IF OpenTime = 153000 THEN
NYBegin = Barindex
NYHigh = high
NYLow = low
NYActive = 1
ENDIF
NYEnd = Barindex
NYHigh = max(NYHigh,high)
NYLow = min(NYLow,low)
Offset = Average[1+NYEnd-NYBegin](TR(close))
If ShowMedianPrice then
NYMedian = (NYHigh+NYLow)/2
Drawsegment(NYBegin,NYMedian,NYEnd,NYMedian) style(line,3) coloured("tomato",200)
Endif
If ShowMeanPrice then
NYAverage = Average[NYEnd-NYBegin+1](Close)
Drawsegment(NYBegin,NYAverage,NYEnd,NYAverage) style(line,3) coloured("tomato",200)
Endif
If ShowVWAP then
If barindex = NYBegin then
PreviousNYVWAP = typicalprice
Endif
If barindex >= NYBegin+1 then
For k = NYBegin+1 to barindex do
If volume>0 then
NYVWAP = SUMMATION[k-NYBegin](volume[Barindex-k]*typicalprice[Barindex-k])/SUMMATION[k-NYBegin](volume[Barindex-k])
Drawsegment(k-1,PreviousNYVWAP,k,NYVWAP) style(line,3) coloured("tomato",200)
PreviousNYVWAP = NYVWAP
Endif
Next
Endif
Endif
If ShowTrendLine then
If Barindex > NYBegin then
b=linearregression[NYEnd-NYBegin](close)
a=linearregressionslope[NYEnd-NYBegin](close)
y=b-a*(NYEnd-NYBegin-1)
Drawsegment(NYBegin,y,NYEnd,b)Style(dottedline2,4) style(line,3) coloured("tomato",200)
Endif
Endif
Drawrectangle(NYBegin,NYHigh,NYEnd,NYLow) coloured("tomato",10) bordercolor("tomato",200) style(dottedline,2)
Drawtext("New York",(NYBegin+NYEnd)/2,NYHigh+Offset/2.5) coloured("tomato",200)
ENDIF
If Opentime = 220000 then
$NYBegin[NYIndex] = NYBegin
$NYEnd[NYIndex] = NYEnd
$NYHigh[NYIndex] = NYHigh
$NYLow[NYIndex] = NYLow
$Offset[NYIndex] = Offset
NYActive = 0
NYIndex = NYIndex + 1
Endif
Endif
////////////////////
// Tokyo Session //
////////////////////
If ShowTokyoSession then
If OpenTime >= 010000 AND OpenTime < 070000 THEN
IF OpenTime = 010000 THEN
JPBegin = Barindex
JPHigh = high
JPLow = low
JPActive = 1
ENDIF
JPEnd = Barindex
JPHigh = max(JPHigh,high)
JPLow = min(JPLow,low)
Offset = Average[1+JPEnd-JPBegin](TR(close))
If ShowMedianPrice then
JPMedian = (JPHigh+JPLow)/2
Drawsegment(JPBegin,JPMedian,JPEnd,JPMedian) style(line,3) coloured("mediumvioletred",200)
Endif
If ShowMeanPrice then
JPAverage = Average[JPEnd-JPBegin+1](Close)
Drawsegment(JPBegin,JPAverage,JPEnd,JPAverage) style(line,3) coloured("mediumvioletred",200)
Endif
If ShowVWAP then
If barindex = JPBegin then
PreviousJPVWAP = typicalprice
Endif
If barindex >= JPBegin+1 then
For k = JPBegin+1 to barindex do
If volume>0 then
JPVWAP = SUMMATION[k-JPBegin](volume[Barindex-k]*typicalprice[Barindex-k])/SUMMATION[k-JPBegin](volume[Barindex-k])
Drawsegment(k-1,PreviousJPVWAP,k,JPVWAP) style(line,3) coloured("mediumvioletred",200)
PreviousJPVWAP = JPVWAP
Endif
Next
Endif
Endif
If ShowTrendLine then
If Barindex > JPBegin then
b=linearregression[JPEnd-JPBegin](close)
a=linearregressionslope[JPEnd-JPBegin](close)
y=b-a*(JPEnd-JPBegin-1)
Drawsegment(JPBegin,y,JPEnd,b)Style(dottedline2,4) style(line,3) coloured("mediumvioletred",200)
Endif
Endif
Drawrectangle(JPBegin,JPHigh,JPEnd,JPLow) coloured("mediumvioletred",10) bordercolor("mediumvioletred",200) style(dottedline,2)
Drawtext("Tokyo",(JPBegin+JPEnd)/2,JPHigh+Offset/2) coloured("mediumvioletred",200)
ENDIF
If Opentime = 070000 then
$JPBegin[JPIndex] = JPBegin
$JPEnd[JPIndex] = JPEnd
$JPHigh[JPIndex] = JPHigh
$JPLow[JPIndex] = JPLow
$Offset[JPIndex] = Offset
JPActive = 0
JPIndex = JPIndex + 1
Endif
Endif
///////////////////////////////
// Previous Sessions drawing //
///////////////////////////////
If Sessions2Show > 0 then
// EUROPE Session //
If ShowEuropeSession and EUIndex > 0 then
EUSessions2Draw = Max(0,Sessions2Show-EUActive)
EUFirstSession = Max(0,EUIndex-Min(EUSessions2Draw,EUIndex))
For i = EUIndex-1 downto EUFirstSession do
If ShowMedianPrice then
EUMedian = ($EUHigh[i]+$EULow[i])/2
Drawsegment($EUBegin[i],EUMedian,$EUEnd[i],EUMedian) style(line,3) coloured("royalblue",200)
Endif
If ShowMeanPrice then
delay = Barindex-$EUEnd[i]
EUAverage = Average[$EUEnd[i]-$EUBegin[i]+1](Close[delay])
Drawsegment($EUBegin[i],EUAverage,$EUEnd[i],EUAverage) style(line,3) coloured("royalblue",200)
Endif
If ShowVWAP then
delay = Barindex-$EUBegin[i]
PreviousEUVWAP = typicalprice[delay]
For k = $EUBegin[i]+1 to $EUEnd[i] do
delay = barindex-k
length = k-$EUBegin[i]
If volume[delay]>0 then
EUVWAP = SUMMATION[length](volume[delay]*typicalprice[delay])/SUMMATION[length](volume[delay])
Drawsegment(k-1,PreviousEUVWAP,k,EUVWAP) style(line,3) coloured("royalblue",200)
PreviousEUVWAP = EUVWAP
Endif
Next
Endif
If ShowTrendLine then
delay = Barindex-$EUEnd[i]
b=linearregression[$EUEnd[i]-$EUBegin[i]+1](close[delay])
a=linearregressionslope[$EUEnd[i]-$EUBegin[i]+1](close[delay])
y=b-a*($EUEnd[i]-$EUBegin[i])
Drawsegment($EUBegin[i],y,$EUEnd[i],b) Style(dottedline2,4) style(line,3) coloured("royalblue",200)
Endif
Drawrectangle($EUBegin[i],$EUHigh[i],$EUEnd[i],$EULow[i]) coloured("royalblue",10) bordercolor("royalblue",200) style(line,2)
Drawtext("Euronext",($EUBegin[i]+$EUEnd[i])/2,$EUHigh[i]+$Offset[i]/2) coloured("royalblue",200)
Next
Endif
// New York Session //
If ShowNewYorkSession and NYIndex > 0 then
NYSessions2Draw = Max(0,Sessions2Show-NYActive)
NYFirstSession = Max(0,NYIndex-Min(NYSessions2Draw,NYIndex))
For i = NYIndex-1 downto NYFirstSession do
If ShowMedianPrice then
NYMedian = ($NYHigh[i]+$NYLow[i])/2
Drawsegment($NYBegin[i],NYMedian,$NYEnd[i],NYMedian) style(line,3) coloured("tomato",200)
Endif
If ShowMeanPrice then
delay = Barindex-$NYEnd[i]
NYAverage = Average[$NYEnd[i]-$NYBegin[i]+1](Close[delay])
Drawsegment($NYBegin[i],NYAverage,$NYEnd[i],NYAverage) style(line,3) coloured("tomato",200)
Endif
If ShowVWAP then
delay = Barindex-$NYBegin[i]
PreviousNYVWAP = typicalprice[delay]
For k = $NYBegin[i]+1 to $NYEnd[i] do
delay = barindex-k
length = k-$NYBegin[i]
If volume[delay]>0 then
NYVWAP = SUMMATION[length](volume[delay]*typicalprice[delay])/SUMMATION[length](volume[delay])
Drawsegment(k-1,PreviousNYVWAP,k,NYVWAP) style(line,3) coloured("tomato",200)
PreviousNYVWAP = NYVWAP
Endif
Next
Endif
If ShowTrendLine then
delay = Barindex-$NYEnd[i]
b=linearregression[$NYEnd[i]-$NYBegin[i]+1](close[delay])
a=linearregressionslope[$NYEnd[i]-$NYBegin[i]+1](close[delay])
y=b-a*($NYEnd[i]-$NYBegin[i])
Drawsegment($NYBegin[i],y,$NYEnd[i],b) Style(dottedline2,4) style(line,3) coloured("tomato",200)
Endif
Drawrectangle($NYBegin[i],$NYHigh[i],$NYEnd[i],$NYLow[i]) coloured("tomato",10) bordercolor("tomato",200) style(line,2)
Drawtext("New York",($NYBegin[i]+$NYEnd[i])/2,$NYHigh[i]+$Offset[i]/2) coloured("tomato",200)
Next
Endif
// TOKYO Session //
If ShowTokyoSession and JPIndex > 0 then
JPSessions2Draw = Max(0,Sessions2Show-JPActive)
JPFirstSession = Max(0,JPIndex-Min(JPSessions2Draw,JPIndex))
For i = JPIndex-1 downto JPFirstSession do
If ShowMedianPrice then
JPMedian = ($JPHigh[i]+$JPLow[i])/2
Drawsegment($JPBegin[i],JPMedian,$JPEnd[i],JPMedian) style(line,3) coloured("mediumvioletred",200)
Endif
If ShowMeanPrice then
delay = Barindex-$JPEnd[i]
JPAverage = Average[$JPEnd[i]-$JPBegin[i]+1](Close[delay])
Drawsegment($JPBegin[i],JPAverage,$JPEnd[i],JPAverage) style(line,3) coloured("mediumvioletred",200)
Endif
If ShowVWAP then
delay = Barindex-$JPBegin[i]
PreviousJPVWAP = typicalprice[delay]
For k = $JPBegin[i]+1 to $JPEnd[i] do
delay = barindex-k
length = k-$JPBegin[i]
If volume[delay]>0 then
JPVWAP = SUMMATION[length](volume[delay]*typicalprice[delay])/SUMMATION[length](volume[delay])
Drawsegment(k-1,PreviousJPVWAP,k,JPVWAP) style(line,3) coloured("mediumvioletred",200)
PreviousJPVWAP = JPVWAP
Endif
Next
Endif
If ShowTrendLine then
delay = Barindex-$JPEnd[i]
b=linearregression[$JPEnd[i]-$JPBegin[i]+1](close[delay])
a=linearregressionslope[$JPEnd[i]-$JPBegin[i]+1](close[delay])
y=b-a*($JPEnd[i]-$JPBegin[i])
Drawsegment($JPBegin[i],y,$JPEnd[i],b) Style(dottedline2,4) style(line,3) coloured("mediumvioletred",200)
Endif
Drawrectangle($JPBegin[i],$JPHigh[i],$JPEnd[i],$JPLow[i]) coloured("mediumvioletred",10) bordercolor("mediumvioletred",200) style(line,2)
Drawtext("Tokyo",($JPBegin[i]+$JPEnd[i])/2,$JPHigh[i]+$Offset[i]/2) coloured("mediumvioletred",200)
Next
Endif
Endif
Return