In statistics, the Pearson correlation coefficient, also referred to as Pearson’s r, the Pearson product-moment correlation coefficient (PPMCC), is a measure of linear correlation between two sets of data. It is the covariance of two variables, divided by the product of their standard deviations; thus it is essentially a normalised measurement of the covariance, such that the result always has a value between −1 and 1. https://en.wikipedia.org/wiki/Pearson_correlation_coefficient
It’s not to be confused with R2 – Coefficient of determination – https://www.prorealcode.com/prorealtime-indicators/r-squared-correlation-coefficient-r2/
//ρ (rho) = cov(x, y) / sd(x) * sd(y), where cov is covariance, sd(x) is the standard deviation of x

// cov(x,y) = ((x - E(x) * (y - E(y) ), where E(x) is the Expected Value of x

// E(x) = average(x),  the expected value is the weighted sum of the xi values, with the probabilities pi as the weights. When values of x are equiprobable, then the weighted average turns into the simple average.

// sd(x) = square root (variance(x;xn))

// variance(x;xn) = (x-(average(x1;xn))^2 / n

Period = 5

IF barindex>Period THEN

X         = close
VarianceX = average[Period](SQUARE((X - average[Period](X))))
sdX       = SQRT(VarianceX)

Y         = RSI[8](close)
VarianceY = average[Period](SQUARE((Y - average[Period](Y))))
sdY       = SQRT(VarianceY)

covXY     = average[Period]((X-average[Period](X)) * (Y-average[Period](Y)))

R        = covXY / (sdX * sdY)

ENDIF

RETURN R
While the above code considers the correlation between two variables at the most current bar and based on other historical values, I wonder if it’s not more appropriate to compare current [P] X to previous [P-1] Y , so that one can at least predict the direction of X based on previous Y (previous closed bar).
Now, the most difficult is to find the best suited Y (RSI? Stoch? Volume? or a combination of a few indicators? calculated on the same period than X or on a different period? etc.)
Please share your thoughts or any improvement you may think of.
 JS
JSParticipant
Senior
Hi @Khaled
Thanks for the nice indicator.
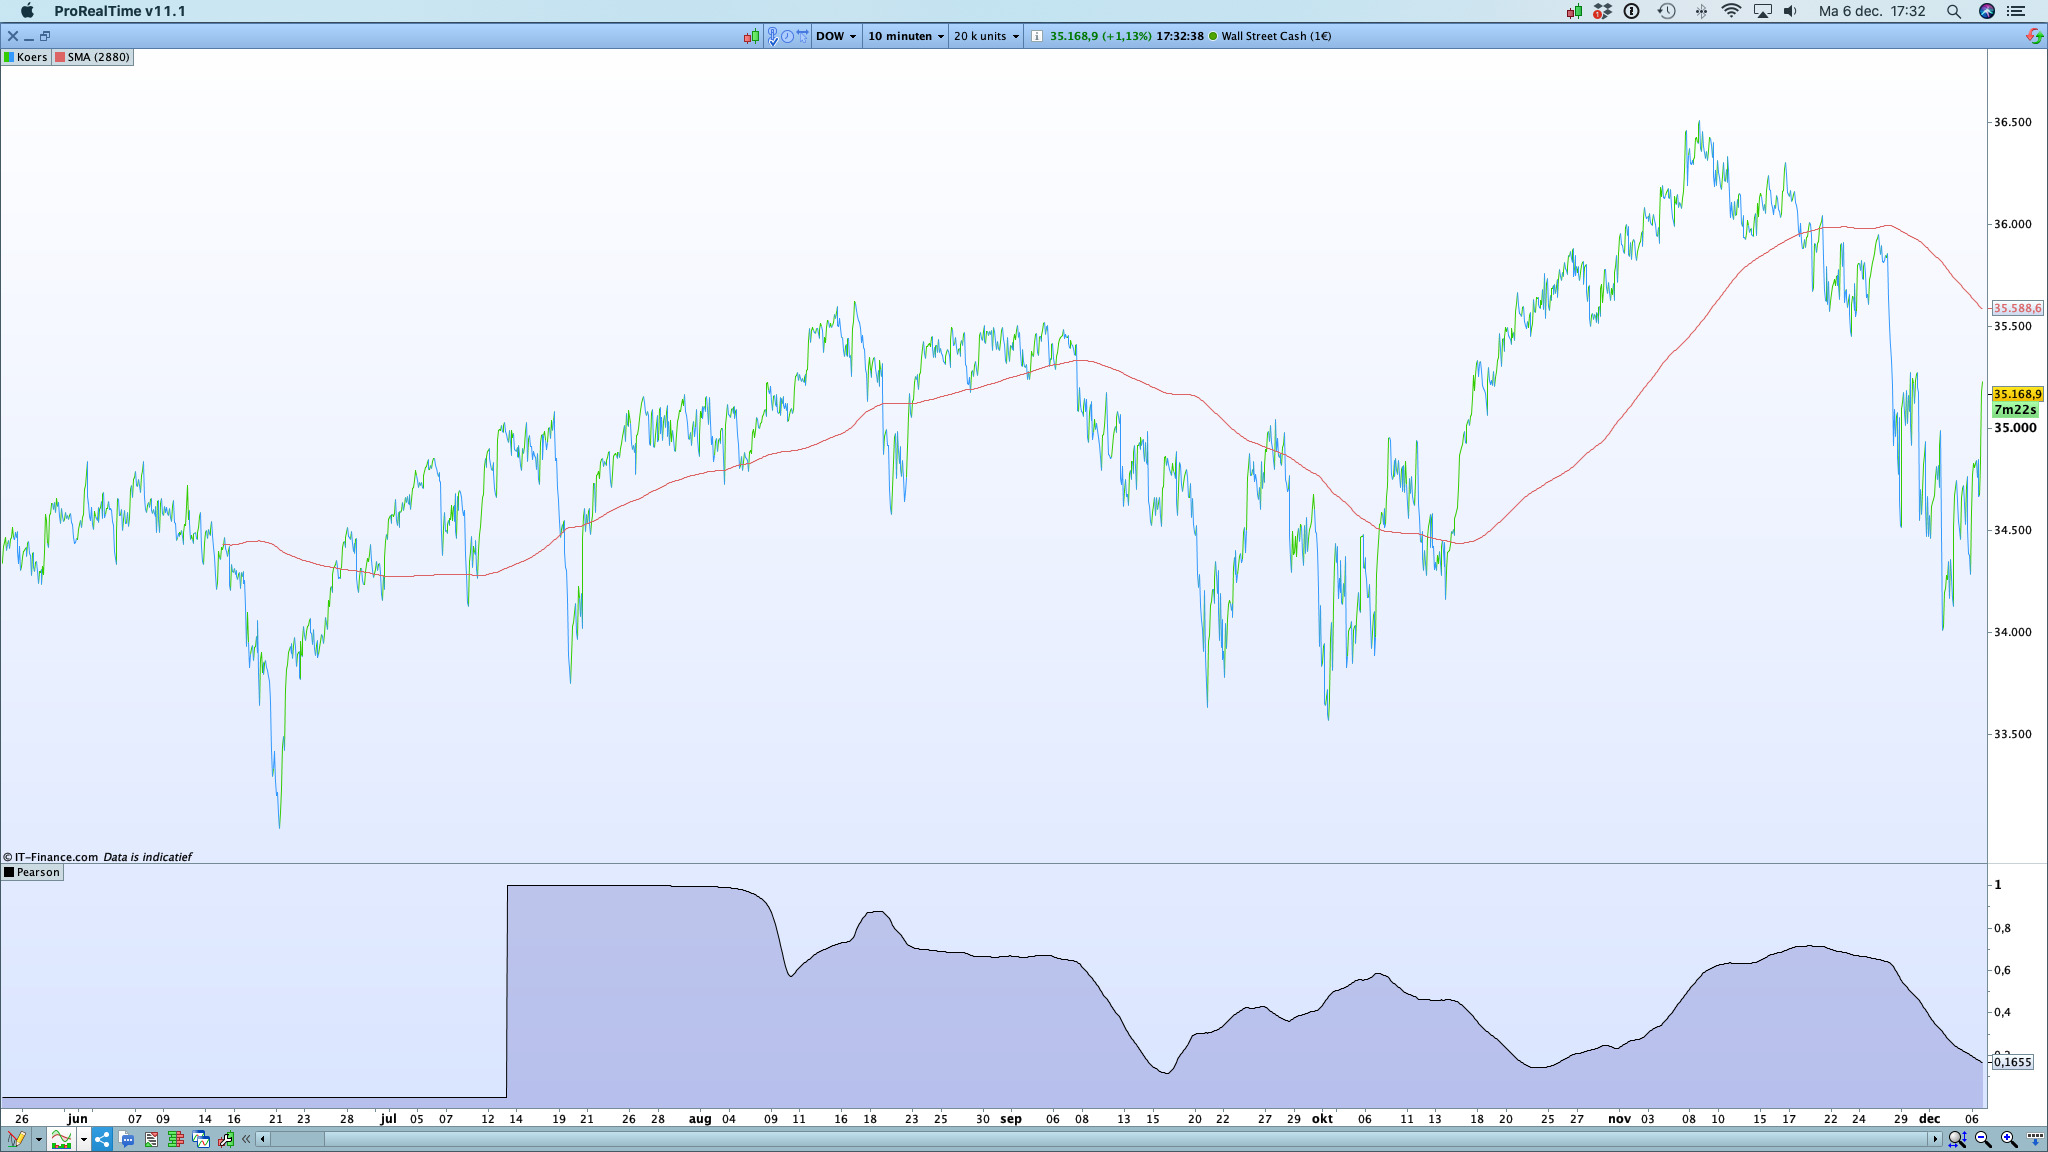
When I compare the Pearson correlation between the close and the average (see example) I see that the correlation between the two is variable.
Sometimes a high correlation of almost 1 and sometimes a low correlation of almost 0.
What I actually expected was that the correlation would remain the same.
Have you ever come across indicators where the correlation remains constant in relation to the price?
Hi JS,
If you look closely, the Pearson’s r goes down when the current price goes away from the average you have plotted or in case of sudden change of trend direction and/or acceleration of a move. Example end 25th of Nov./1st of Dec. the Dow “crashed” (-2000pts, -5.6%) and the r went down. In the definition, r range is +1 to -1. I guess, if you plot very fast average like Hull period 3, you would nearly always get a high r.
Now, if the question is what can be a leading indicator which has a consistently high r so that you can predict future price from Indicator[1] and r? then the answer is “to my knowledge, none” as the price makes the indicators. In my experience, Indicators can be at best used as filters or trend confirmation tools.
Just a personal opinion…
JSParticipant
Senior
Hi @Khaled
Thanks for the reaction.
I understand where the deviation comes from, but I didn’t think it would be so variable.
Precisely because an average is calculated in an unambiguous way from the price, I had thought that the correlation would change a bit, but not in this way.
It is quite a shocking conclusion because “Average” forms the basis of many indicators and now the correlation with the price appears to be highly variable.
So, looking for indicators with a “constant” correlation with the price.
BTW if you’re looking for a filter that makes 1 to 2% Win Rate difference, you can check this https://www.prorealcode.com/topic/velocity-acceleration-and-momentum/
Happy to hear your feedback
JSParticipant
Senior
Hi @Khaled
Good idea and cleverly worked out but I can’t say much else about it because my basic view is that prices are random but that the process of price formation is non -stationary.
A non-stationary process is a process in which the average changes (slowly). So, there is a certain “drift” in the prices.
Because prices are random, there is by definition no connection between the prices themselves and the search for a connection or pattern is therefore pointless in my opinion.
It is possible to say something (or a lot) about the price formation in statistical terms, in terms of standard deviation, variance, normal distribution, etc.
@JS, I like your analytical approach. May I ask: if you had to chose 3 indicators and only 3, what would you pick?
JSParticipant
Senior
Hi @Khaled
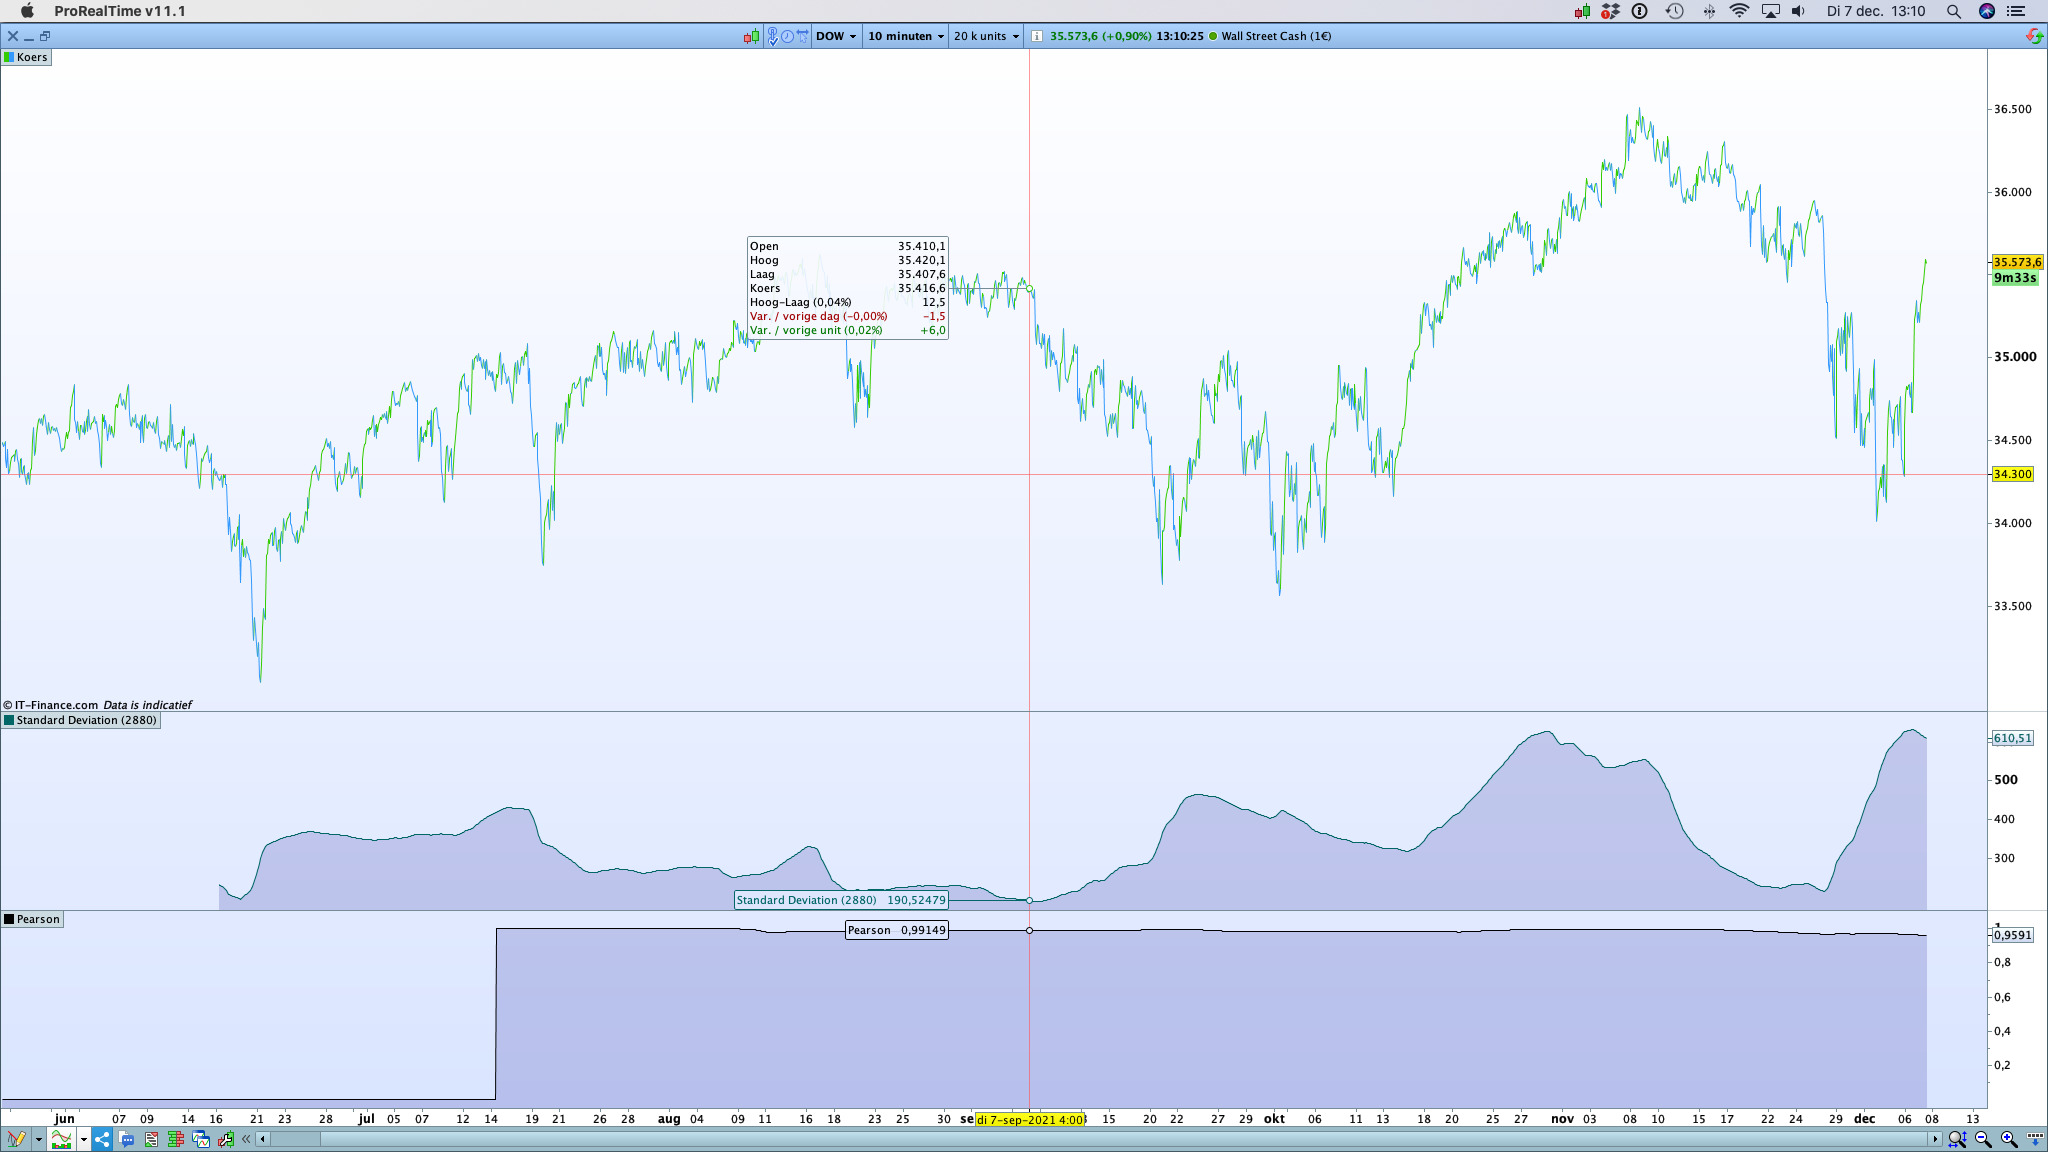
- Standard deviation
- Standard deviation
- Standard deviation
When you combine the standard deviation with the price, you have an indicator with a constant high correlation (so it really exists 🙂 ).
Mathematically speaking, I agree with you. But, apart from observing volatility, how do you trade with SD please?
BTW, I see you’re using PRT on iOS. Do you happen to observe slow PRT? Any solution to share? Thanks (I’m running Monterey with M1 and 16 Go RAM, 200 Go HD free space)
JSParticipant
Senior
Hi @Khaled
Sorry, that’s all I can say about it because I want to keep my trading system secret, but the basis of my system is this indicator.
Make sure you keep your system consistent, for example when you are going to add MM, do not suddenly involve other indicators, but keep it as a whole.
Think carefully about the characteristics of your system, for example a single LONG system has a completely different characteristic than, for example, a LONG and SHORT system because the market conditions in a rising market are completely different than in a falling market (I do not think it can be combined well).
My system only goes LONG and the statistic determines when to buy and sell so I don’t use SL or TP because in my case these are just confounding factors.
Keep it simple and consistent.
JSParticipant
Senior
I use Catalina and have added 24 GB (1600 MHz DDR3) of memory especially for PRT.
In itself no problems with the speed although of course it can always be faster 🙂