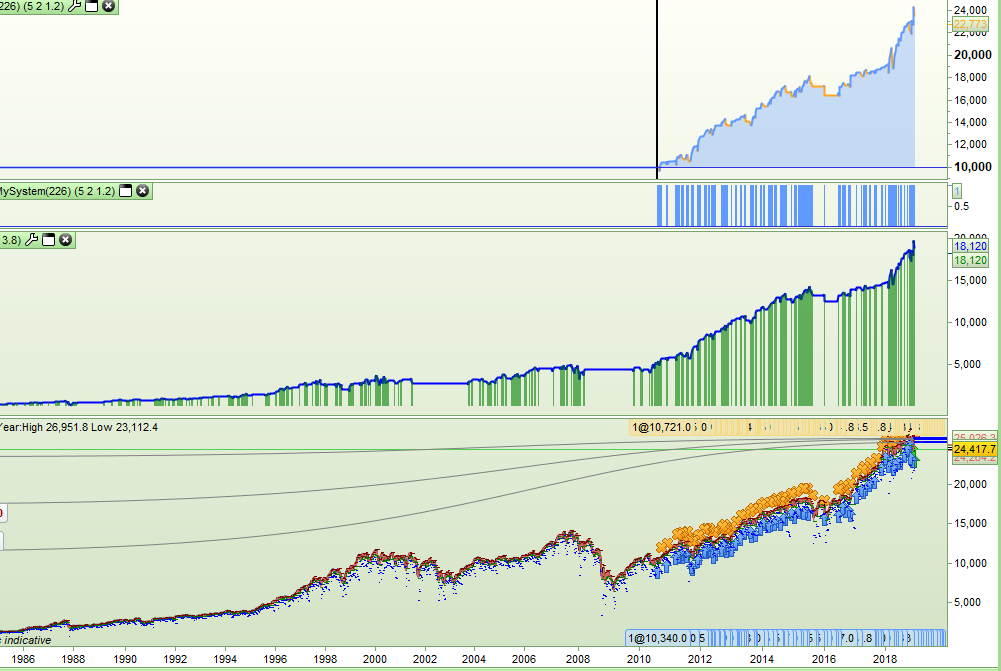
I wrote a long only daily strategy that bought at calculated support prices and sold at resistance prices and that required the use of tick by tick data as it used LIMIT and STOP pending orders. It looked great but using tick by tick limited the data sample to starting from just August 2010. The strategy never bought and sold on the same day so I decided to write an indicator that simulated the strategy so that I could test further back – this way I could have a much bigger data sample to test on. Obviously this will only work if your strategy has no zero bar trades – that is ones that open and close in the same bar.
As well as graphing my simulated equity curve I graphed my ‘onmark’ variable multiplied by the equity to show when the simulated strategy was on market.
[attachment file=86567]
Here is the simulated bit of code – I have removed the actual main parts of the strategy:
Spread = 3.8

//simulated entry
if not onmark and close[1] > supportprice[1] and low < supportprice and open > supportprice and filter then
entryprice = supportprice
onmark = 1
stoplossprice = (my calculated stoploss price)
endif

//simulated win exit
if onmark and high > resistanceprice then
exitprice = resistanceprice
onmark = 0
equity = (equity + (exitprice - entryprice)) - spread
endif

//simulated hit stoploss
if onmark and low < stoplossprice then
exitprice = stoplossprice
onmark = 0
equity = (equity + (exitprice - entryprice)) - spread
endif

if onmark then
floatingequity = (equity + (close - entryprice))
else
floatingequity = equity
endif

return floatingequity coloured(0,0,255) style(line,2) as "Equity", (onmark * floatingequity) coloured(0,128,0,150) style(histogram,2) as "OnMarket"
Obviously my strategies entry and exit points are very simple to simulate and so if your strategy is very complicated then simulating it might not be quite so easy – but I post this here just in case someone else might find the concept useful for their own back testing of any strategy with STOP and LIMIT pending orders and no zero bar entry and exits.
Technically this is an indicator but as it is really a strategy equity curve I post it here rather than in the indicator section.
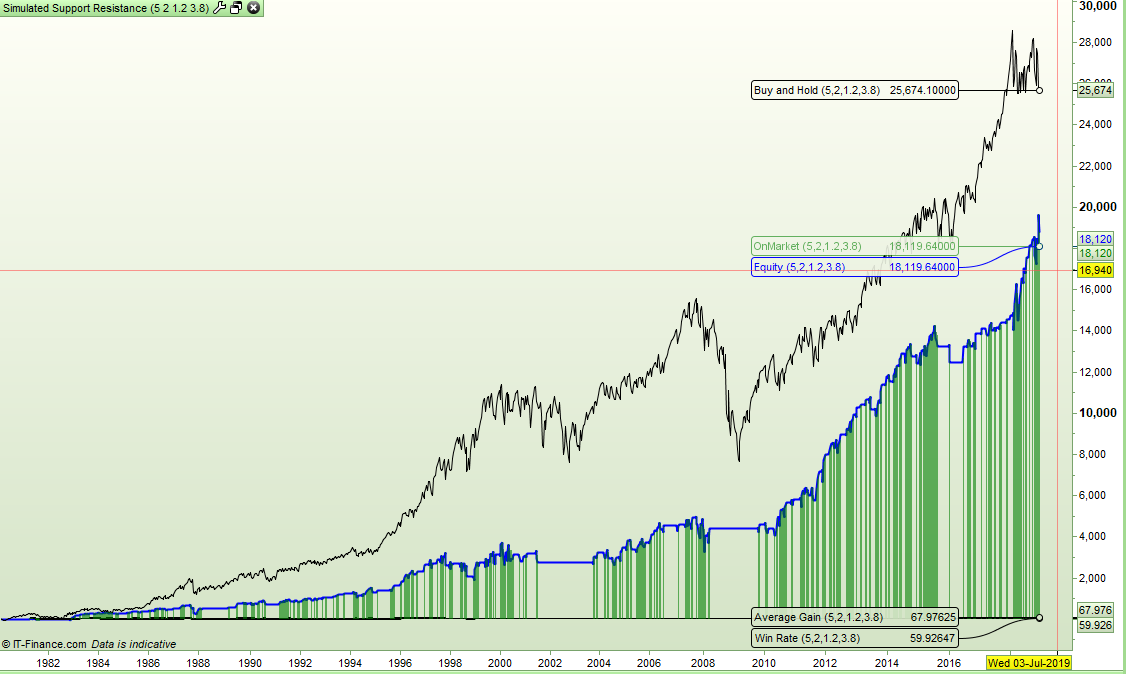
I made some slight improvements by adding a buy and hold line and also calculating the win rate and average gain per trade. In fact this is better than the PRT results as you can see historically how the win rate and average return has been rather than just the final totals.
[attachment file=86571]
Spread = 3.8

//simulated entry
if not onmark and close[1] > supportprice[1] and low < supportprice and open > supportprice and filter then
entryprice = supportprice
onmark = 1
stoplossprice = (my calculated stop loss price)
endif

//simulated win exit
if onmark and high > resistanceprice then
exitprice = resistanceprice
onmark = 0
equity = (equity + (exitprice - entryprice)) - spread
endif

//simulated hit stoploss
if onmark and low < stoplossprice then
exitprice = stoplossprice
onmark = 0
equity = (equity + (exitprice - entryprice)) - spread
if equity > equity[1] then
win = win + 1
count = count + 1
endif
if equity < equity[1] then
count = count + 1
endif
endif

if onmark then
floatingequity = (equity + (close - entryprice))
else
floatingequity = equity
if equity > equity[1] then
win = win + 1
count = count + 1
endif
if equity < equity[1] then
count = count + 1
endif
endif

buyandhold = buyandhold + (close - open)

winrate = (win/count) * 100
avegain = (equity /count)

return floatingequity coloured(0,0,255) style(line,2) as "Equity", buyandhold as "Buy and Hold", winrate as "Win Rate", avegain as "Average Gain", (onmark * floatingequity) coloured(0,128,0,150) style(histogram,2) as "OnMarket"
I’ve just realised that if your strategy has no zero bar issues of trades opening and closing on the same bar then by just turning off the tick by tick you will get an accurate equity graph – so my above code is a waste of time! I suppose at least with it you can see a running win rate and average gain per trade.
I won’t delete the posts so that someone might read it and use my experience/stupidity and not waste their own time.
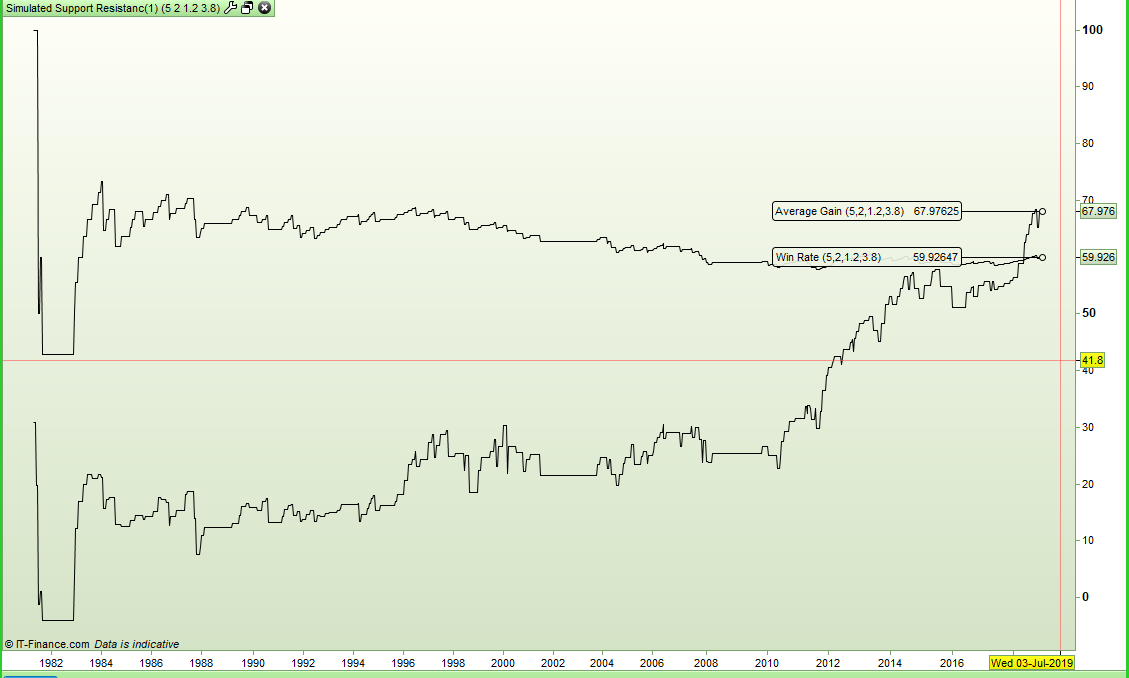
I modified it to just show the win rate and average gain. Maybe it is not all wasted time.
Interesting to note the win rate dropping but the average gain increasing.
[attachment file=86577]
Spread = 3.8

//simulated entry
if not onmark and close[1] > supportprice[1] and low < supportprice and open > supportprice and filter then
entryprice = supportprice
onmark = 1
stoplossprice = (my calculated stop loss price)
endif

//simulated win exit
if onmark and high > resistanceprice then
exitprice = resistanceprice
onmark = 0
equity = (equity + (exitprice - entryprice)) - spread
endif

//simulated hit stoploss
if onmark and low < stoplossprice then
exitprice = stoplossprice
onmark = 0
equity = (equity + (exitprice - entryprice)) - spread
if equity > equity[1] then
win = win + 1
count = count + 1
endif
if equity < equity[1] then
count = count + 1
endif
endif

if equity > equity[1] then
win = win + 1
count = count + 1
endif
if equity < equity[1] then
count = count + 1
endif

winrate = (win/count) * 100
avegain = (equity /count)

return winrate as "Win Rate", avegain as "Average Gain"
Great Vanosi very interisting Thing.