Paul
PaulParticipant
Master
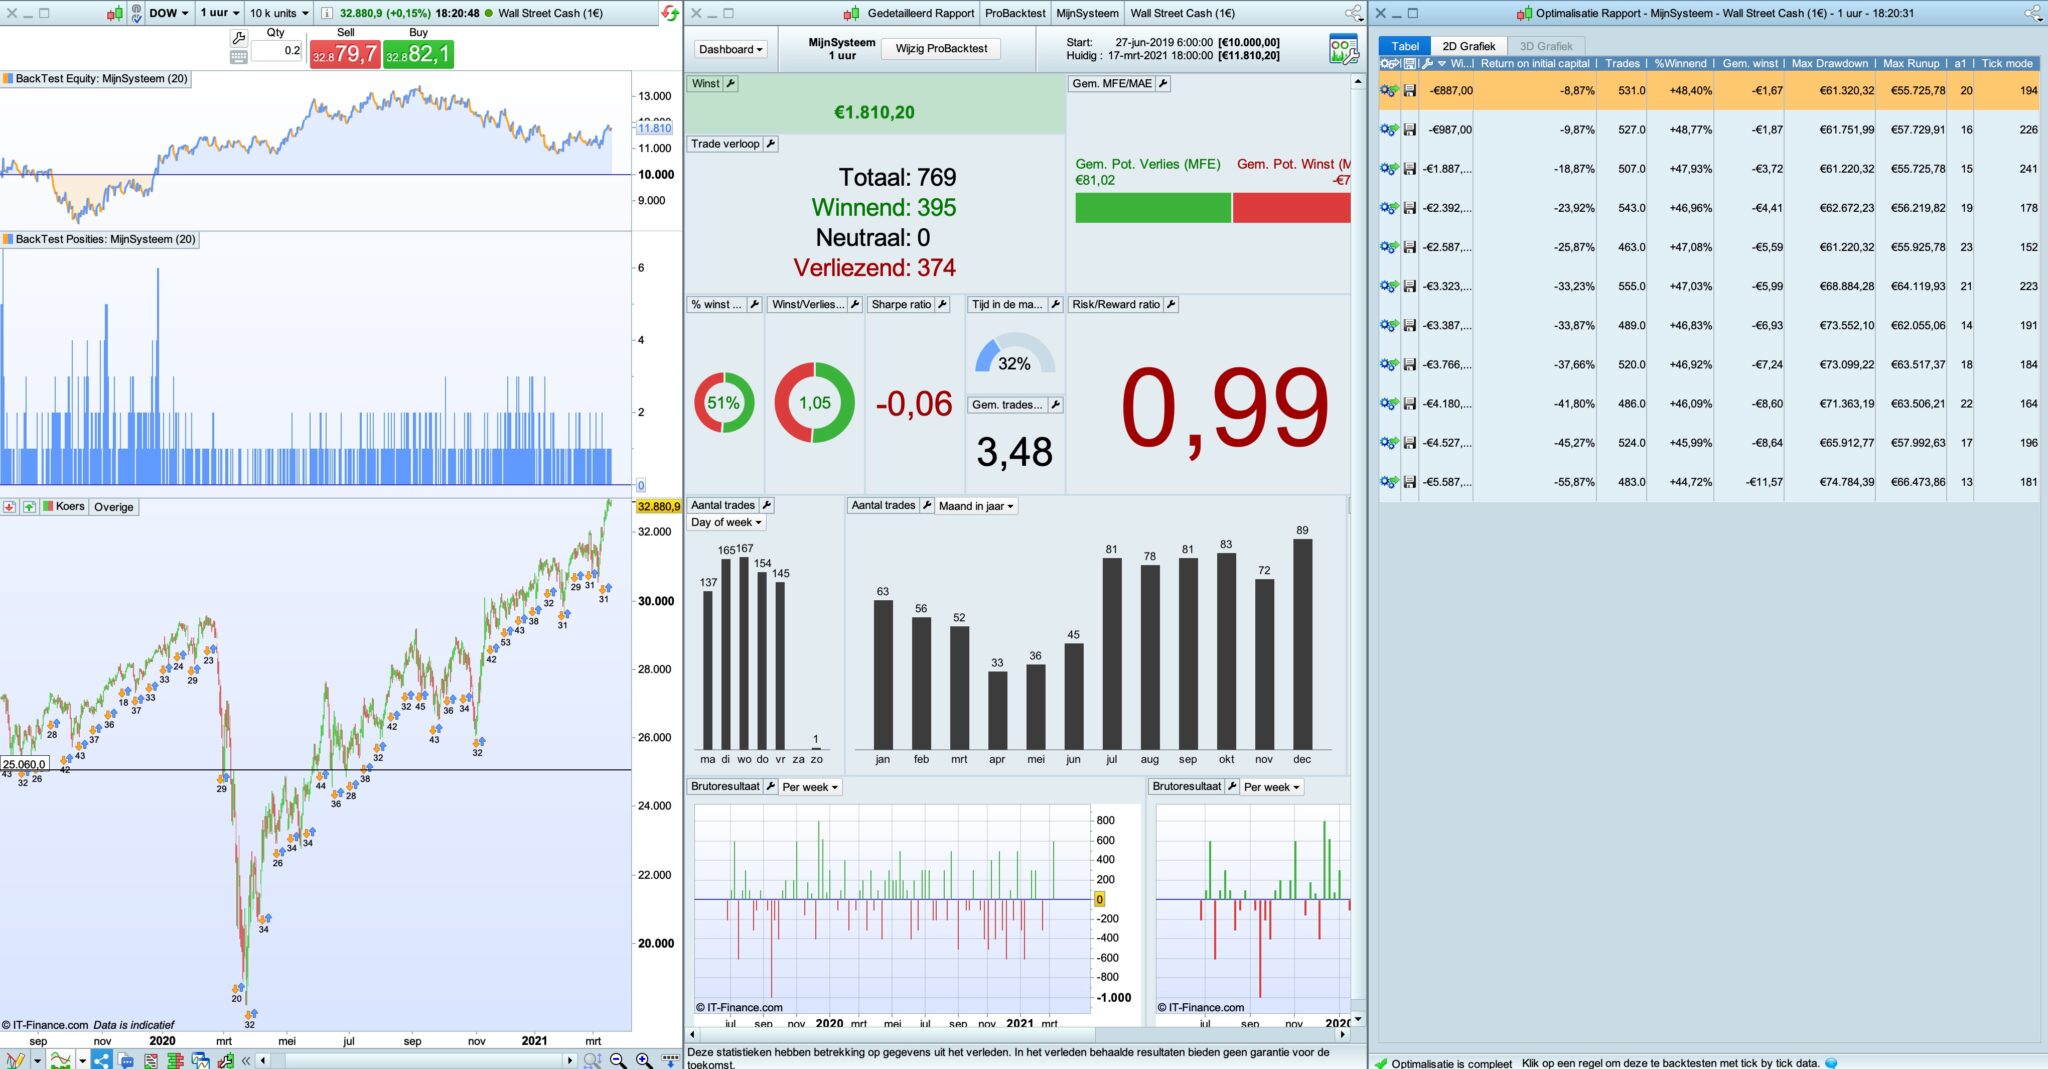
Hi, Why are optimisation results completely off with cumulative orders when comparing optimisation results to detail rapport & equitycurve.
What I also notice is there is no market position if stoploss or target is reached in one bar. That I know and maybe explains why in the rapport are more trades compared to in the optimisation window? Are those skipped in calculation in optimisation ?
Looking at the chart when a position is openend & closed. It seems to work all correct. Just optimisation is useless and that’s the most important part!
Used stop orders, high or high[1] both result in bad calculation.
Any tips or is cumulative orders just bugged using optimisation?
test code is this on dow 1 hour, no spread / with tickbytick
defparam cumulateorders = true
defparam preloadbars=2000

//optimise a1 13 to 23

condbuy=close>open

if condbuy then
if hour=4 then
buy 1 contract at high stop
elsif hour=8then
buy 1 contract at high stop
elsif hour=10 then
buy 1 contract at high stop
elsif hour=12 then
buy 1 contract at high stop
elsif hour=a1 then
buy 1 contract at high stop
endif
endif

set stop $loss 100
set target $profit 100
I’ve had exactly the same problem, it’s very frustrating. You have to make a detailed report of each permutation in order to see which works best, and sometimes the best one is way down the list.
I only use the WF optimization now. I may not be getting the best configuration but at least the decision is made for me and i dont even see the other options.
Optimization are not made with tick by tick. So orders can trigger during a candlestick, but you don’t know precisely when (before or after a previous order that have triggered a profit or a loss). More other, without tick mode we can’t be sure that targets are triggered before loss and vice-versa, therefore results can be rather different with a normal backtest that use the intrabar tick by tick checking.
Nicholas, do you happen to know the internal workings of the WF optimization? Is it able to compare the tick-by-tick results of different permutations? or does it just take the top result (without tbt) and then produce a detailed tbt report, similar to normal optimization?
Indeed, WF, just as classic optimization, doesn’t use the tbt mode. It uses the same engine for backtests as per the classic optimizer.
PaulParticipant
Master
thnx Nicolas for the clarification.
I just want to add, looking at the chart, you see prices in above code with every time +100 or -100.
For i.e. 2 long positions, one added later and both are closed at the stoploss respectively set for each position (correct)
Then in the detailed rapport tap for transactions, each of the 4 transactions is the same as the price on the chart. Correct again.
But in the closed positions tab, the stoploss & profittarget results are not based on each entry separate, but is calculated from the average positionprice to the stoploss/profittarget and as result in above case it’s not -100/-100 (twice the stoploss is hit) but i.e. -160,-40.
I don’t know how it can effect in that part i.e. winratio and other figures.
That it doesn’t use tick by tick in optimisation is a problem and using the positionprice to calculate profit/loss doesn’t work for the goal to test each signal too.
In above example, is there a way to use arrays and replace the set commands, so each additional position is tested if it reached stoploss or profittarget first and as result using tick by tick?
But in the closed positions tab, the stoploss & profittarget results are not based on each entry separate, but is calculated from the average positionprice to the stoploss/profittarget and as result in above case it’s not -100/-100 (twice the stoploss is hit) but i.e. -160,-40.
I’ve noticed this as well, a strange inconsistency. The only consolation is that, whatever the report is based on (average positionprice or individual entries), it will be the same for each test you run, so comparing performance between different values for that algo will still be useful. Probably not entirely valid to compare it to other algos that are not cumulative, especially the win %.