I thought it could have been an obsolete version.
Sorry. Try asking PRT.
 Mert
MertParticipant
Average
No problem. Thanks a lot anyway.
MertParticipant
Average
Roberto,
I am embarrassed to ask your help again because I have nothing to give back in return but I ask anyway, hoping for your goodwill.
I do not know how to write code for drawing a line. For example, I would like to have an option to draw automatically a horizontal line at the high, or low, of a, by me selected, 15 minute candle. I spend a lot of time to figure it out bud I cannot fix it and probably for you it is simple.
If it is unclear please do not hesitate to let me know.
Warmest regards and looking forward to hearing from you,
Mert
Like I dis in my first answer, when I drew two segments from X1 to X2 which are the number of the bars to begin and end drawing, and from Y1 to Y2 which is the price level where you want the line to be drawn.
Using the search box for DRAWSEGMENT, DRAWLINE, DRAWVLINE, DRAWHLINE you’ll fine many examples and documentation.
This is an example (https://www.prorealcode.com/documentation/drawhline/):
DEFPARAM DrawOnLastBarOnly = true
IF time = 100000 THEN
   Massimo = highest[2](high)
   Minimo  = lowest[2](low)
ENDIF
DRAWHLINE(Massimo) COLOURED(0,255,0,255)
DRAWHLINE(Minimo) COLOURED(0,255,0,255)
RETURN
If you remove or comment out line 1 you’ll understand what use it is.
MertParticipant
Average
I have managed to add the lines to my target candle. Its great. The only issue is that I need the line to START at the candle and draw, lets say 4 candles in the future. Does this have something to do with massimo and minimo? Or do I change something else.
Look at my first reply or documentation.
Use barindex to determine the two points, then use any price level at which you want the line to be drawn,
Hi Roberto,
Thank you for that “First hour BO” script. I was used to draw the manually into my chart – so this is way smarter 🙂
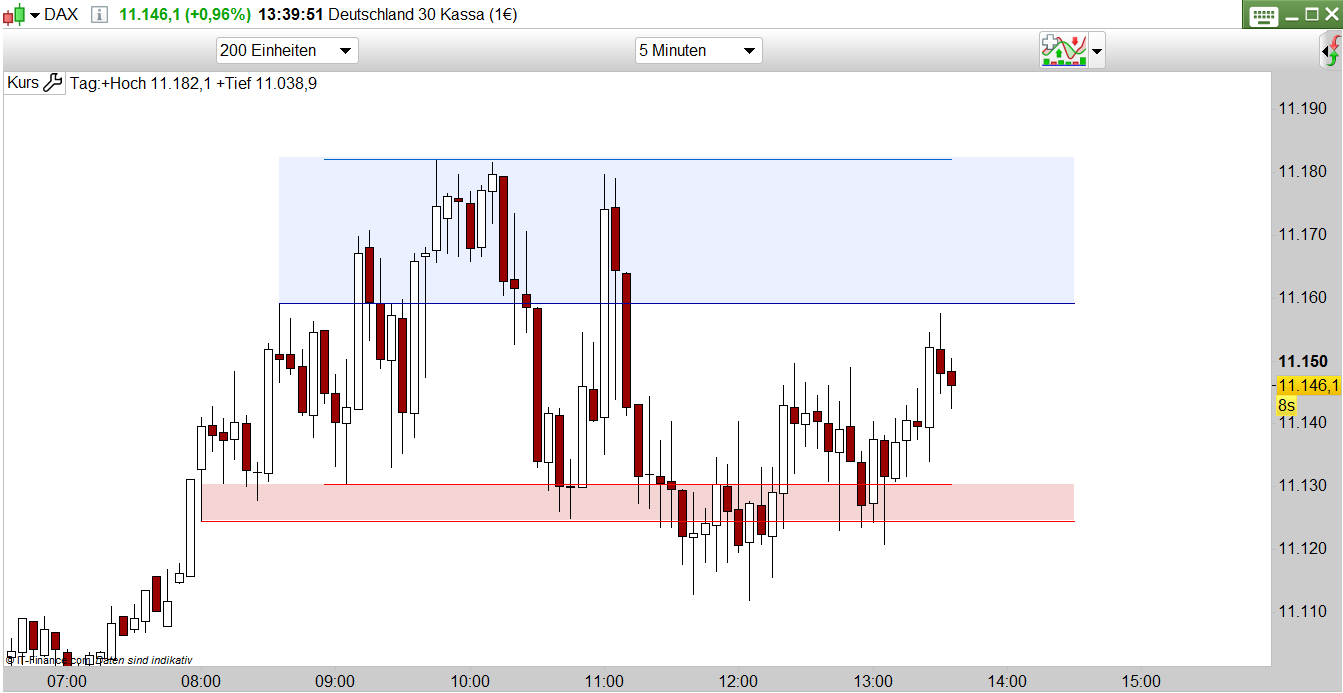
I do trade Dax and I would like to have two “First hours” in my chart. First hour of the Future market (8.00 – 9.00) and Dax Kassa (9.00-10.00) and (if possible) fill the upper two lines of the highs with a colour and the lower two lines with another colour – that should give me a zone of future and kassa first hour. See attached screenshot which is a mix of your script and manually drawn.
Can you help me?
Best regards!
There you go:
DEFPARAM CalculateOnLastBars = 1000
DEFPARAM DrawOnLastBarOnly   = True
IF IntraDayBarIndex = 0 THEN
   Max1  = 0
   Max2  = 0
   Min1  = 999999
   Min2  = 999999
   BarID = 0
ENDIF
IF OpenHour = 08 THEN
   IF BarID = 0 THEN
      BarID = BarIndex
   ENDIF
   Max1 = max(high,Max1)
   Min1 = min(low,Min1)
ENDIF
IF OpenHour = 09 THEN
   Max2 = max(high,Max2)
   Min2 = min(low,Min2)
ENDIF
IF time >= 100000 AND time <= 230000 THEN
   DRAWRECTANGLE(BarID,Max1,barindex,Max2) coloured(255,0,0,255)
   DRAWRECTANGLE(BarID,Min1,barindex,Min2) coloured(0,255,0,255)
ENDIF
RETURN
rectangles cannot be coloured other than the default color (only PRT can do that when you draw them manually on the chart), only the border color can be changed.
Thank you so much, Roberto! Well done.
Hi Roberto,
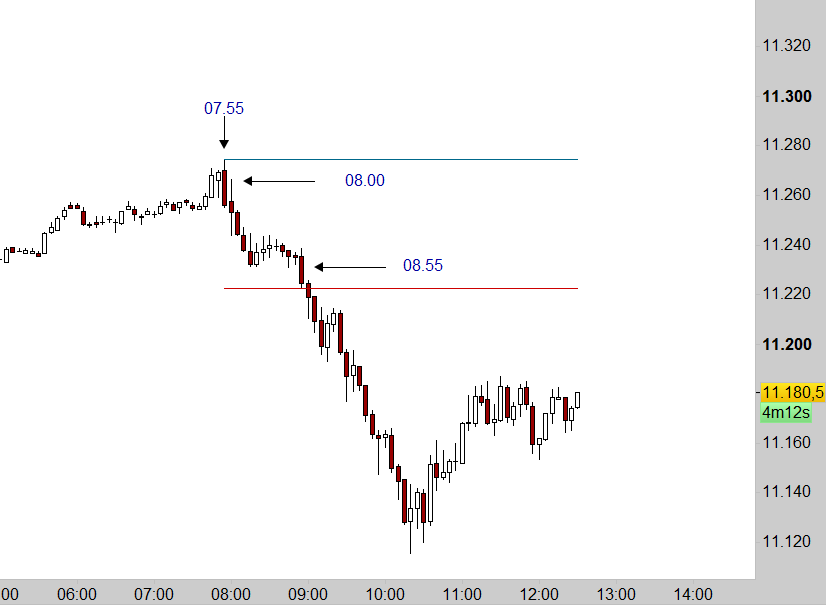
i might have an issue that I do not understand. The “Breakout” script (08.00 to 09.00 o´clock) works fine BUT it starts to count with the 07.55 candle. The real high of the first hour indeed was the candle that I pointed to with a black arrow. The low is displayed correctly, as the script measures the low of the 08.55 candle.
You have any idea why the fist candle is conted at 07.55 in this 5-Minute-chart?
Best regards!
//DEFPARAM DrawOnLastBarOnly = true
DEFPARAM CalculateOnLastBars = 1000
IF time <= 080000 THEN
hh = 0
ll = 999999
ENDIF
IF time = 080000 THEN
MyBar = barindex
ENDIF
IF time >= 080000 AND time <= 090000 THEN
hh = max(hh,high)
ll = min(ll,low)
ENDIF
IF time >= 100000 AND time <= 220000 THEN
DRAWSEGMENT(MyBar,hh,barindex,hh) COLOURED(0,104,139,255)
DRAWSEGMENT(MyBar,ll,barindex,ll) COLOURED(205,0,0,255)
ENDIF
RETURN
To write code, please use the <> “insert PRT code” button to make code easier to read. Thank you.
It is due to the use of TIME, which refers to the current time when each candle closes (just before the next one opens). Use OPENTIME, instead, to achieve what you want
//DEFPARAM DrawOnLastBarOnly = true
DEFPARAM CalculateOnLastBars = 1000
IF opentime <= 080000 THEN
   hh = 0
   ll = 999999
ENDIF
IF opentime = 080000 THEN
   MyBar = barindex
ENDIF
IF opentime >= 080000 AND opentime <= 090000 THEN
   hh = max(hh,high)
   ll = min(ll,low)
ENDIF
IF opentime >= 100000 AND opentime <= 220000 THEN
   DRAWSEGMENT(MyBar,hh,barindex,hh) COLOURED(0,104,139,255)
   DRAWSEGMENT(MyBar,ll,barindex,ll) COLOURED(205,0,0,255)
ENDIF
RETURN
Thanks Roberto for the promt reply and help you provided.