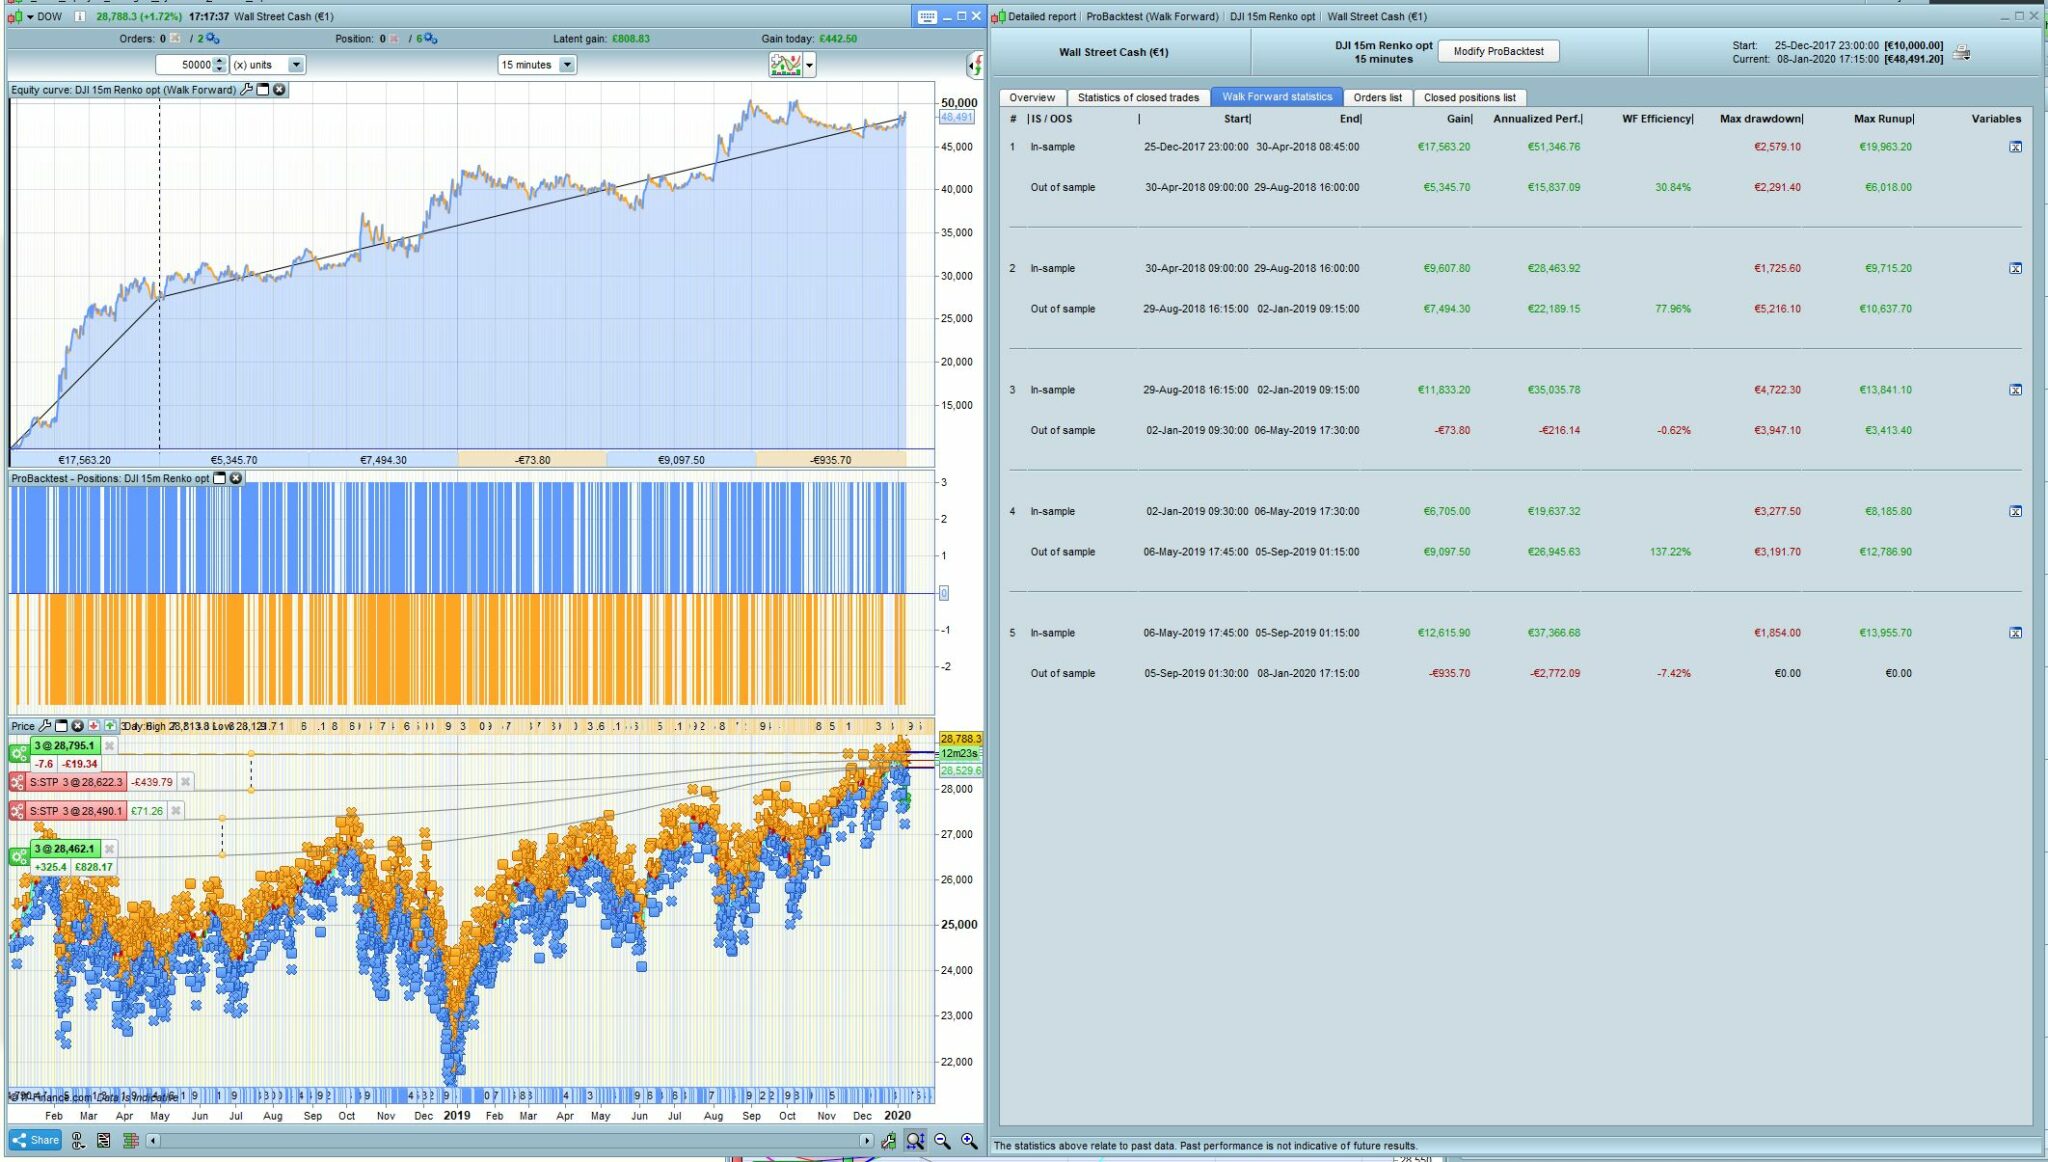
What I do is run it on the full 100k chart but select the start and end dates so as to alter the length of the IS/OS periods. I tried Jan to Dec 2018, which means a 2 month re-opt and that was better than the 4 month. Also ran it over 9 months, giving a 6 week re-opt, but that came out decidedly worse. I’ll try it monthly as well but looks like 2 monthly may be optimum for this baby.
The forward testing is doing nicely in demo over the last couple of weeks, also a DAX version, so could have potential.
It’s not my work, I hasten to add – the Renko part I found in the library and added the trailing stop part … which was written by Nicolas. I’m just a tinkerer…
You are just curve fitting recent history and hoping that curve fit works going forward
That’s true, and it may well be that this whole theory is wrongly based on a tendency of markets to trend. If they didn’t move in trends no one would be able to trade intelligently at all, you’d just pick stuff blindly with a 50-50 chance of going up or down. The big Q is whether the kinds of behaviour that makes an optimization work is also likely to trend into the future. All back testing must assume that to some extent, no?
We always start with the 50/50 the next candle will be up or down but then we look back a bit and say more of the recent candles have been up rather than down and then trend traders say ‘so the next one is more likely to be up’ and mean reversal traders say ‘so the next one is more likely to be down’. In the long run 50% of the time our decision will be right and 50% of the time it will be wrong no matter whether we are a trend trader or a mean reversal trader.
So if you re-optimise in the hope that recent history will do the same in the future you have 50/50 chance of hitting the jackpot or of being totally wrong or even more wrong if you try to fight the markets natural tendencies. Sometimes the market we are trading will give the long side an edge as major long term investment instruments will always go up (even if they sometimes go down quite a bit during their journey up).
Candle by candle, yes. But once a moving average or stochastic changes direction it’s obviously not 50-50 whether it continues in that direction. Otherwise I wouldn’t get all those nice coloured lines making peaks and troughs. That’s the kind of trend I’m talking about. There’s really only 3 options, trending up, trending down or deeply annoying choppy sideways (not counting the crazy 200pt moves on breaking news or a Trump tweet). Can’t understand why it’s so hard to find a combination of variables that deal well with these 3 basic situations that you find again and again on all timeframes.
But what’s your approach to optimization then? You do a 70/30 WF with as much data as you can get, let’s say the OS performance is -86%, +108, +12, -33, +42. Then what?
But what’s your approach to optimization then?
To avoid it as much as possible by using mainly price action. If a strategy I create has one indicator with one variable that upsets me so I have to make sure that that one indicator works over a very broad range of variables. If it doesn’t and works great in one section of data with a value of 10 and the next with a value of 100 but a value of 10 would have failed then that strategy is straight in the bin. If I end up with two variables then they have to work over a very broad range of combinations. The 3D heat map in v11 is good for checking this out.
Market character is always changing and so finding one set of indicators with one set of values that work in all conditions (including a future market character that we may never have seen before) is like looking for the holy grail.
The 3D heat map in v11 is good for checking this out.
IG really have to pull their finger out and give us the update!
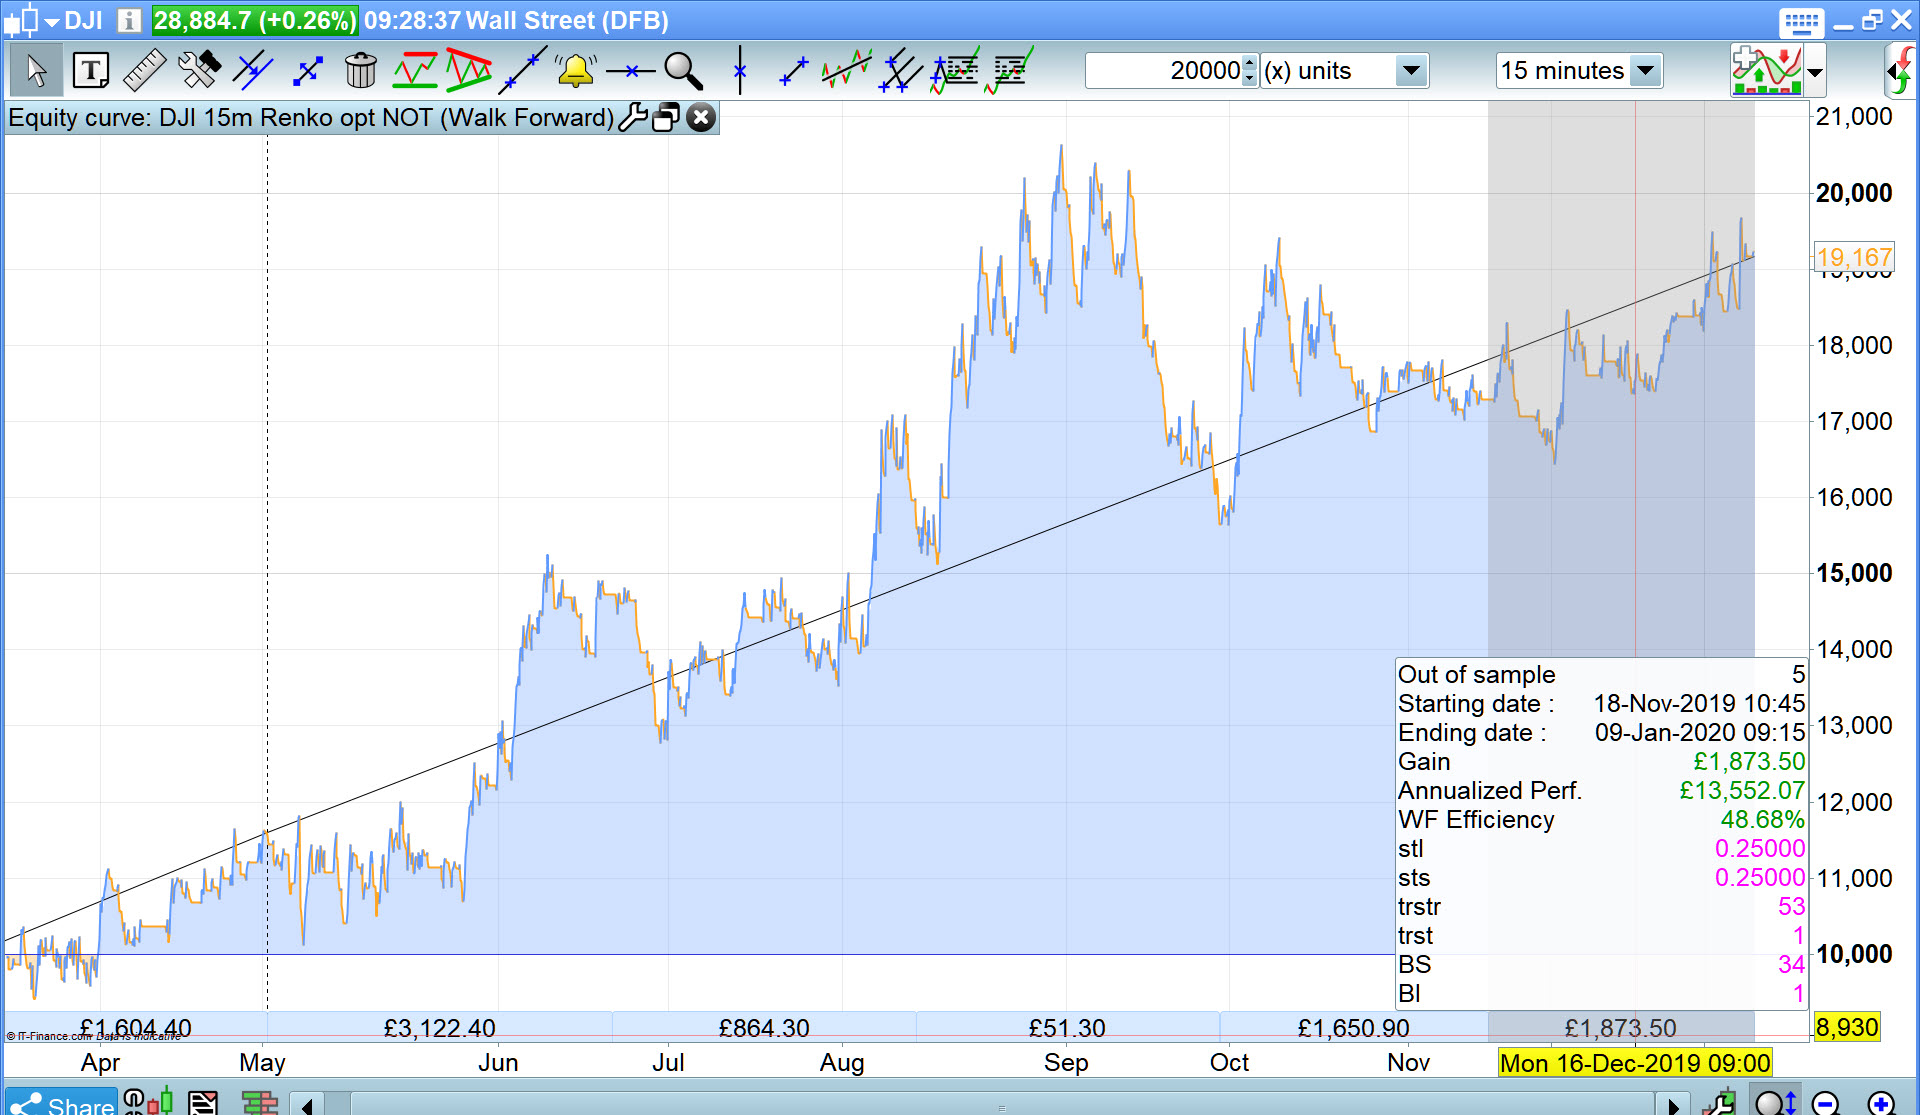
Results attached for WF over 20K bars on the Renko … 9K Profit with all periods in profit, and WF Efficiency 35%.
That looks pretty healthy. Would translate in the real world to re-optimizing every ~7 weeks.
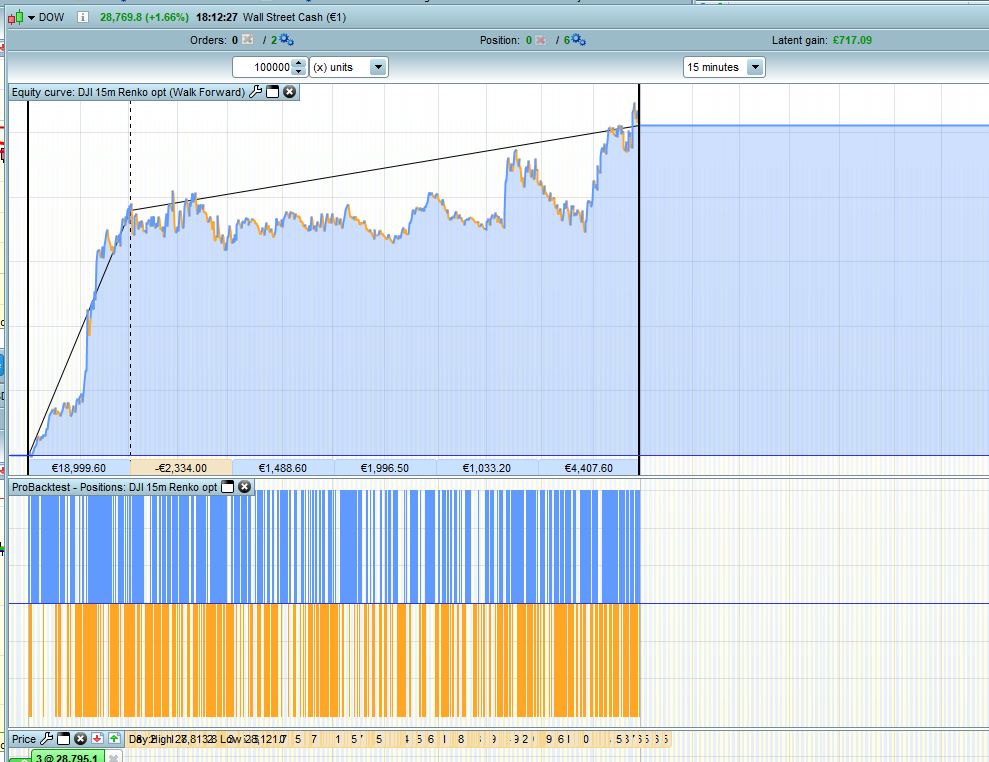
Attached is what I got for the 2 month, looking at each year separately. Interesting that for 2019 the graph looks broadly similar to yours but the profit figures don’t match up at all, just with an extra week or so in the period.
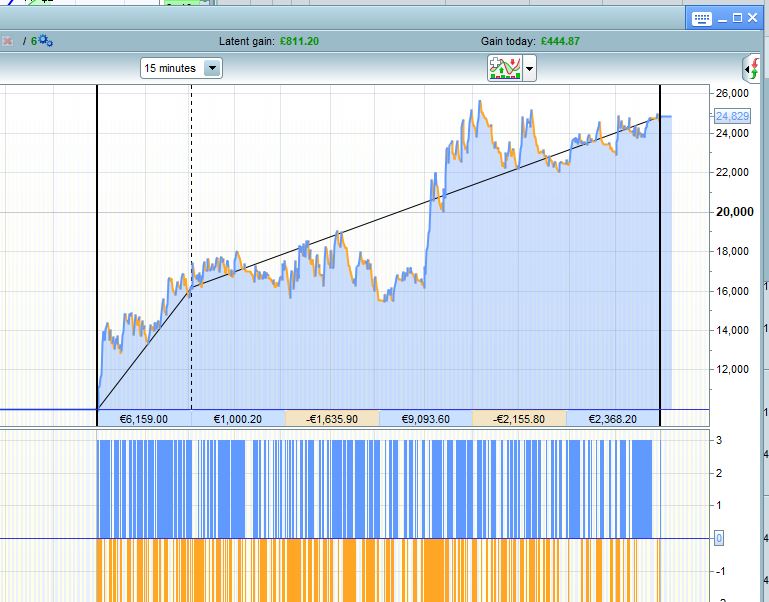
Also the 4 month result over 2 years, which I realised after a bit more analysis actually out performs the 2 month. I’m now trying a 4month optimization on a monthly basis.