Tried 3 modes of re-optimizing; monthly for 30 days, monthly for 90 days and quarterly for 90 days. The second option gave a slightly better result.
Indeed, this is how you should make your robustness tests with the walk forward tool. If you find it more suitable to your expectations, then this is how you should re-optimize it in the future.
As Vonasi said, keep in mind that every choice we make is in fact something we therefore tend to over-fit. Choosing to re-optimize the strategy every 90 days is overfitting it. But since, we don’t know the future, there is no other way to deal with robustness testing.
With version 11, optimizing strategies is better: optimize on other criteria than profit (which has better sense to me!) and with the 2D/3D variables chart, more ‘clever’ choices are possible.
Hey good you used that System as I did also and my results support our theory!
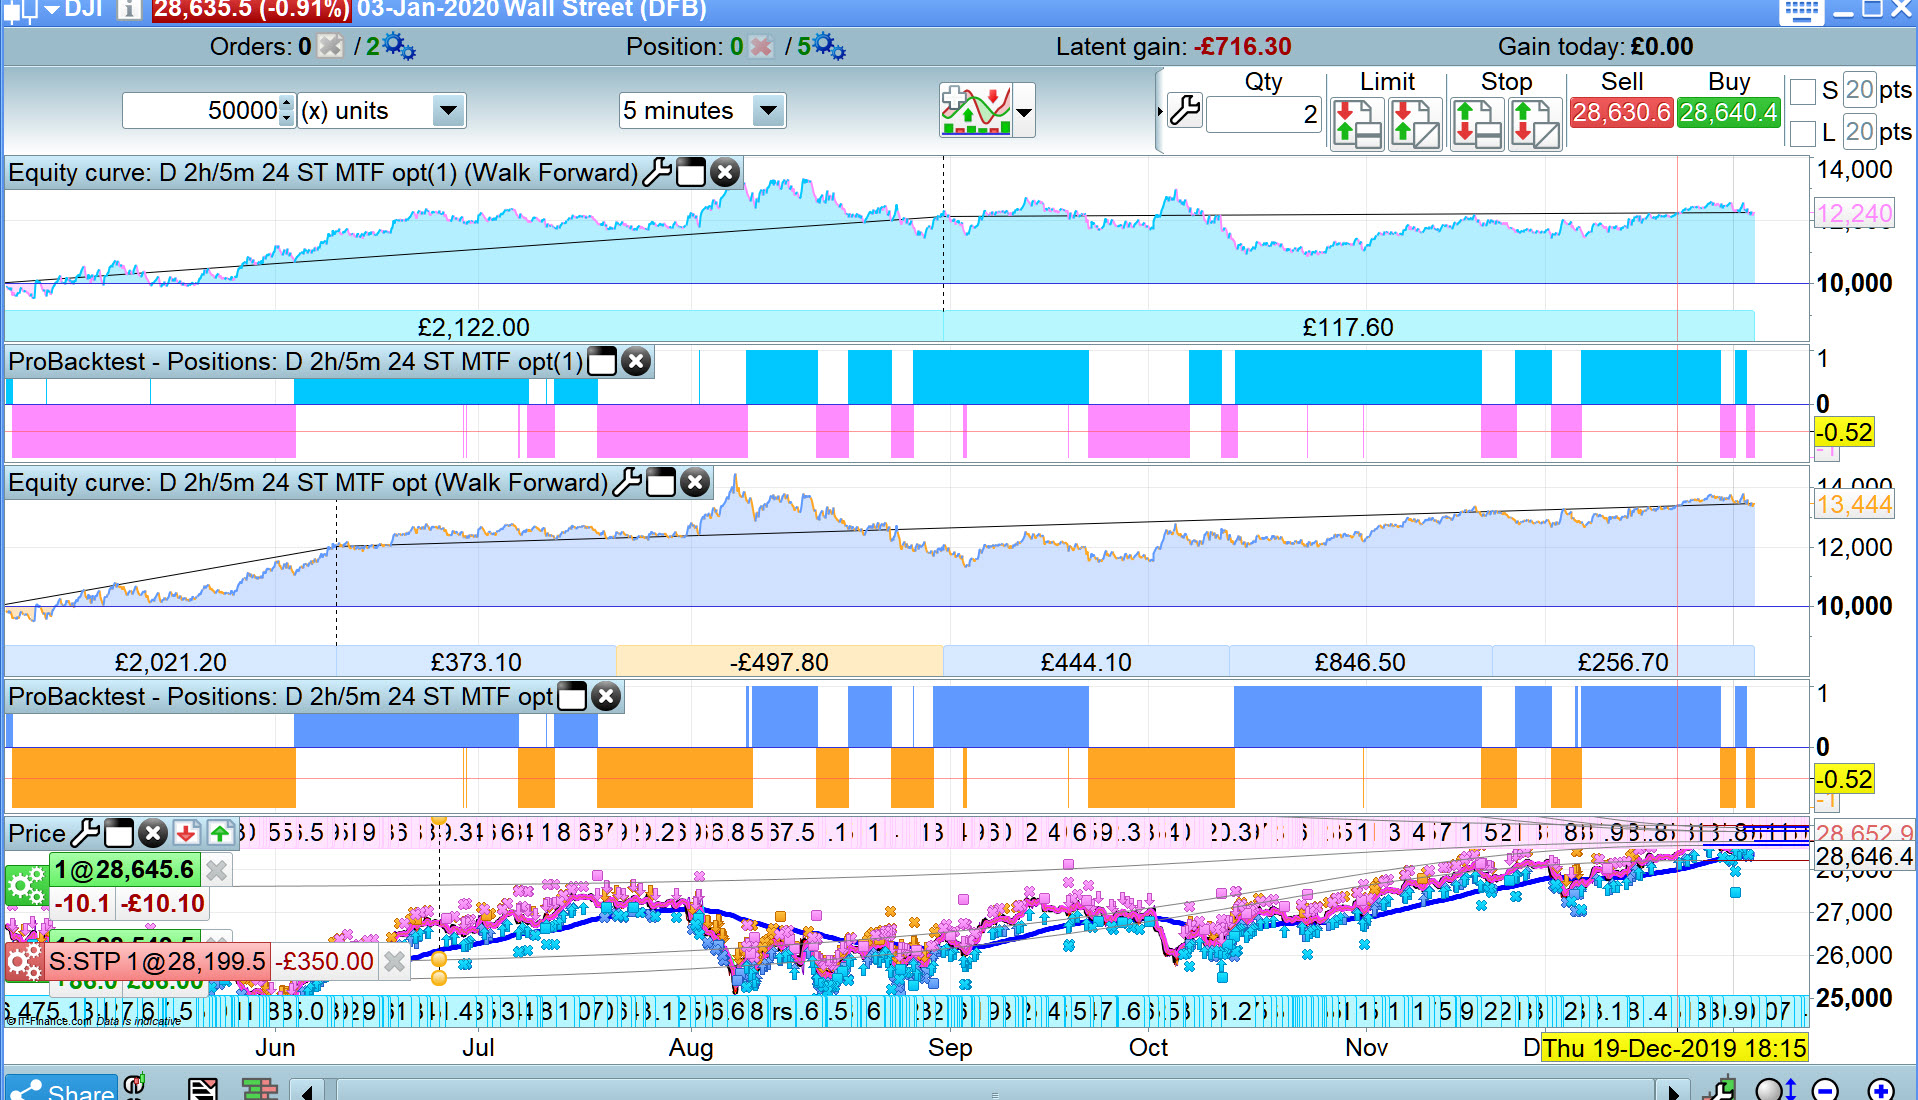
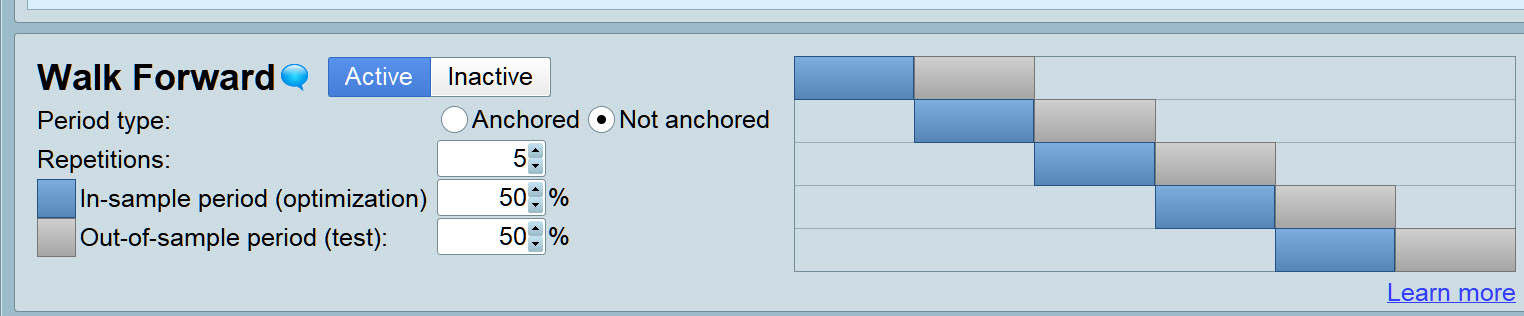
1. Image 1 lower curve shows results for WF as per Image 2 (10K IS / 10K OS over 50K bars)
Profit – £3444 over 50K bars.
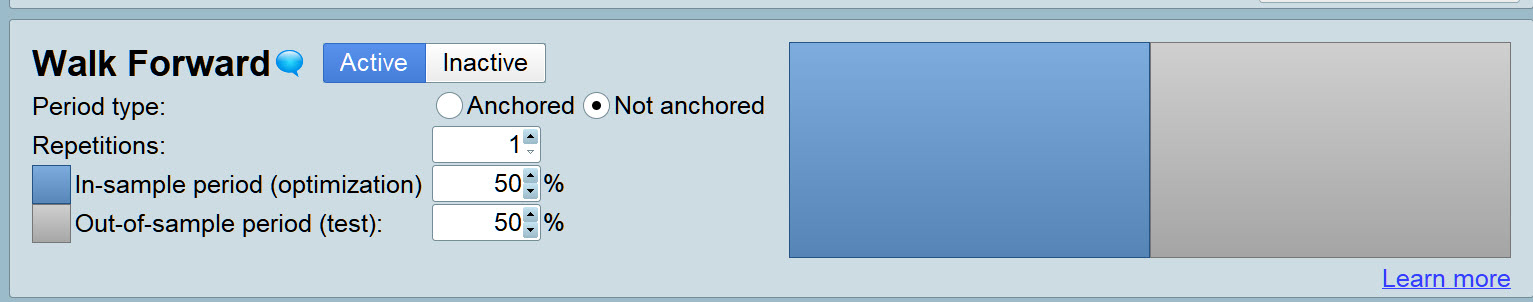
2. Image 1 upper curve shows results for WF as per Image 3 (25K IS / 25K OS over 50 K bars)
Profit – £2240 over the same 50K bars as Item 1 above.
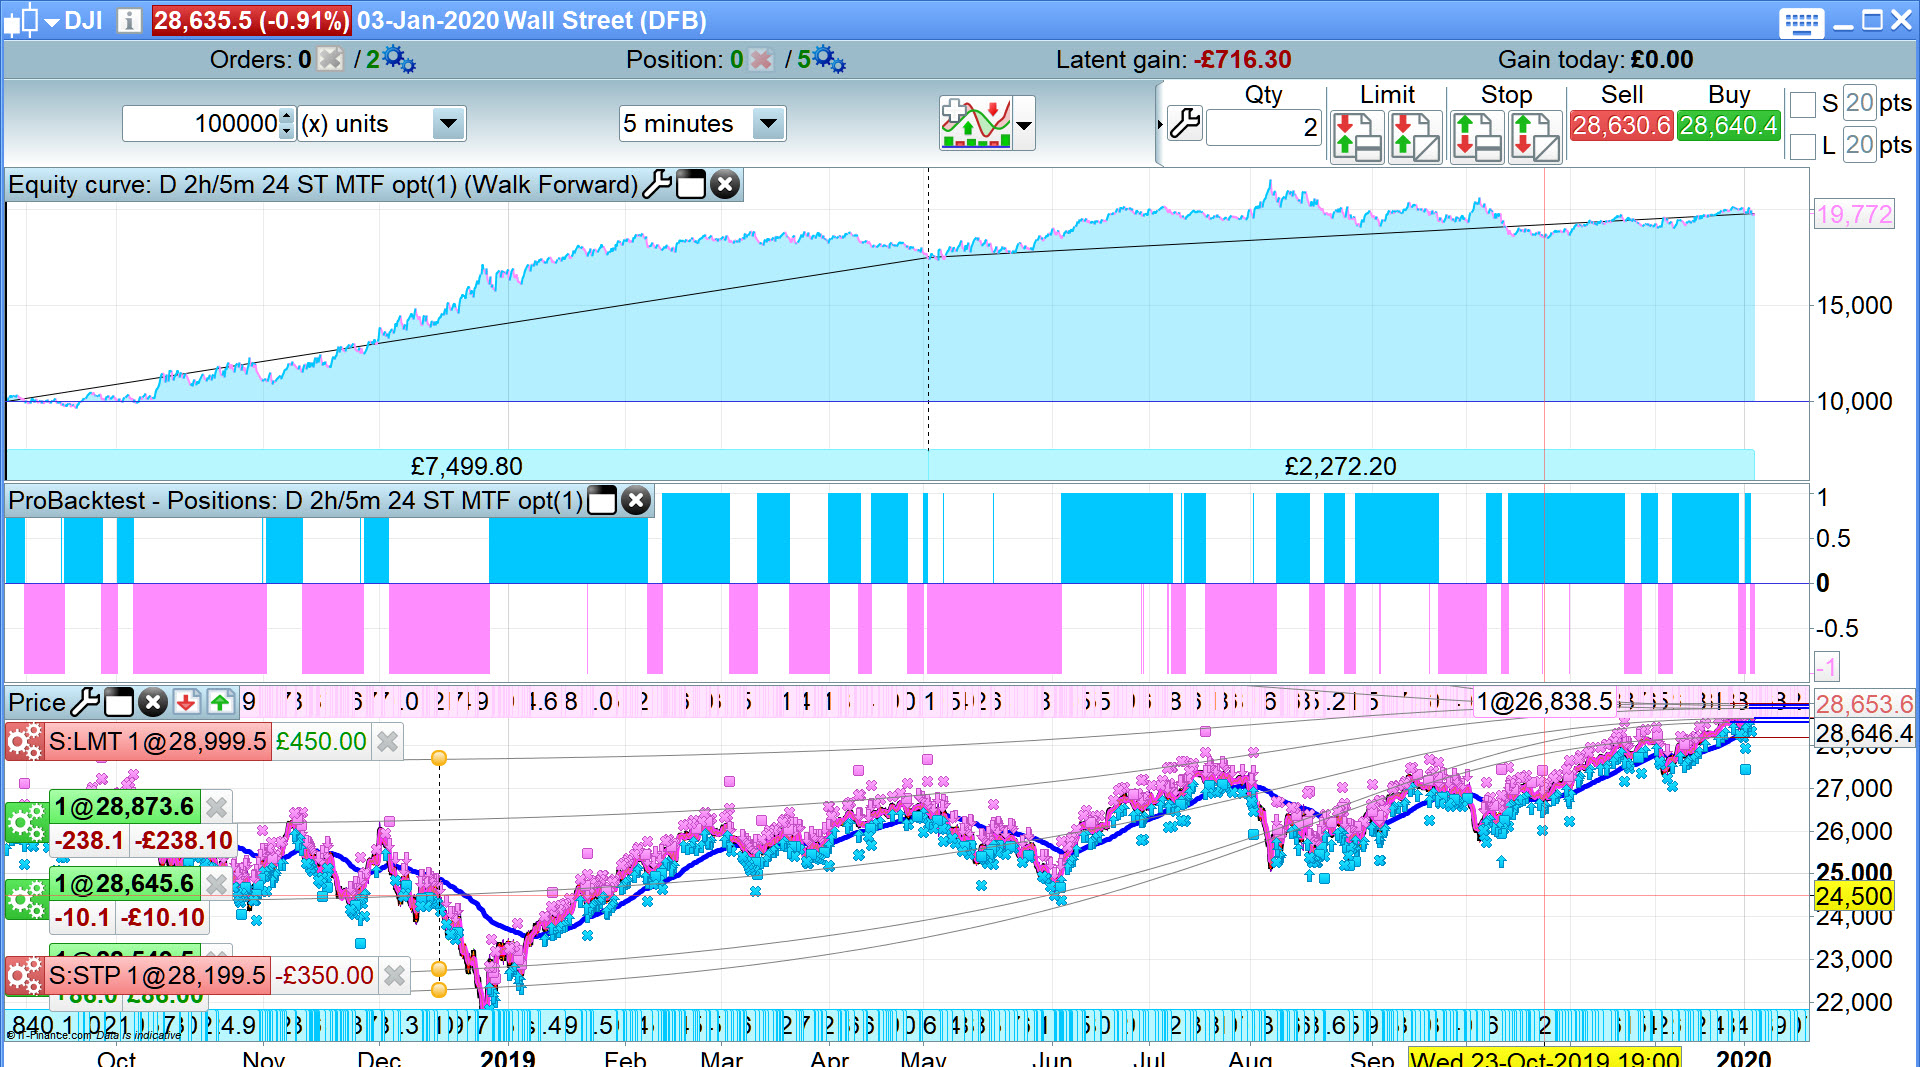
3, Image 4 curve shows results for WF as per Image 3 (50K IS / 50K OS over 100K bars)
Profit – £2272.20 over the same 50K bars as Item 1 above.
With version 11, optimizing strategies is better: optimize on other criteria than profit (which has better sense to me!) and with the 2D/3D variables chart, more ‘clever’ choices are possible.
Thanks Nicolas, eagerly awaiting v11 for IG!
1. Image 1 lower curve shows results for WF as per Image 2 (10K IS / 10K OS over 50K bars) Profit – £3444 over 50K bars.
That does seem potentially promising – certainly your results look better than mine! How would you continue it going forward though? 10k bars on a 5m chart would represent about 6 weeks of trading, no?
How would you continue it going forward though? 10k bars on a 5m chart would represent about 6 weeks of trading,
6.94 weeks?
I reckon I will Forward Test (Demo) 2 versions …
- Version 1 – re-optimise on nearest weekend to 1st of every month (monthly).
- Version 2 – re-optimise on nearest weekend to 1st of every alternate month (2 monthly).
As we will be losing the result of Profit / Loss figures (by restarting etc) we need to make a note in the Notes facility or even better enter the running total as part of the System Title.
Sounds like a plan. I think I’m more inclined towards the 2 month model. The 90 day re-opt on a monthly basis def seemed better than 30 days monthly. A 10k re-opt every 2 months could be the sweet spot. Hmm, I could backtest that…
Image 1 lower curve shows results for WF as per Image 2 (10K IS / 10K OS over 50K bars) Profit – £3444 over 50K bars.
Just looking at this again, in Image 2 there are 6 discreet sections over 50k bars … doesn’t that mean that each test is actually 8.3k IS / 8.3k OS ? Probably it doesn’t matter test-wise, but going forward I would have to convert that into a timeframe, so perhaps closer to 6wks than 2 months? Unless I’ve misunderstood completely…
Good question and I’d like to say I have enjoyed our collaboration on this Topic.
If you look at the image attached there are 5 x IS and 5 x OS and the 6th period is an OS period would be due to become next re-opti period (if we were Live running).
So isn’t attached showing us a running 10K period for re-opti?
If from the first IS to end of the last OS is 50k bars then I think each section can only be ~8.3k, but I’m feeling my way around here and that WF tool is still a bit of a mystery to me.
And yes, I have enjoyed the collaboration too – beats fishing in the dark! (I’m David, btw)
I just did the WF again and you are correct … each period is 6 weeks (over a 50K bars WF)
WF runs loads faster in the week during the day than at the weekends.
Where are you roughly, nearest town? I am near Chester.
Mmm I must have caught the PRT servers in a good moment … WF has slowed again now to crawling pace. Frustrating and saps enthusiasm! I hope v11 is faster with it’s (up to) 1,000,000 WF bars available!?
I read your bio so I know where you are now! 🙂
Is the speed limited on the PRT side then? I thought it was just my aging hardware. (Prob both!)
Yes, I’m down in the smoke, NW London. Chester is beautiful!
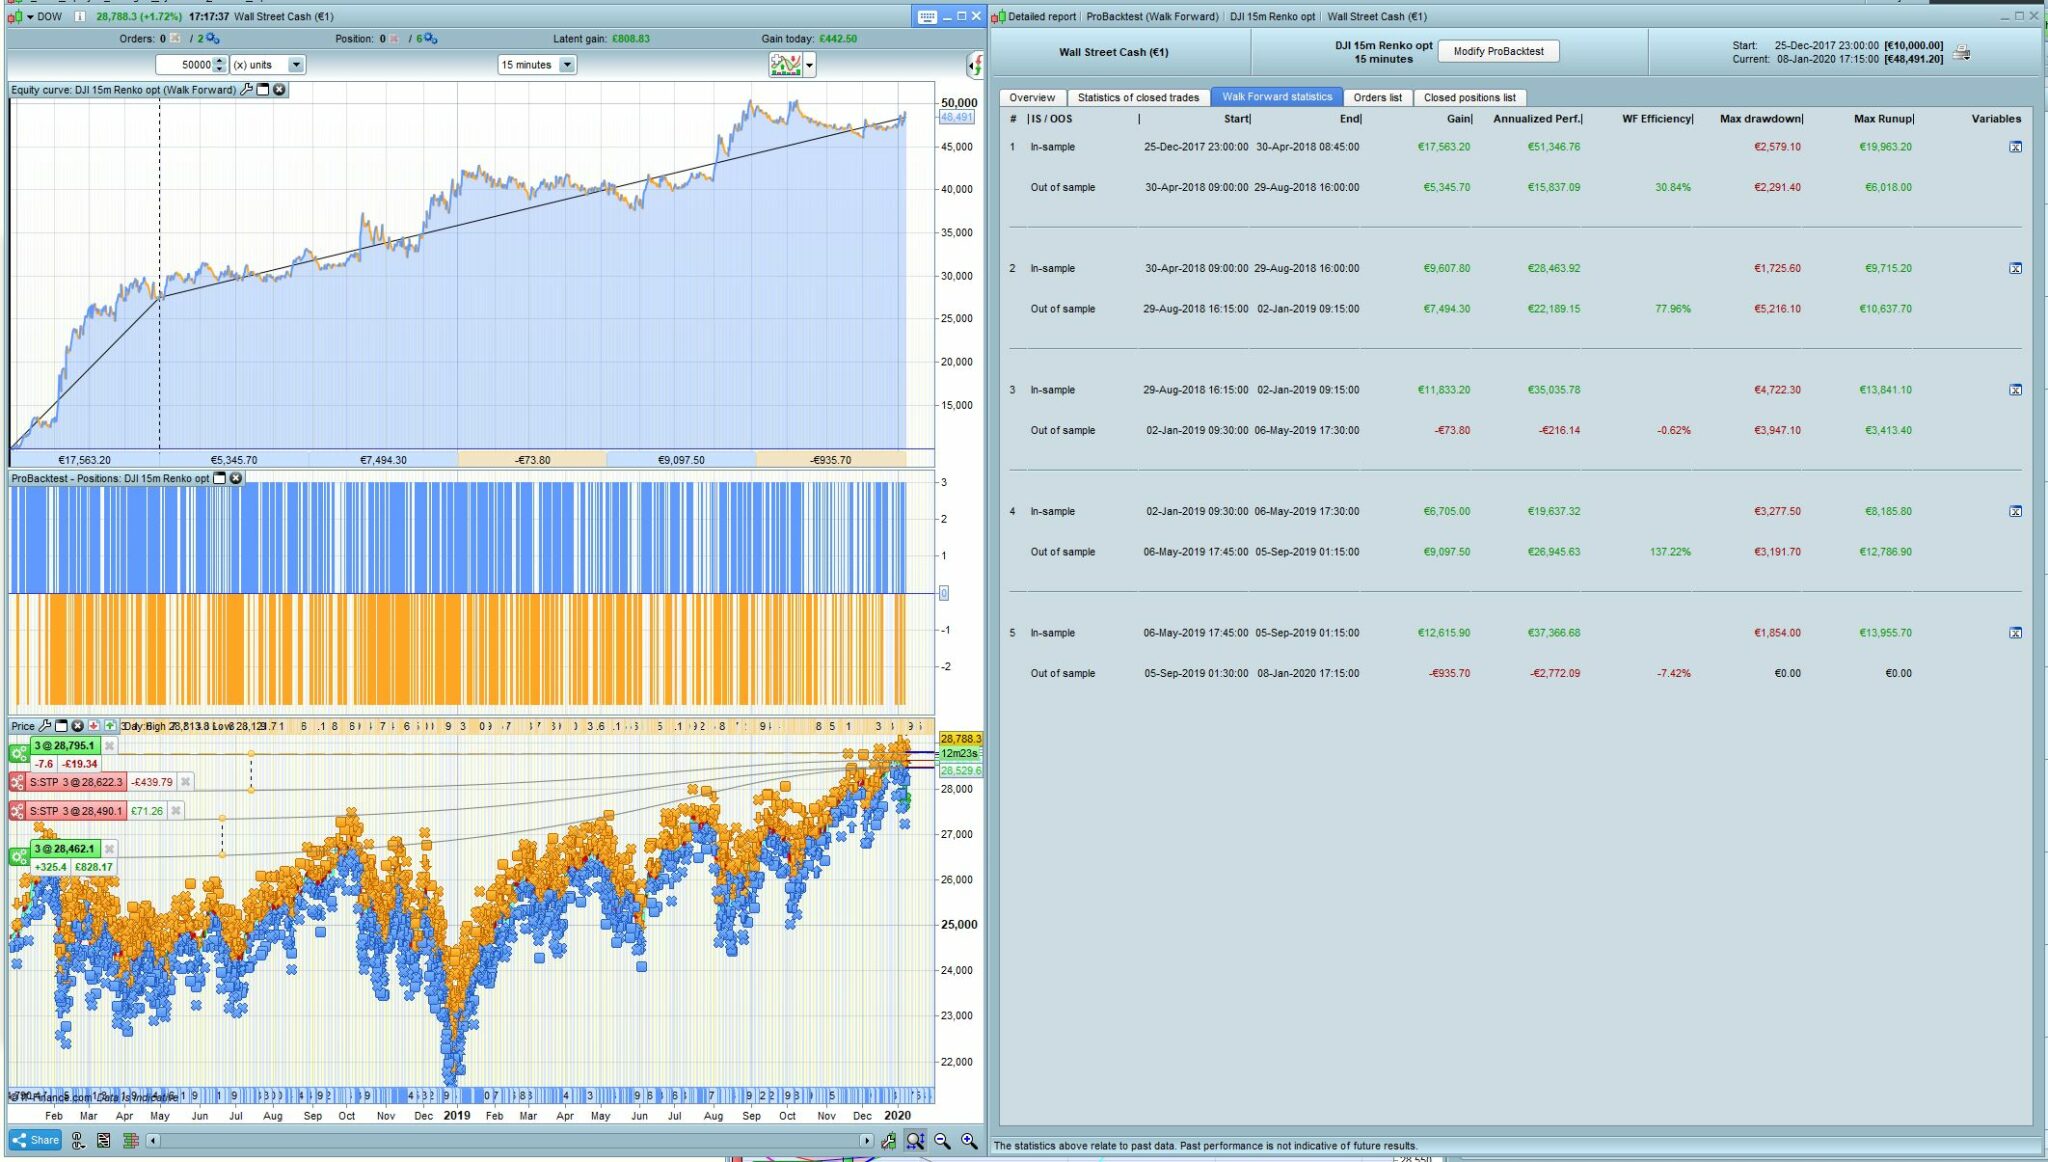
This is another one I’m working on, just tried it with your 50/50 WF method but forgot that 50k bars on a 15m chart is a much longer timeframe so I ended up with 4 month IS/OS.
3 out of 5 the OOS is still healthy, but how do you use the WF in the right hand pane? Choose the one that performs best OOS and use that as a starting point?
Yeah it’s difficult to choose the results of a losing WF period, but without the optimum results the loss could be worse?
How about doing a WF over a shorter period – maybe 25k or 30K bars – as it could be that your Renko System may need to be optimised more regularly than 8.33k bars in order to produce profitable results??
I’ll do a WF also on your Renko … I’ll WF over 20K bars, maybe you try 30K bars?
Yeah it’s difficult to choose the results of a losing WF period, but without the optimum results the loss could be worse?
I guess that this is one of the problems that I have with regularly re-optimising. You just had a section of data that you traded with some set variable values from a previously optimised section of data and you made a loss and then you optimise that data and it tells you that you should have been using totally different values but you would still have made a loss, just a smaller loss but then lets say that you add that section of data to the previous section of data and optimise that – you would have made a profit with totally different values but is it more than the two data samples traded with different values?
Which optimised values do you persuade yourself will work best in the upcoming data – the values that made a profit but maybe less than the values that made a profit and then a loss?! You are just curve fitting recent history and hoping that curve fit works going forward or you are saying that you didn’t like the data you curve fitted to and so adding more data till you find a curve fit that made a profit and an equity curve that you like.