I’ve had a problem with the detailed report in V12 for days… usually after an optimization or starting a backtest, no drawdown value or a completely stupid drawdown value is displayed. If I close the detailed report and reopen it from the back test, the values are correct again. In addition, only the overall performance is displayed in the overview. The Long and Short columns are empty. So no individual performance. If I now close the report again and reopen it, the long and short values are listed individually again, but… only the total drawdown in the far left column, long and short drawdown is empty. I noticed it in the demo account a few days ago and didn’t think anything of it. But now I notice that there is the same problem in the live account.
Anyone else with this phenomenon? Is there a solution for this? Do I actually have a disadvantage if I switch completely back to V11? The problems in V12 are slowly getting out of hand.
The Long and Short columns are empty.
I experienced above yesterday in Demo Account.
Any idea what that could be?
The problems in V12 are slowly getting out of hand.
I agree, but we need to be advising PRT of the problems else v13 will come out with the same problems!
We need to get into the habit of submitting a Technical Report as soon as others say (on here) they are experiencing the same Issue. Trouble is, I’m sure loads of users can’t even be bothered to type … Yes I get the same problem??
I am not pointing fingers as I am as guilty as anybody of not submitting Technical Report to PRT …so this is now my belated New Year Resolution!
I have noticed this just in the last week. Max drawdown is frequently not calcuated and more often, Time in Market and Avg Orders / day are not calculated, unless I go to the backtest graph and request a detailed report, and then all the figures appear – I don’t need to close the previous report first, it just updates with everything showing. I log around 100 backtest every week into Excel, so to be sure I am recording the correct info I have to request a Detailed Report “manually” for every system’s backtest. It’s ridiculous. I agree however with GraHal and will be submitting a Technical Report in the morning. I have to agree also with phoentzs … V12 is too buggy and it has really knocked my confidence in using PRT.
The Long and Short columns are empty. So no individual performance. If I now close the report again and reopen it, the long and short values are listed individually again
@phoentzs did you report above to PRT via a Technical Report?
The bug is still there and it is getting more annoying the longer it is not fixed!
That’s strange, I thought I had posted on this a couple of weeks ago but my post isn’t showing so maybe I did not submit it correctly. Anyway, I’ve noticed the same thing. I agree V12 is way too buggy and I agree with Grahal that these issues need to be properly reported. What I have noiticed is missing data in the rerpot, exactly as noted in your posts. Also calculations that are oviously wrong – most notably the Max Drawdown.
It seems only to happen with the report is generated automatically at the end of a backtest. Clicking on the chart menu to generate a detailed rerport seems always to produice the correct report. I run a log of appox. 90 systems and update with a new backtest every week, so having to manually click the chart to regenerate the Detailed Report with the correct data each time for every system is ridiculously time consuming and open to errors if I inadvertently miss one and inout incorrect or incomplete data.
I submitted a tech report over two weeks ago and they are working on it. I chased it up last week and they are still working on it. The problem still exists though and I think it is concerning that it is taking them so long to get to the bottom of something so fundimental.
The more people that report it the better.
Ah – I just noticed my provious post is there after all … hopefully my latest post is useful though and if anyone experiencing this hasn’t reported it would encourage them to do so.
@Nikolas @Robertogozzi
Can you confirm the problem? Will this problem finally be fixed? It doesn’t matter whether you use a 10k chart or a 200k chart, there are fundamental calculation errors. You can’t work with a base like that!
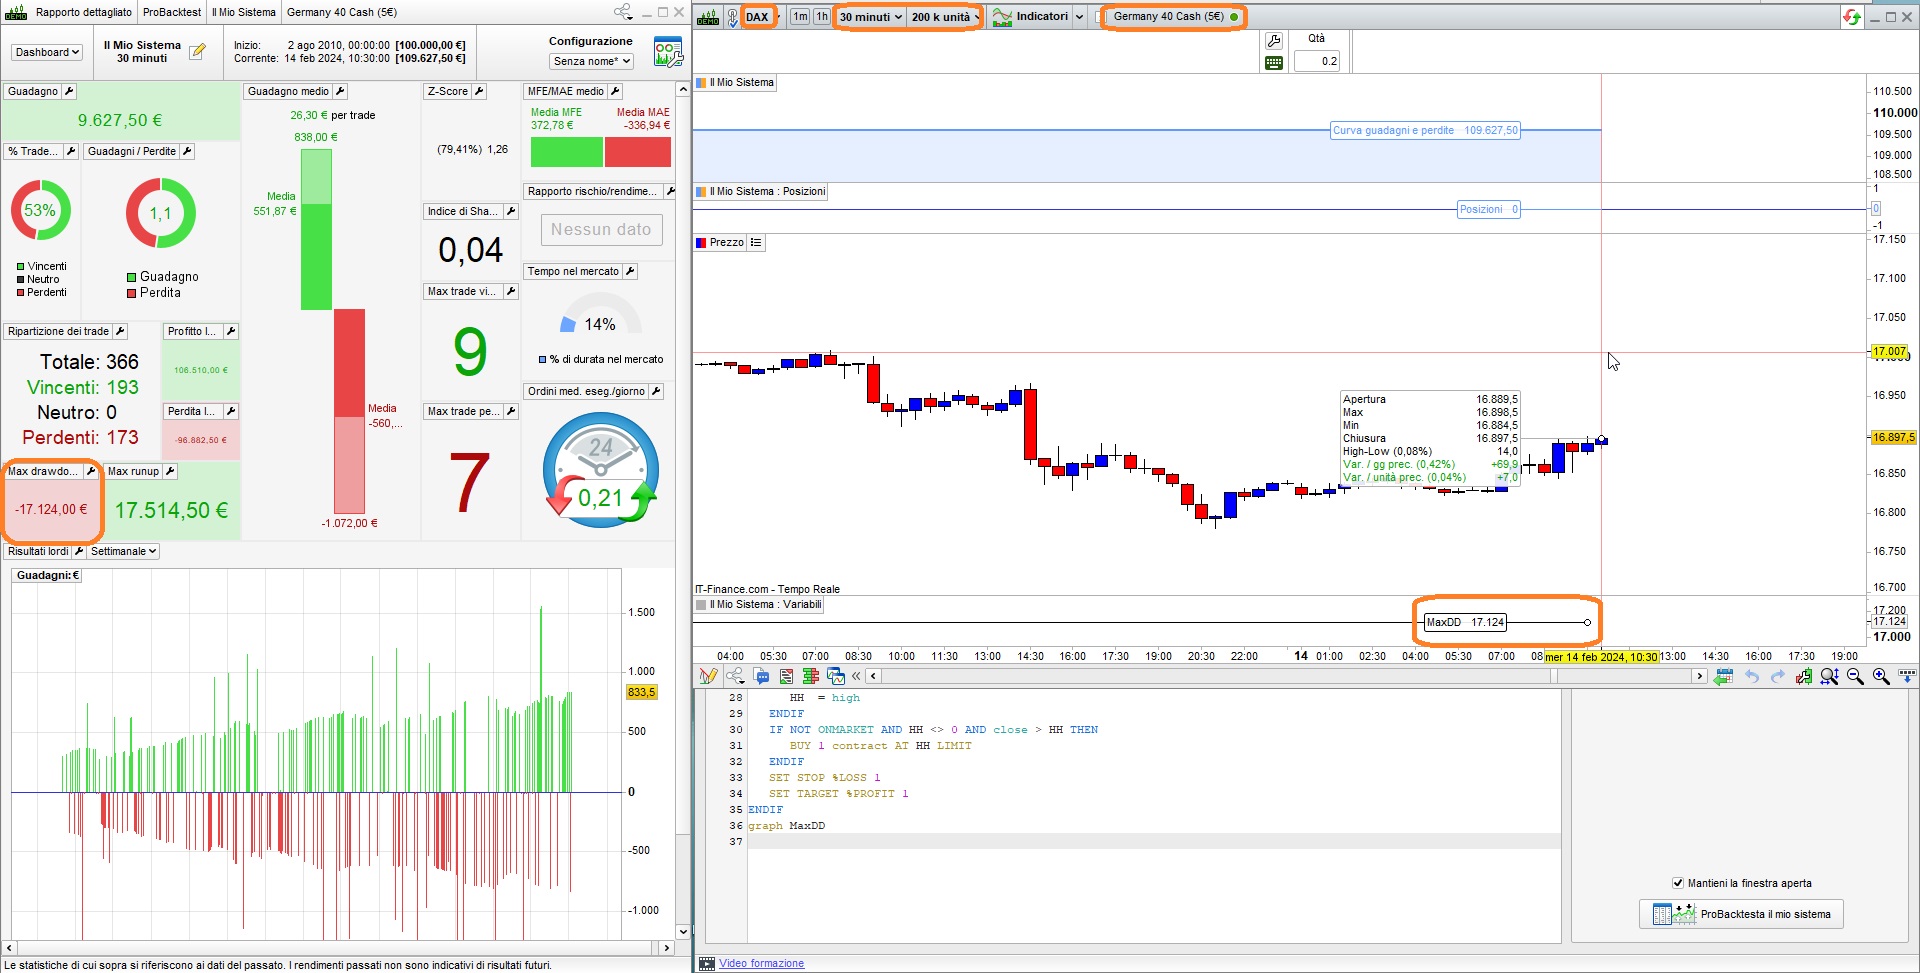
I tried this code and it returns the same DD as PRT as from my attached pic (code from https://www.prorealcode.com/topic/comprar-en-el-maximo-del-primer-minuto/#post-228149):
DEFPARAM CumulateOrders = FALSE
// DrawDown & RunUp  (abridged)
//
ONCE Capital  = 100000
ONCE MaxPoint = 0
ONCE MaxDD    = 0
//------------------------------------------
//       EQUITY
Equity        = Capital + StrategyProfit
TempProfit    = PositionPerf * PositionPrice / PipSize * PipValue //   / abs(CountOfPosition)
TempEquity    = Equity + TempProfit
//------------------------------------------
//       DrawDown
MaxPoint      = max(MaxPoint,TempEquity)
DD            = MaxPoint - TempEquity
MaxDD         = max(MaxDD,DD)
//
//------------------------------------------
ONCE HH = 0
IF OnMarket THEN
   HH = 0
ENDIF
IF OpenTime >= 153000 AND OpenTime <= 160000 THEN
   IF OpenTime = 153000 THEN
      HH  = high
   ENDIF
   IF NOT ONMARKET AND HH <> 0 AND close > HH THEN
      BUY 1 contract AT HH LIMIT
   ENDIF
   SET STOP %LOSS 1
   SET TARGET %PROFIT 1
ENDIF
graph MaxDD
Maye we are approaching this too simple. First off, the odd thing is that I reported the very same issues as now brought up in this thread by phoentzs and Batty, back in December.
In the last email you see below, I was told that the issue had been recognized and would be solved in a week or 3. This became 5 weeks, and then it was solved indeed. So I have the issues mentioned in his thread all working again.
Because the presentation of certain data is always related to “performance issues” (like lack of memory or general sluggishness) for me it was clear from the beginning that this is related to not-well working threading stuff (in the PRT platform). It should therefore be no coincidence that the memory issues were solved for me at the same time (now say a month ago) and also the performance has been improved. Btw, I have no hard proof for this, but this is my idea about it. That other thread (about V12 being Live with IG now) is full with this stuff.
The nasty conclusion could be that what the one person has working correctly, the other may not have.
Anyway in that other thread I also reported about completely wrong contents in the detailed report, with EUR/USD trades showing where S&P500 trades should show. No wonder that the results don’t match with your ideas about it. Just an example of something which is now wrong since a couple of days.
Lastly, it could be a big mistake to judge these things in Demo (like Roberto just did) because all is different in there. So even if it is backtesting, in my experience this should be done in Live. Example has always been PRT-IB, where Papertrading (= Demo) never made sense at all.
I have it in both the live account and the demo account. And since multiple people have the problem, it’s a problem and not due to any code. I personally use 15 minute bars in the SP500. And it almost always shows a false drawdown. In addition, there is no division into long and short in the individual report. @Robertogozzi Maybe you can try to verify the problem for yourself? Which version of PRT are you using?
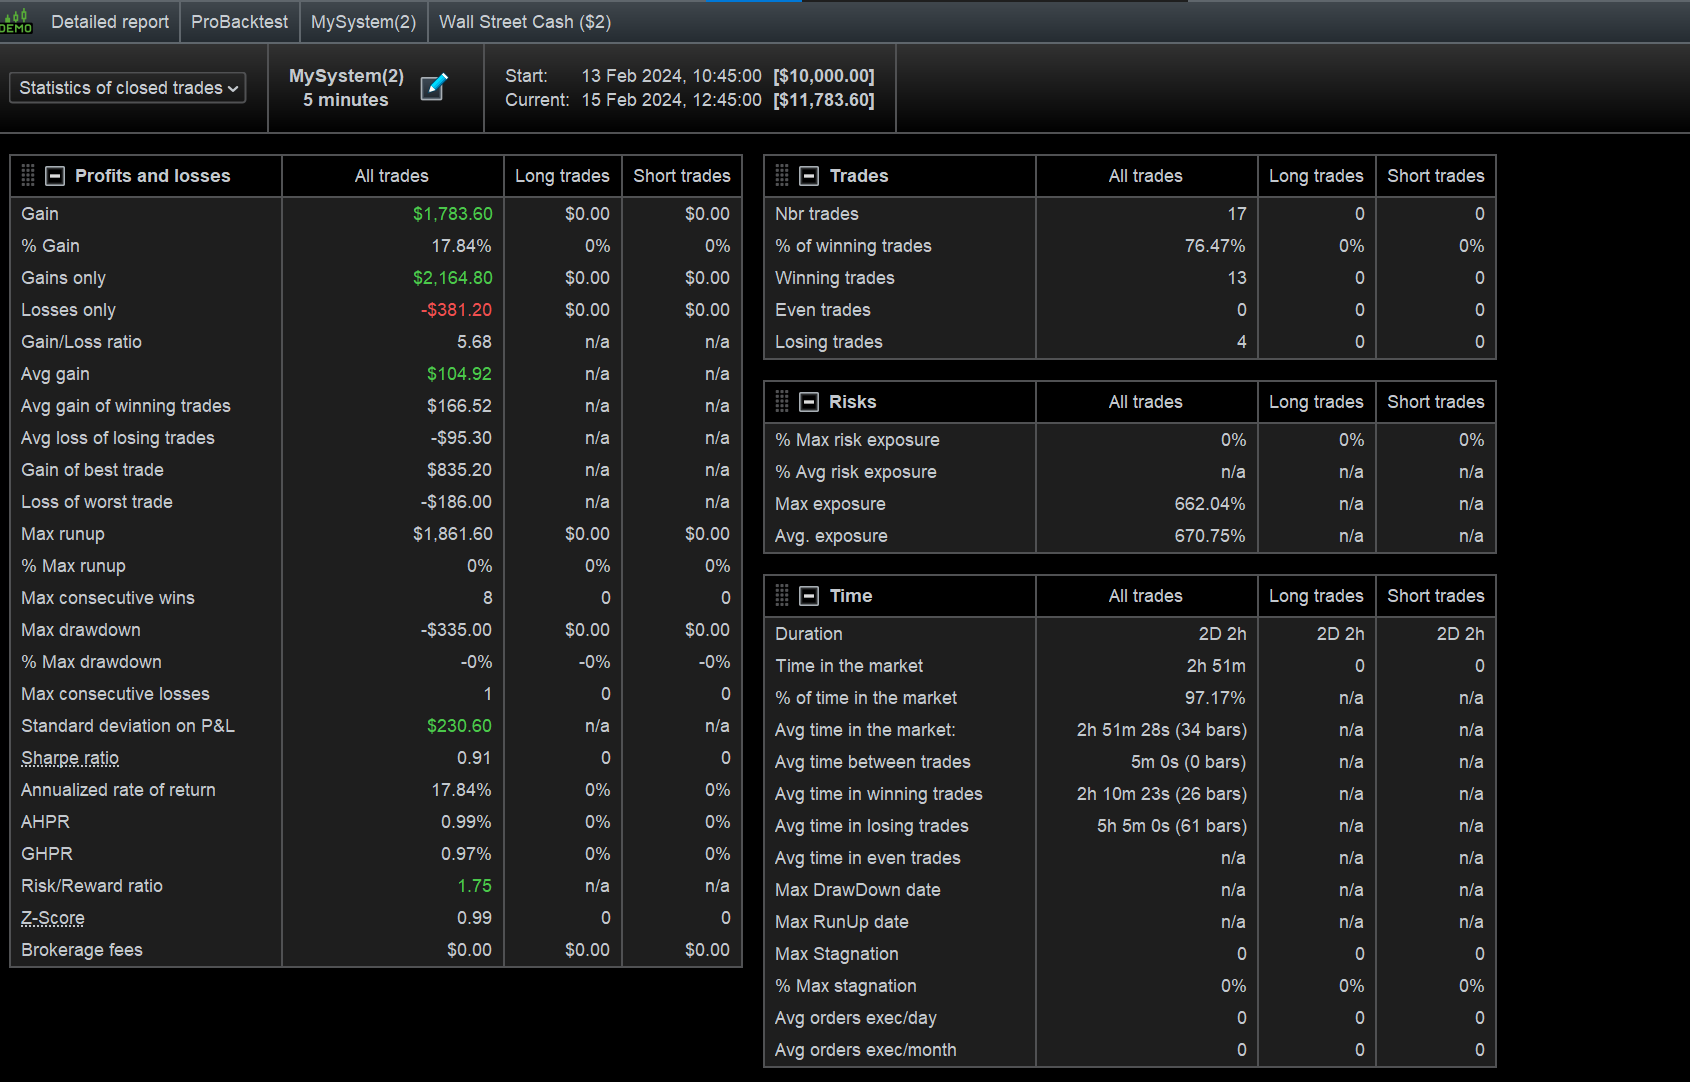
there is no division into long and short in the individual report.
I think you have said that a couple of times. But what do you mean by it ? can you show a screenshot of that ?
I’ll try to take the time soon and take a few screenshots for a more detailed description.
there is no division into long and short in the individual report.
PeterSt, you asked for screenshot of above, it just happened to me (also many times before) … see attached for an example of what we mean.