A bit more advanced DAX algo(to be me anyway)
Spread 2p.
100k=ok
// Main code : DAX 30 min long
//-------------------------------------------------------------------------
DEFPARAM CumulateOrders=False

indicator1 = ExponentialAverage[22](close)
indicator2 = ExponentialAverage[22](close)
c1 = (indicator1 > indicator2[1])
indicator3 = AroonUp[15]
indicator4 = Aroondown[15]
c2 = (indicator3 CROSSES OVER indicator4)

indicator100 = close
indicator101 = Supertrend[2,11]
c100 = indicator100 > indicator101

IF c1 AND c2 AND c100 THEN
BUY 1 CONTRACTs AT MARKET
ENDIF

SET STOP PLOSS 68

trailingstop = 40

if not onmarket then
MAXPRICE = 0
priceexit = 0
endif

indicator5 = RSI[4](close)
c5 = (indicator5 <5)

If longonmarket and c5  then
sell at market
endif

if longonmarket then
MAXPRICE = MAX(MAXPRICE,close)
if MAXPRICE-tradeprice(1)>=trailingstop*pointsize then
priceexit = MAXPRICE-trailingstop*pointsize
endif
endif

if onmarket and priceexit>0 then
EXITSHORT AT priceexit STOP
SELL AT priceexit STOP
endif
Lines 5-7 can be written:
indicator1 = ExponentialAverage[22](close)
//indicator2 = ExponentialAverage[22](close)
c1 = (indicator1 > indicator1[1])
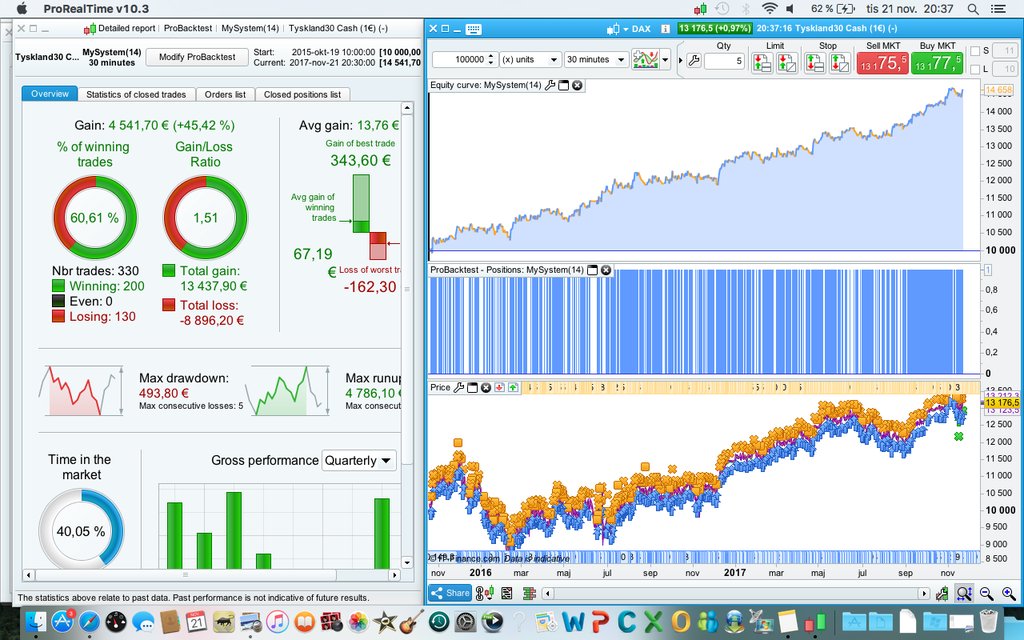
Barney! Well done. So you have optimized your variables from 100k bars ago to the end of December last year? Is that the thing you want us to understand in your first picture? Is this is true, you have indeed validate this In Sample Period in OOS one, it’s a good thing.
Well done Barney. The system is a little bit too long in the market for my liking but apart from that it’s good.
I made a few updates, hope it can help you! Lycka till!
// Main code : DAX 30 min long
//-------------------------------------------------------------------------
DEFPARAM CumulateOrders=False

indicator1 = ExponentialAverage[22](close)
indicator2 = AroonUp[15]
indicator3 = Aroondown[15]
indicator4 = Supertrend[2,11]
indicator5 = RSI[5](close)
indicator6 = averagetruerange[15]

// LONG
b1 = (indicator1 > indicator1[3])
b1 = b1 and (indicator2 CROSSES OVER indicator3)
b1 = b1 and close > indicator4

be1 = (indicator5 <5)

// ENTRY AND EXIT
IF b1 THEN
BUY 1 CONTRACTs AT MARKET

ENDIF

If longonmarket and be1 then
sell at market
endif

// Stop and Target
SET STOP PLOSS (indicator6 * 6.9)*pointsize
SET TARGET PPROFIT (indicator6 * 13.8)*pointsize

// trailing stop
trailingstop = (indicator6 * 2.2)*pointsize

if not onmarket then
MAXPRICE = 0
priceexit = 0
endif

if longonmarket then
MAXPRICE = MAX(MAXPRICE,close)
if MAXPRICE-tradeprice(1)>=trailingstop*pointsize then
priceexit = MAXPRICE-trailingstop*pointsize
endif
endif

if onmarket and priceexit>0 then
EXITSHORT AT priceexit STOP
SELL AT priceexit STOP
endif
Btw you can delete line 50.
Nicolas
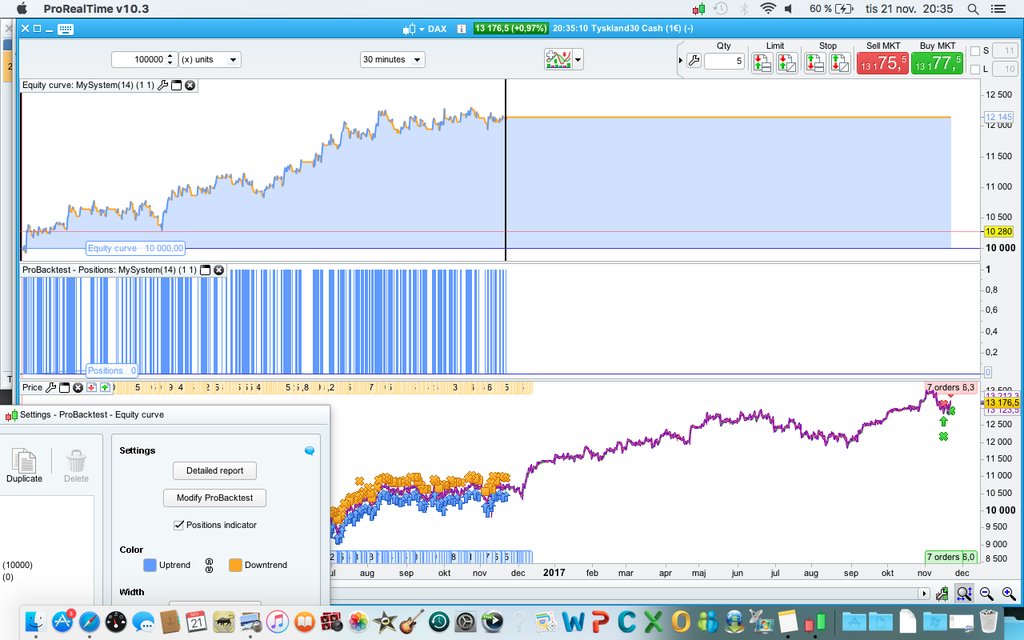
Yes, that´s what i want to show with the first picture.
Can not test 200k unfortunately.
Looks real good on 100k :))
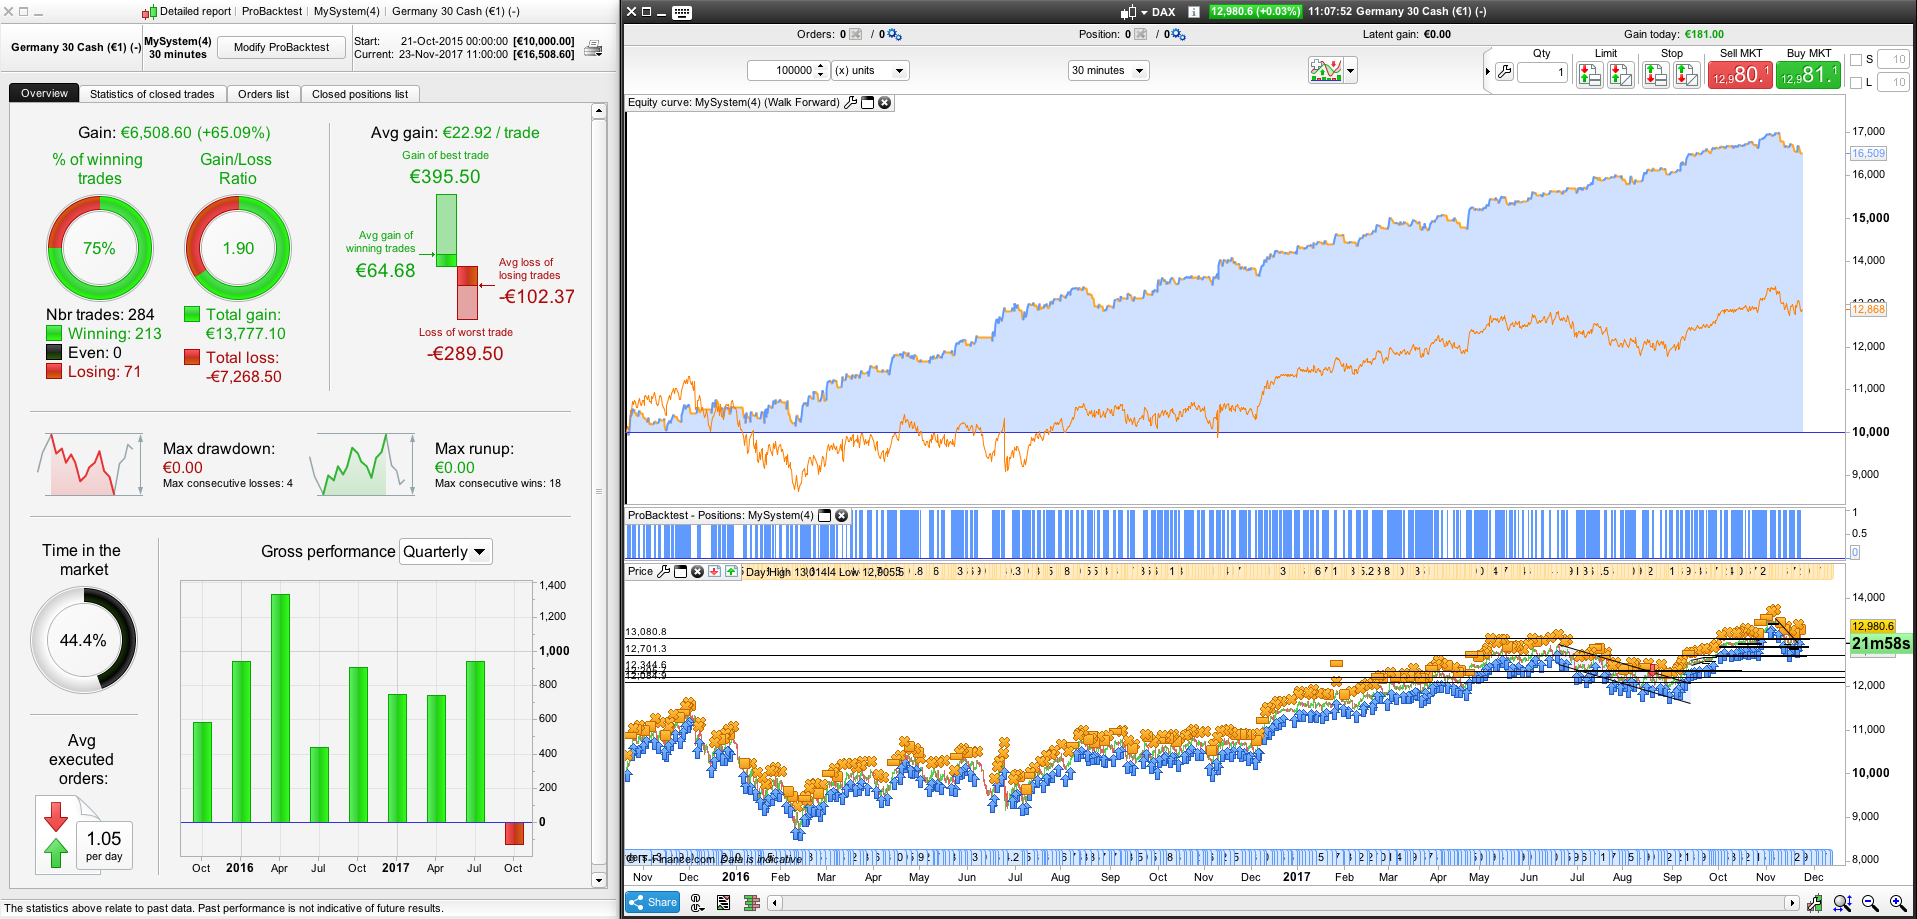
Here is the backtest with 200000 bars. The moment where the optimisation begins appears quite clearly.
Thanks for 200k Aloysius.
200k look almost strange, have made an effort to not over optimize this time!
Ok, before my 100k algo does not loos money :))
I have a question, indeed it looks curve-fitted, but i have noticed that there are different forms of curve-fitting.
Example #1: Some systems shows a TERRIBLE negative shitty results going from start of 200K=> 100K backtest.
Example #2: Others, like this system, shows more or less 0 profit/loss from start of 200K => to where the 100K starts
Example #3: and then theres the ones that stay profitable. For example i created one system on dax 15m that looked very profitable and good in 100K, then i got premium PRT and 200K, and it looked … OK i would say, from 200K start => 100K start. It was not as good as the 100K backtest, but it was more or less an OK smooth line going up, not as steep or good looking as 100K backtest alone but still profitable and decent.
I have personally made every one of these examples 😛
do not have enough experience in this field to make conclusions, but i would guess that example #1, the terrible looking system should be thrown away right? And obviously the example #3 with profitable EQ curve going from 100K to 200K backtesting, is something that you would keep working on right? But as with this system… what is the correct thing to do? I mean, yes it is clearly curve-fitted, but if you change some of the variables and get a decent curve going from start to finish on 200K backktest, should you just assume that youve just curvefitted it more for bigger data? or might it be something? Should you throw away the idea at once? keep working on it? Anyone got any answers here?? 😀
The 100k bars before are also forming a big OOS period. To get a better picture, a complete WFA should be made, with different scenarios: 3,5,9 or more optimized IS periods and OOS validations.. but at the end it is always up to you to make conclusions and invest money in the strategy or not. There are already many topics where discussions are made about what could be considered as robust or not.
@Nicolas I understand what you mean, and i agree, but do you have an opinion on wether to keep working on it or not, if you have example 1 or 2 in my post over?
In other words: if u go from 100K backtrst, to 200K backtest, do you need to see profitable trading all the way? Would you throw away the strategy if its very unprofitable in the past?
Example 1: consider it like a negative WFE, so not robust (at least on this period).
Example 2: so-so WFE should desserve a second guess!
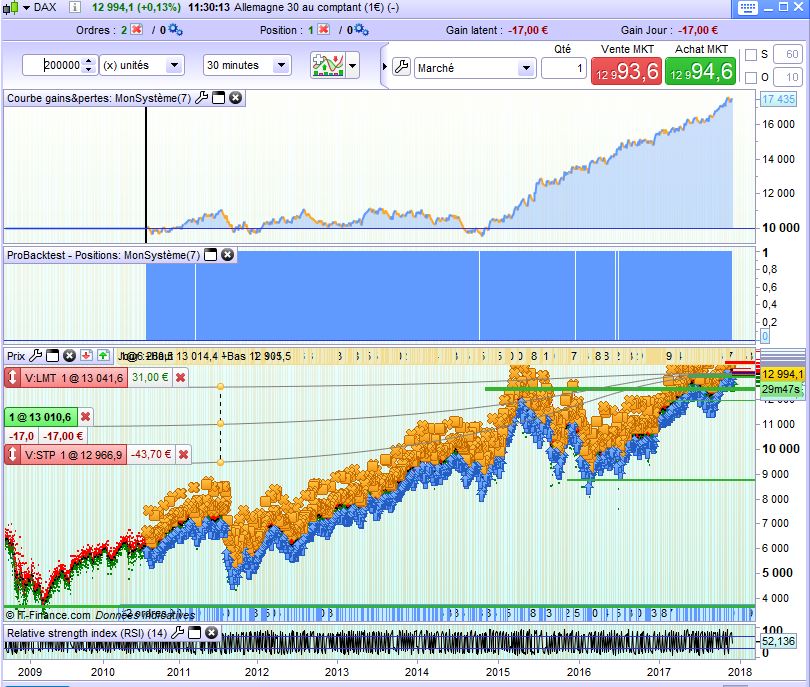
@jebus89 I tired this strategy on the Swiss index and it gave a positiv return (obviously not as good as on DAX), so I like to believe there is still something to build on here.