Just my attempt to emulate Volatility-Based Technical analysis as developed by Kirk Northington – see http://www.tradingtheinvisible.com/htm/resources.html
ok, so the code you have posted is incomplete, it only has the upper bollinger bands lines. That’s why I did not understand it very well at the first glance. My attempt is still buggy, I let you know if I can get it through .. soon .. or not 😉
This is a rough code, I don’t think it is completely accurate, because I can’t get to know if a Peak() must be consecutive to a Trough() or not (like zigzag..)
//PRC_BBands S/R inflection (WIP)
//https://www.prorealcode.com/topic/newbie-coding-request-bb-sr/
percent = 0.3
peakData=BollingerUp[20](close)
troughData=BollingerUp[20](close)
if barindex>20 then
//Metastock Peak() function
if lastdottedline<=0 then
higher=max(higher,peakData)
endif
peakpercent=(higher-peakData)/higher
newpeak=peakpercent>percent/100
if newpeak and lastdottedline<=0 then
lower=peakData
lastdottedline=1
lastpeak=peakData
endif
//Metastock Trough() function
once lower=troughData
if lastdottedline>=0 then
lower=min(lower,troughData)
endif
troughpercent=(troughData-lower)/lower
newtrough=troughpercent>percent/100
if newtrough and lastdottedline>=0 then
higher=troughData
lastdottedline=-1
lasttrough=troughData
endif
atr40=averagetruerange[40]
if lastpeak<>lastpeak[1] then
peak1=lastpeak
peak2=lastpeak-ATR40
endif
if lasttrough<>lasttrough[1] then
trough1=lasttrough
trough2=lasttrough+ATR40
endif
endif
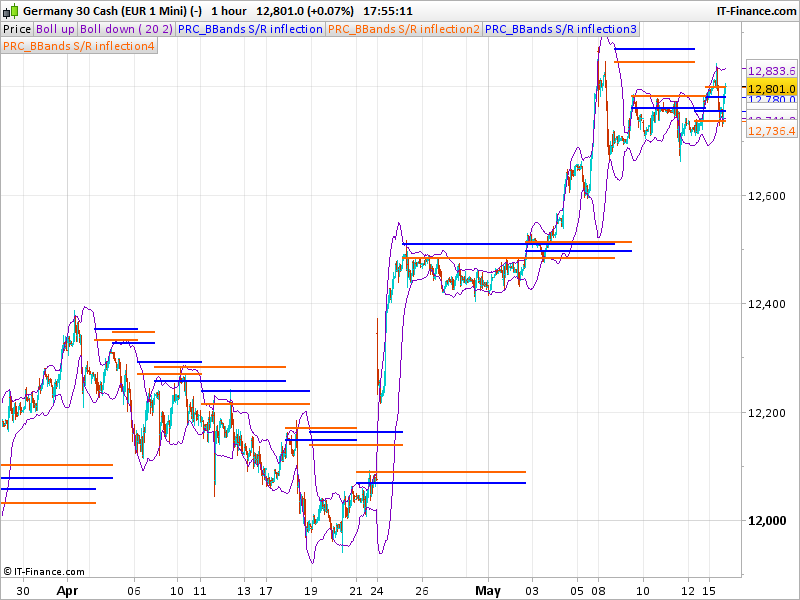
return peak1 coloured(0,0,255) style(point,2),peak2 coloured(255,100,0) style(point,2),trough1 coloured(0,0,255) style(point,2),trough2 coloured(255,100,0) style(point,2)
Hey Nicolas -fantastic. I’m sorry- I should have been more explicit in the beginning. I was willing to hack the other half of the code (and still am) once the one half was complete. I’m going to study this and will let you know soon. Once again – great,awesome – now just to see if it is doing the right thing. Merci.
Hi Nicolas
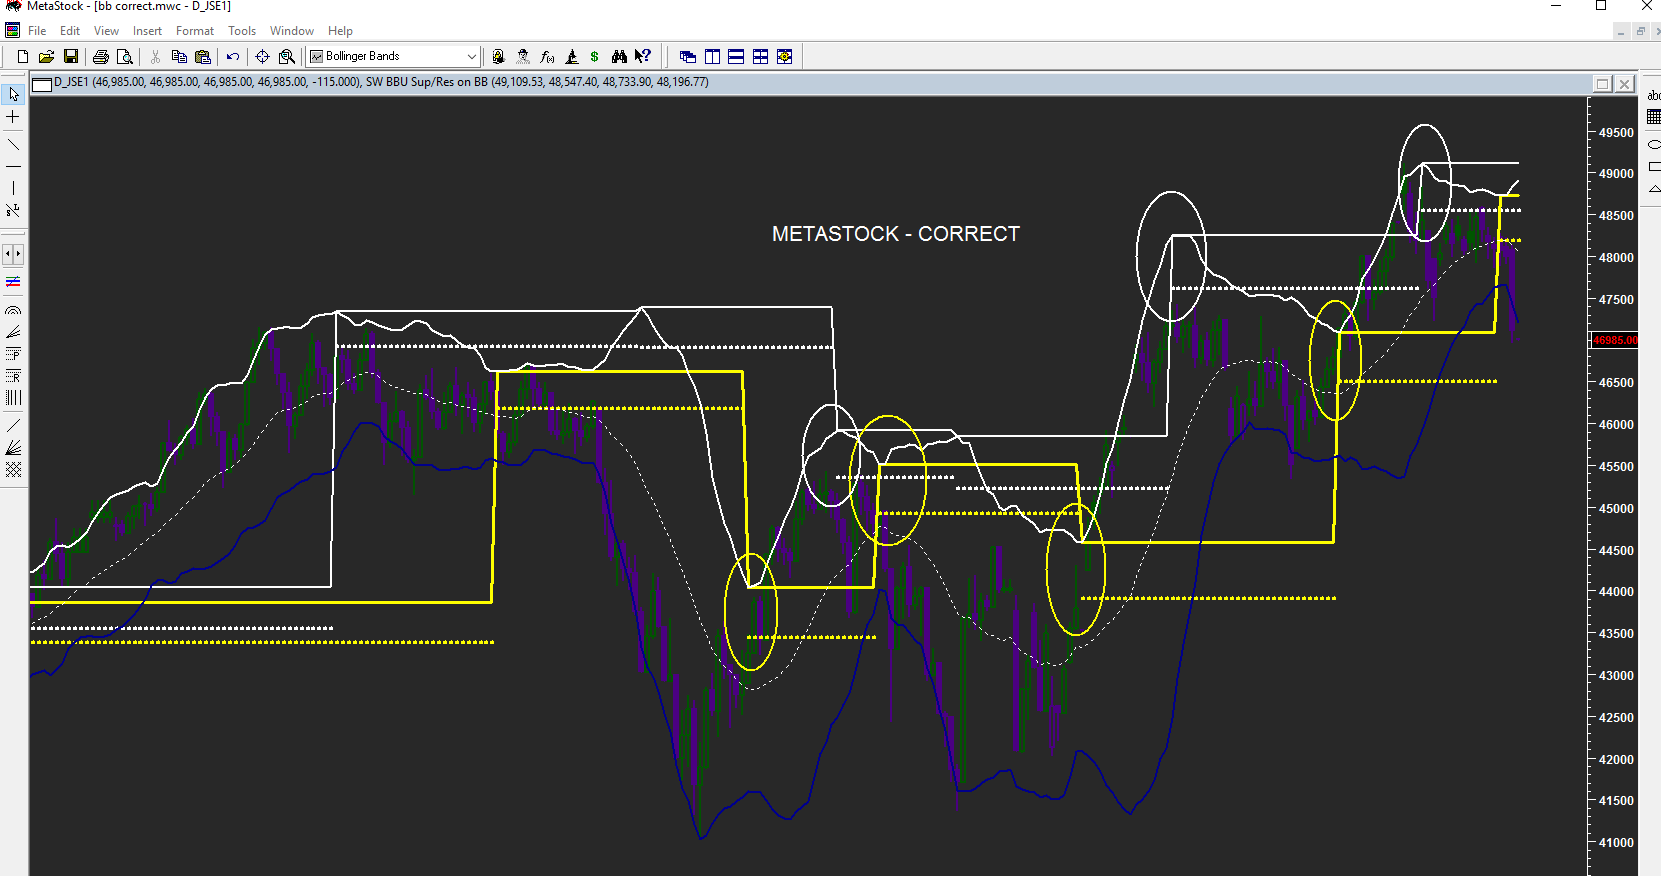
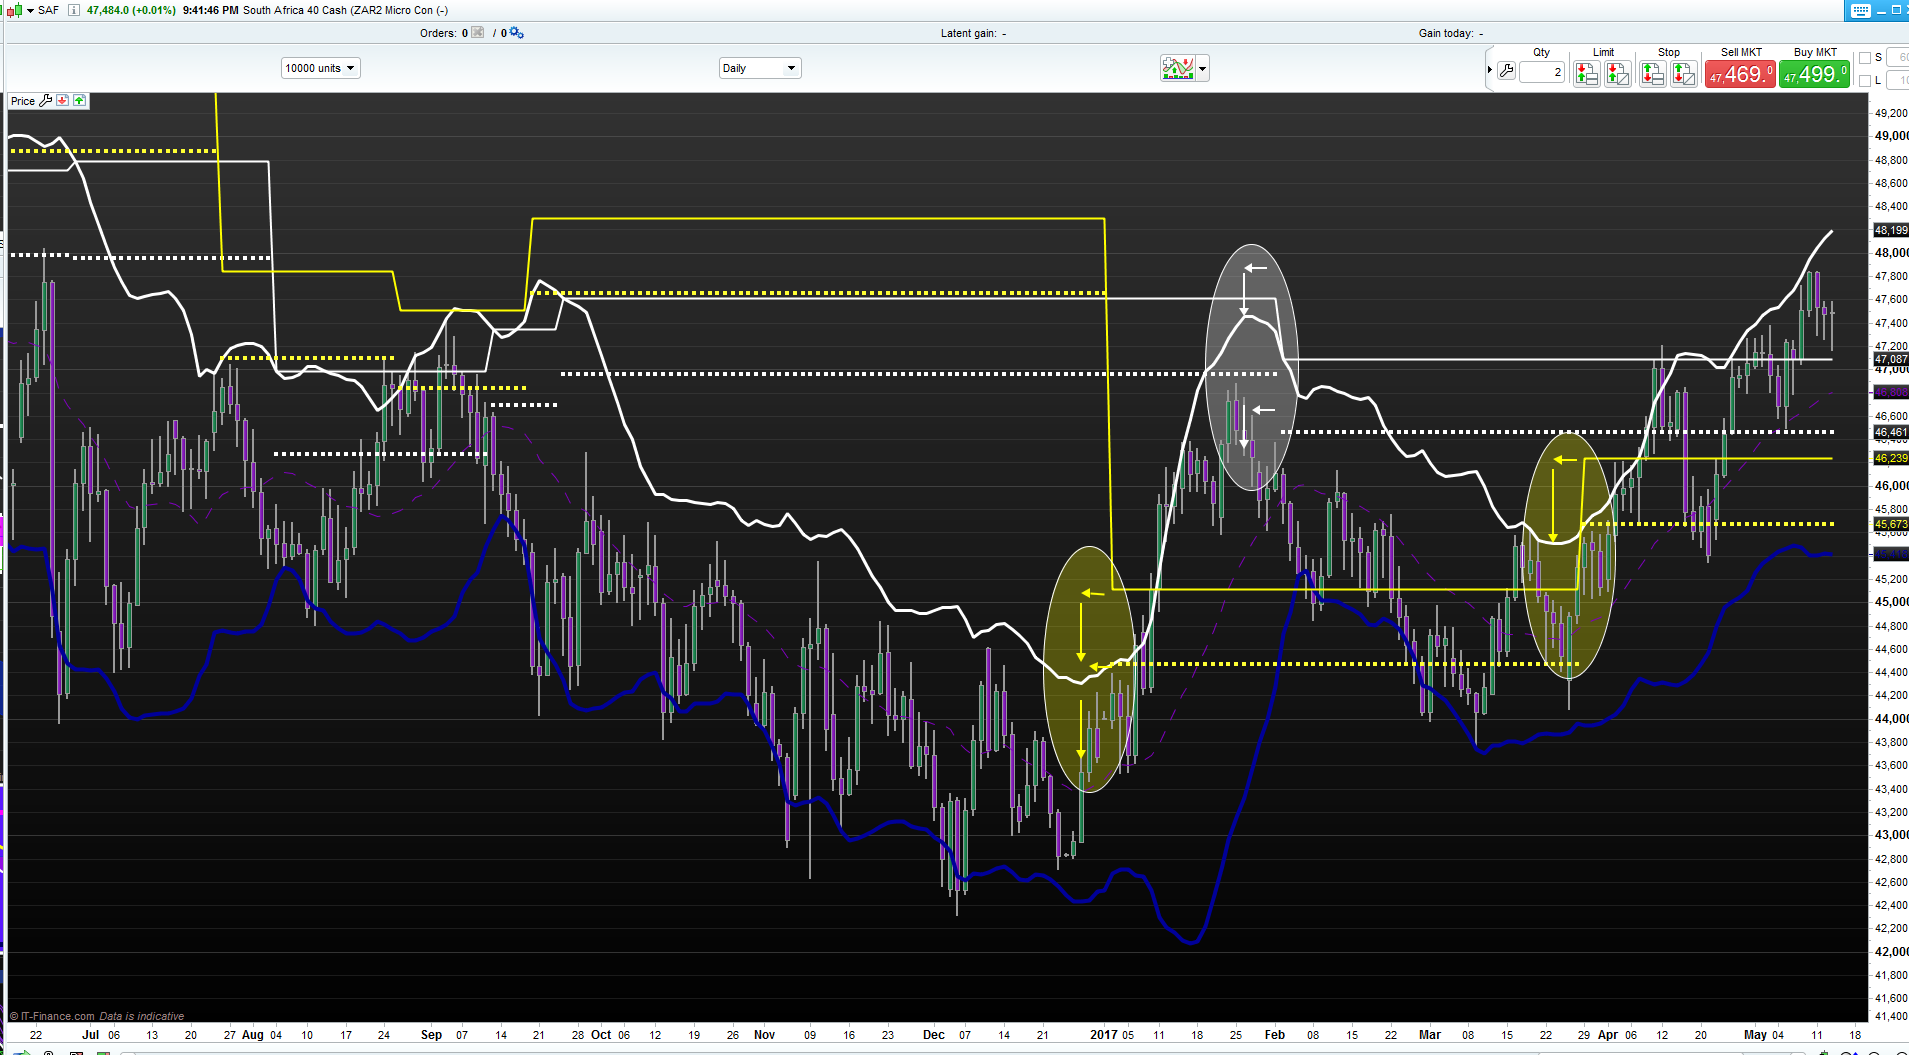
I have had a look a the indicator and it seems to be plotting about four bars “to late” and a little to high. (Although for some strange reason it seem to be a little to low on the chart you posted) For the purposes of comparison I have done the following:
- Plotted the upper BB in white (the lower is in blue – ignore)
- Drawn the peak lines in white – main as solid and 1ATR in dotted
- Drawn the trough lines in yellow – main solid and 1ATr dotted
By comparing the METASTOCK chart with the PRT one you will notice the discrepancy. I have drawn arrows to indicate more or less where the lines should be if they were correctly plotted.
Hope this helps. Thanks once again for your effort to date. Much appreciated.
I think the problem is that the values are correct and found at the right time but not plot in the past like it seems to be in MetaStock. I’ll have a deeper look ASAP.
Thanks Nicolas. Much appreciated.
I think the problem is that the values are correct and found at the right time but not plot in the past like it seems to be in MetaStock. I’ll have a deeper look ASAP.
hello did you get updates on this beautiful indicator?
@vincenzo Tavernise
Please do not double post! Thank you.
I replied to the other post of yours.
Hi
I a revisiting this indicator but wish to replace the bollinger bands with code incorporating linear regression. However it just plots a value of zero. I substituted linear regression with the close and it plots just fine. Any help in resolving the code will be greatly appreciated.
The code posted is with the close (working). The first three lines need to be modified to substitute linear regression for the close.
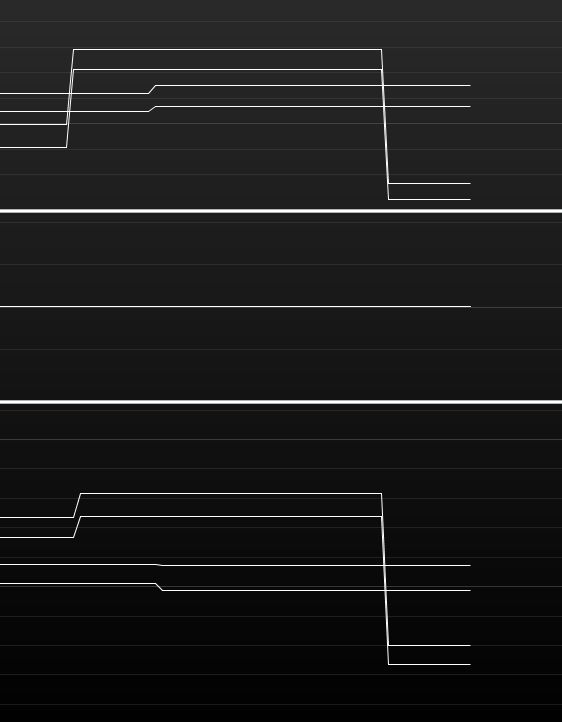
The attached figure depicts:
TOP: Original code with Bollinger Bands (by Nicolas)
MIDDLE: LinearRegression (my modification, not working)
BOTTOM: Close (my modification, working)
//LR= LinearRegression[14](Close)
a = ExponentialAverage[20](Close) //(LR)
StdDeviation = STD[20](Close)  //(LR)
Bsup = a  + 2 * StdDeviation

percent = 0.3
peakData=Bsup
troughData=Bsup

if barindex>20 then
//Metastock Peak() function
if lastdottedline<=0 then
higher=max(higher,peakData)
endif
peakpercent=(higher-peakData)/higher
newpeak=peakpercent>percent/100
if newpeak and lastdottedline<=0 then
lower=peakData
lastdottedline=1
lastpeak=peakData
endif

//Metastock Trough() function
once lower=troughData
if lastdottedline>=0 then
lower=min(lower,troughData)
endif
troughpercent=(troughData-lower)/lower
newtrough=troughpercent>percent/100
if newtrough and lastdottedline>=0 then
higher=troughData
lastdottedline=-1
lasttrough=troughData
endif

atr40=averagetruerange[40]
if lastpeak<>lastpeak[1] then
peak1=lastpeak
peak2=lastpeak-ATR40
endif
if lasttrough<>lasttrough[1] then
trough1=lasttrough
trough2=lasttrough+ATR40
endif
endif

return peak1, peak2, trough1, trough2