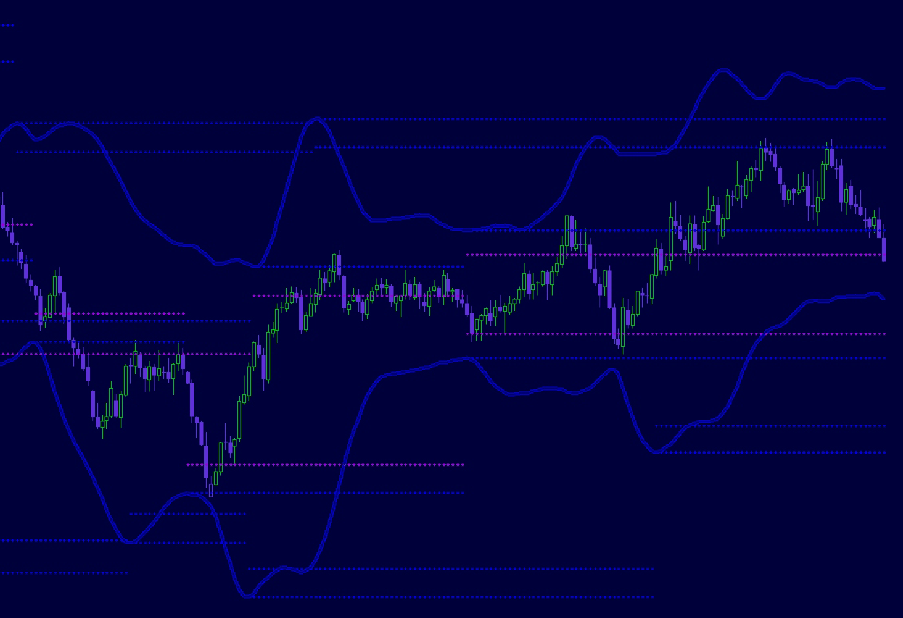
Hi folks, I am new here and am absolutely useless at coding- loop etc just paralyze me. I am so pleased to have discovered this site as I tried unsuccessfully to code the QQE indicator (amongst others) which I have found at this site. I would lie to know, if it is possible in PRT, if somebody could help with the conversion of the following METASTOCK code (It plots horizontal lines at certain inflection points of Bollinger Bands.) Any suggestions would be greatly appreciated. Thanks in advance. The attached picture shows what the indicator looks like – also includes indicator for lower Bollinger band. Useful to alert one to potential future zones of Support/resistance and possible turning points.
ptpcnt:= 0.3;
bbu:= BBandTop(C ,20 ,S ,2 );
pbars:= PeakBars(1,bbu,ptpcnt);
tbars:= TroughBars(1,bbu,ptpcnt);
p1:= Peak(1, bbu, ptpcnt);
t1:= Trough(1, bbu, ptpcnt);
p1;
p1 – ValueWhen(1,p1<>Ref(p1,-1),ATR(40));
t1;
t1 – ValueWhen(1,t1<>Ref(t1,-1),ATR(40));
I’d like to help, but I have already encountered the same problem about Peak() and Trough() Metastock functions: I have no idea how it is calculated into the platform, even if I refer to the metastock programming documentation. These functions seems to be the same as zigzag but without the repainting behaviour.
I do not have metastock installed, maybe you could help if you have? We could compare my coding attempt with actual charts?
Hi Nicolas. I do have Metastock installed. Am more than willing to help in any way that I can. Just let me know what you require.
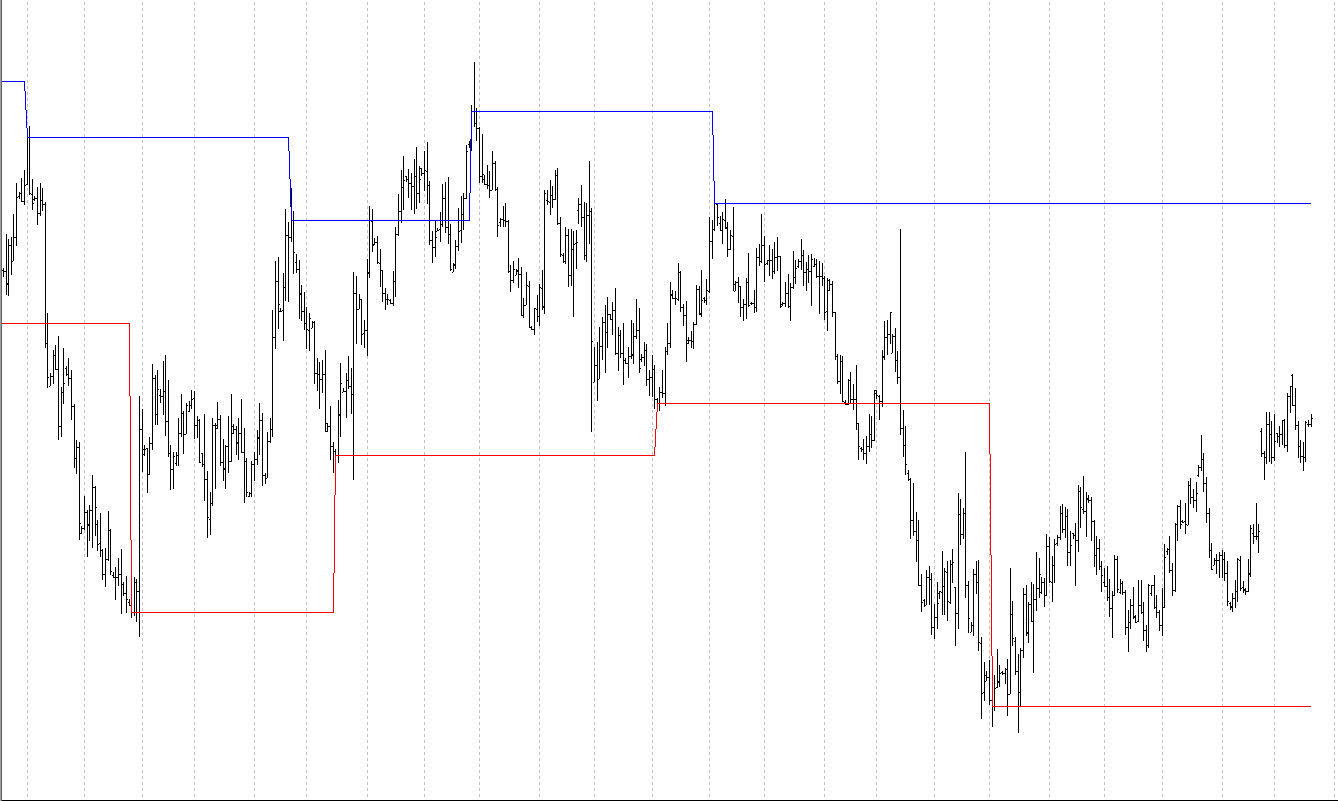
ok, so please upload here a screenshot of EURUSD, daily timeframe, that plot this formula:
Peak(1,C,3)
and another one with this formula:
Trough(1,C,3)
Hello Nicolas
As requested. I have had to import the data from Metatrader, so the dates don’t line up. I hope this will do. The Blue line is Peak and Red Trough
Thanks, but you are talking about Metastock, not Metatrader, right? 🙂
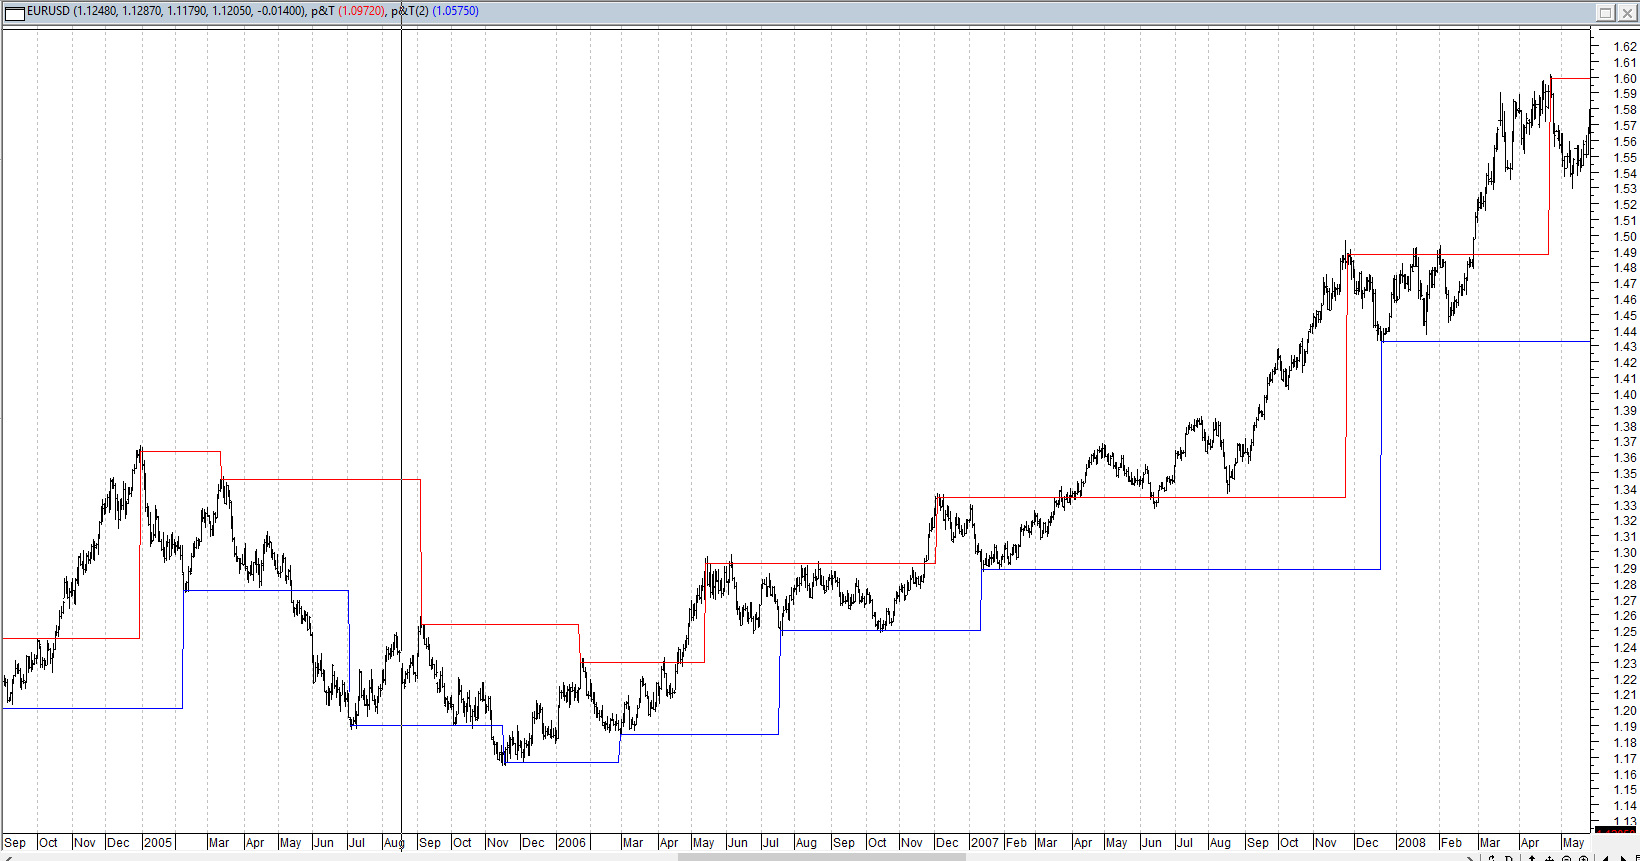
It would help me much more, if I could see the price and date to compare with..
I imported the data from Metatrader into Metastock. If you can highlight the points you are interested in I can look it up on Metatrader. Sorry for hassle. The picture posted displays the most recent data on the right margin.
Alternatively, I can provide you with the dates where the indicator(s) change by checking it on Metatrader.
Why Metrader since these functions are part of Metastock coding language? They are 2 different software! How can you get these lines in Metatrader??
I am sorry but we are talking in cross purposes here. I do not have EOD data for EURUSD for Metastock. I therefore imported EOD data of EURUSD from Metatrader into Metastock. As a result of the importation the dates do not align. If you can give me the date that you are interested in I have to check in Metatrader to give you the corresponding date to see if they are the same. I hope this clears it up.
oooh! sorry, I asked you about EURUSD because I were almost sure you have it in Metastock.. so please share a chart of any world index please.
Nicolas, I do not subscribe to a EOD download. However, I have looked in my database and found that there is EOD EURUSD data until early 2015. However, the data since 2008 do not look reliable. I have therefore made a screen capture of 2005-to july 2007. Will you be able to work with this? If not, I am going to try and find a source on the internet for free EOD forex data for Metastock.
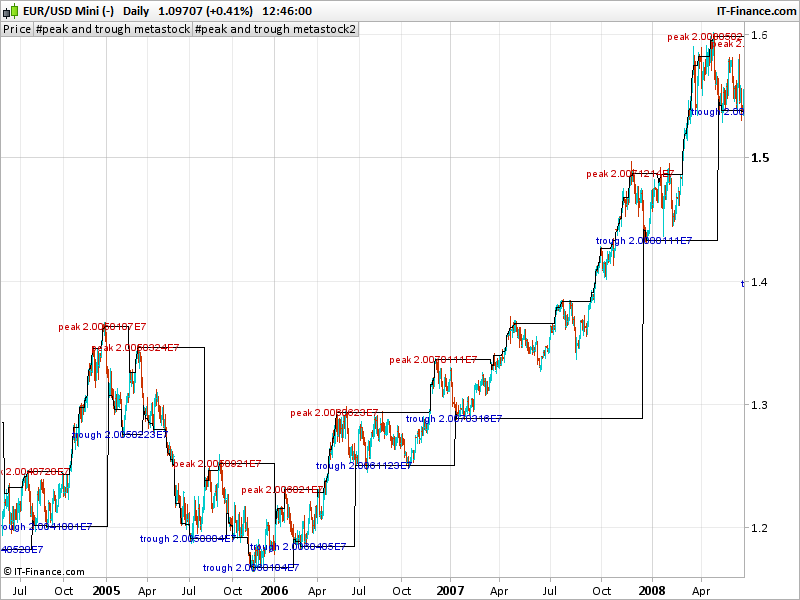
Well, I think I succeeded recreate the functions for probuilder. I’m still worried about correctly identify the peak and trough bars in the past (not important for your query though..), because Metastock language has also functions that fetch and retrieve the correct bars through history that create the peak and trough: PeakBars / TroughBars..
I will now try to translate the code of the metastock indicator you add in your first post.
Do you got any other examples of your indicator displayed on a chart please? It’s pretty hard to understand all these lines! 🙂
How do you use it? Why blue and pink lines?
Hi Nicolas
If you look at the first picture I posted you will see that the indicator plots the following:
2 horizontal lines at a specified peak on the top bollinger band – one at the peak and one 1atr less
2 horizontal lines at a specified trough on the top bollinger band – one at the peak and one 1atr less
2 horizontal lines at a specified peak on the bottom bollinger band – one at the peak and one 1atr more
2 horizontal lines at a specified trough on the bottom bollinger band – one at the peak and one 1atr more
Although the picture reflects a modified bollinger band the principle is still the same. As per the picture you can see that it often identifies areas of support/resistance and may lead to reversal or congestion. In the picture the reason for the pink lines is that if trading action is confined between these it can be considered to be in a trading range, outside of these trending (an arbitary definition).