// === POSITION MANAGEMENT ===
reverseToLong  = 1
reverseToShort = 1
If ShortonMarket and LongSignal and reversetolong = 1 Then
ExitShort at Market
Endif

If LongonMarket and ShortSignal and reversetoShort = 1 Then
Sell at Market
Endif

// 1. Check stop loss AND reverse
IF high >= (tradeprice(1) + StopLossDistance) THEN
// LONG  reversal
BUY PositionSize SHARES AT MARKET
ENDIF
ELSE <<< Syntax error formed after adding code...
//
Ctrl + F5 < got it…
Thank you
Hi,
Got to be honest, I am a little confused on this one…
The code has syntax errors, line 58 ELSE
So, I am not sure what to do with the code ?
Can you help please…
NT
Line 58 reads:
ELSIF ShortSignal THEN
and I can’t spot any error.
// Draw stop loss line for long positions
IF LongStopLevel > 0 THEN
DRAWHLINE(LongStopLevel) COLOURED(0,255,0) STYLE(DOTTEDLINE, 2)
ENDIF
ENDIF
Not sure why, but the indents are not showing on the code insert (Ctrl + F5)
File attached also.
I have syntax errors that I cannot currently solve.
DRAWHLINE using IF statements !
Attached is the full code, for your perusal.
I have reviewed the glossary, examples online also, but to no avail, so any guidance is very much appreciated.
Any guidance is much appreciated !
NT
This is a Strategy / Algo under discussion in this Topic.
Drawing objects (Drawline etc as you post above) is not allowed in ProOrder / Strategies / Algos (hence why you are seeing errors).
Instructions to Draw Objects are allowed in Indicators (but not Algos).
Try this one (I am also attaching the ITF file):
Re Roberto code provided on the link above … I can confirm that there are no syntax errors when the code is run on PRT Platform.
Hi,
Don’t worry about the indents in inserted PRT codes, they are not added automatically. If maybe you came accross some indents previously in someone’s inserted codes, that would be because the author took the time to add some spaces manually to make the code more pleasant to read in the forum.
Oh, GraHal,
So, I have to create an indicator (custom) with the DRAW code, to show the stop loss levels in use (and apply that to the chart used in the backtest).
and
I am not to code any drawing code in the backtest Algo code…
Is that correct?
JC_Bywan, thank you, for the pointer, much appreciated.
NT
In a back-test file the only draw options are GRAPH, GRAPHONPRICE also the addition of PRINT to display a table.
Regarding the GRAPH commands, I think the only additional modifier that can be used is COLOURED(r,g,b,a) and AS”label”.
Also PRINT is limited to the last 200 entries, if I recall right.
So, I have to create an indicator (custom) with the DRAW code, to show the stop loss levels in use (and apply that to the chart used in the backtest).
Nah … you can use GraphOnPrice for that. It is only that this works with (forward) Backtesting. So a Live strategy won’t show GraphOnPrice (or Graph or Print for that matter). Those commands or not allowed to be active in the code when put to Live (or Demo).
Confused ? I hope not. But you really don’t need Indicators to see what you’re doing.
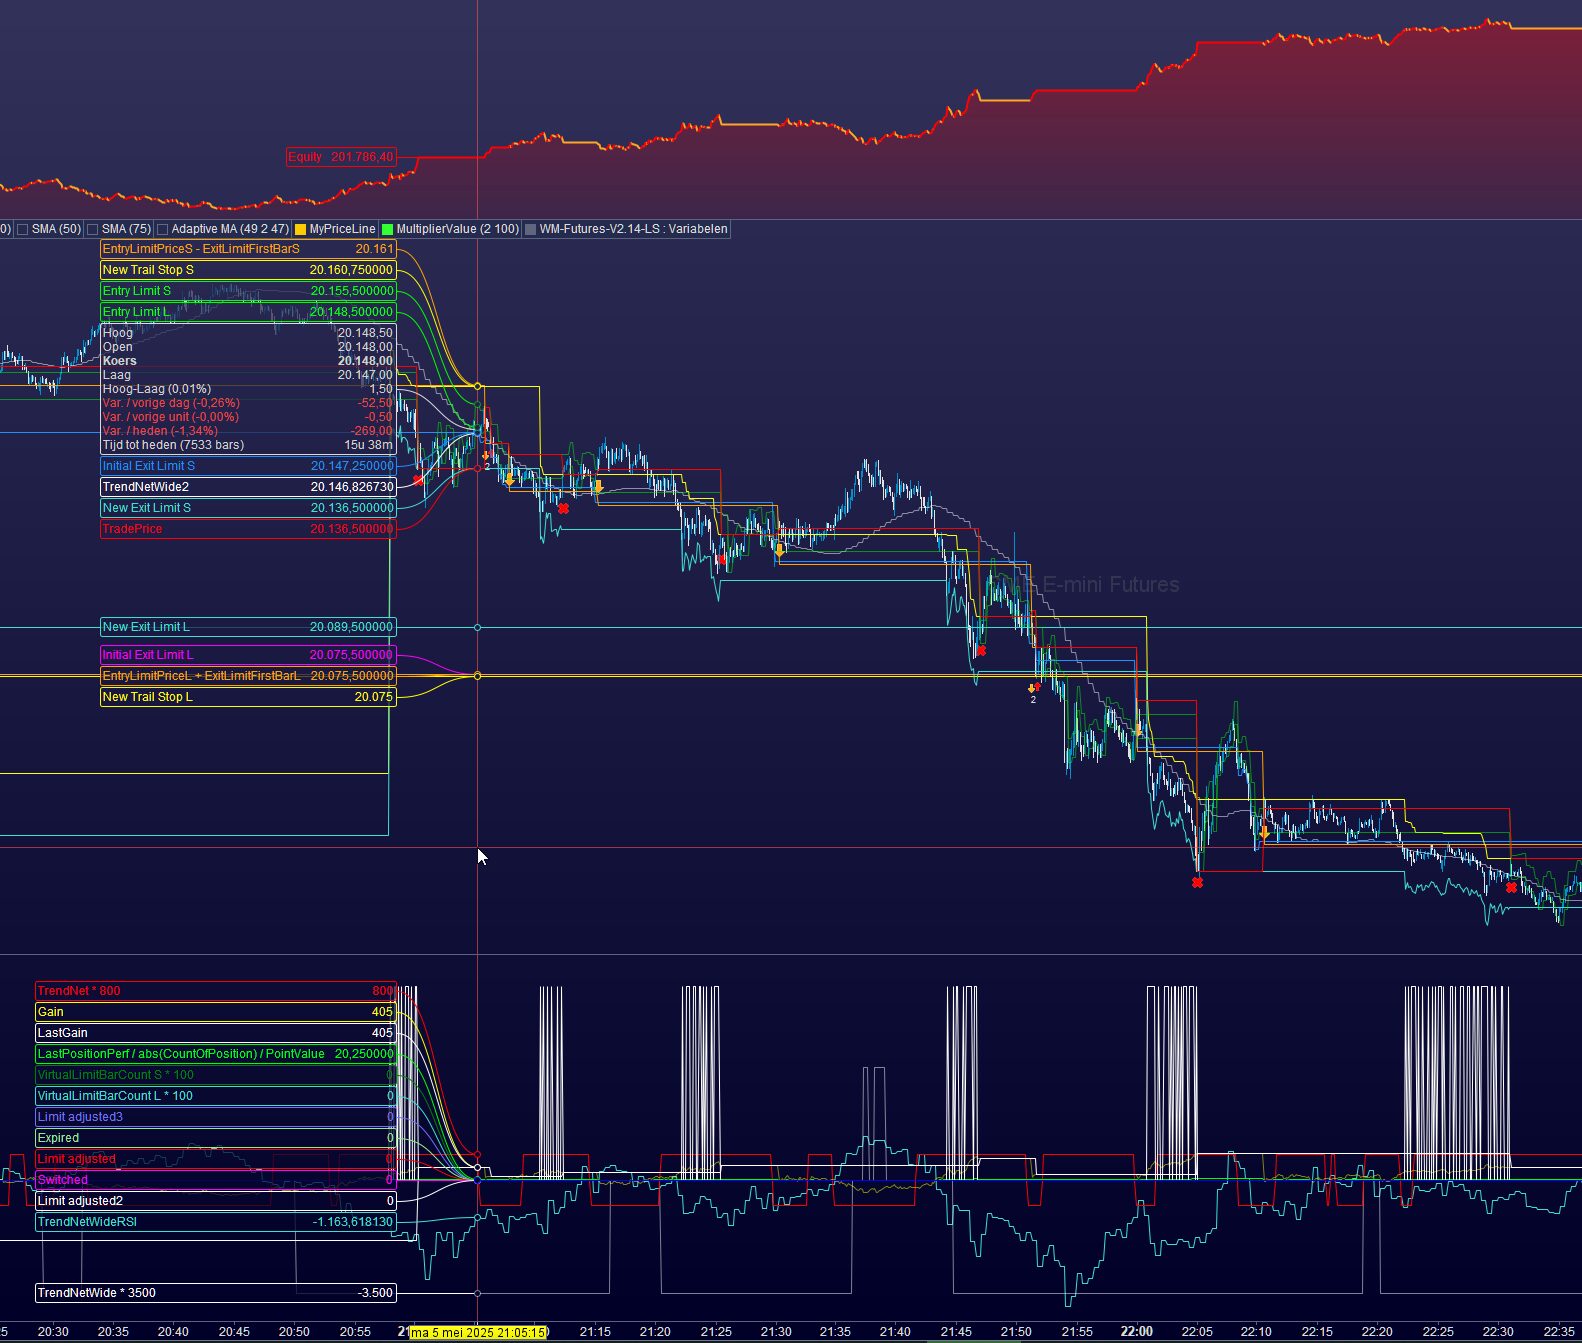
With GarphOnPrice you would “draw” on vertical positions around Close. That can thus also be Close + LimitPrice. Etc. …
For your inspiration.
The graphing in the middle pane is from GraphOnPrice.
What you see in the bottom pane is from Graph.
A few examples in code :
graph 6000 Coloured("Blue") as "Limit adjusted3"
graphOnPrice VirtualLimit Coloured("Turquoise", BacktestColorAlpha) as "New Exit Limit S"
graphOnPrice VirtualStop Coloured("White") as "Virtual Stop"   // 03-03-2025,PS.

// 20-02-2025,PS, Just notice : The below line would show the *changed* trailing, also visible on the price chart via "New Limit".
// Keep in mind that this Trailing follows the price, thus Up as well as Down.

graph VirtualLimitBarCount * 100 Coloured("Green") As "VirtualLimitBarCount S * 100"
Have fun !
In a back-test file the only draw options are GRAPH, GRAPHONPRICE also the addition of PRINT to display a table.
Regarding the GRAPH commands, I think the only additional modifier that can be used is COLOURED(r,g,b,a) and AS”label”.
Also PRINT is limited to the last 200 entries, if I recall right.
Dam, the code online glossary A-Z is missing….
GRAPHONPRICE
GRAPH
There are examples of these in use, in the online Code Documentation, which I am now using….
Thank you for the heads up
For your inspiration.
The graphing in the middle pane is from GraphOnPrice.
What you see in the bottom pane is from Graph.
A few examples in code :
|
|
graph 6000 Coloured(“Blue”) as “Limit adjusted3”
graphOnPrice VirtualLimit Coloured(“Turquoise”, BacktestColorAlpha) as “New Exit Limit S”
graphOnPrice VirtualStop Coloured(“White”) as “Virtual Stop” // 03-03-2025,PS.
// 20-02-2025,PS, Just notice : The below line would show the *changed* trailing, also visible on the price chart via “New Limit”.
// Keep in mind that this Trailing follows the price, thus Up as well as Down.
graph VirtualLimitBarCount * 100 Coloured(“Green”) As “VirtualLimitBarCount S * 100”
|
Have fun !
Oh my…
That is a really useful heads up, thank you….
I’ll refactor the code, and see what happens output wise 👍
Try this one (I am also attaching the ITF file):
Neo, in case you never noticed … Roberto provided GRAPH commands (click on text ‘Roberto wrote’ to link to the code).
graph myDIplus  CROSSES OVER myDIminus        AS "LongSignal"   coloured("Green")
graph myDIminus CROSSES OVER myDIplus         AS  "ShortSignal" coloured("Red")
graphonprice TradePrice(1) - StopLossDistance AS "LONG sl"      coloured("Red")
graphonprice TradePrice(1) + StopLossDistance AS "SHORT sl"     coloured("Blue")
graph myDIplus CROSSES OVER myDIminus AS “LongSignal” coloured(“Green”) graph myDIminus CROSSES OVER myDIplus AS “ShortSignal” coloured(“Red”) graphonprice TradePrice(1) – StopLossDistance AS “LONG sl” coloured(“Red”) graphonprice TradePrice(1) + StopLossDistance AS “SHORT sl” coloured(“Blue”)
What the… how did I miss that…. that is great…
I have not seen an example like that, well, I have now
and thank you GraHal, for point that out👍👍
robertogozzi, Thank you 👍👍