Fr7 – Please do not double post as it can lead to confusion. I will delete your post in the weekly seasonality topic as this is a more relevant place for your post. 🙂
 Leo
LeoParticipant
Veteran
Hi,
From line 122 to 147. There you define the variable you want to learn from.
Then change the values: variable1 to variable 4 .
These are use to feed the neural network dir learning
 mahx
mahxParticipant
Average
Hi,
Nice work Léo.
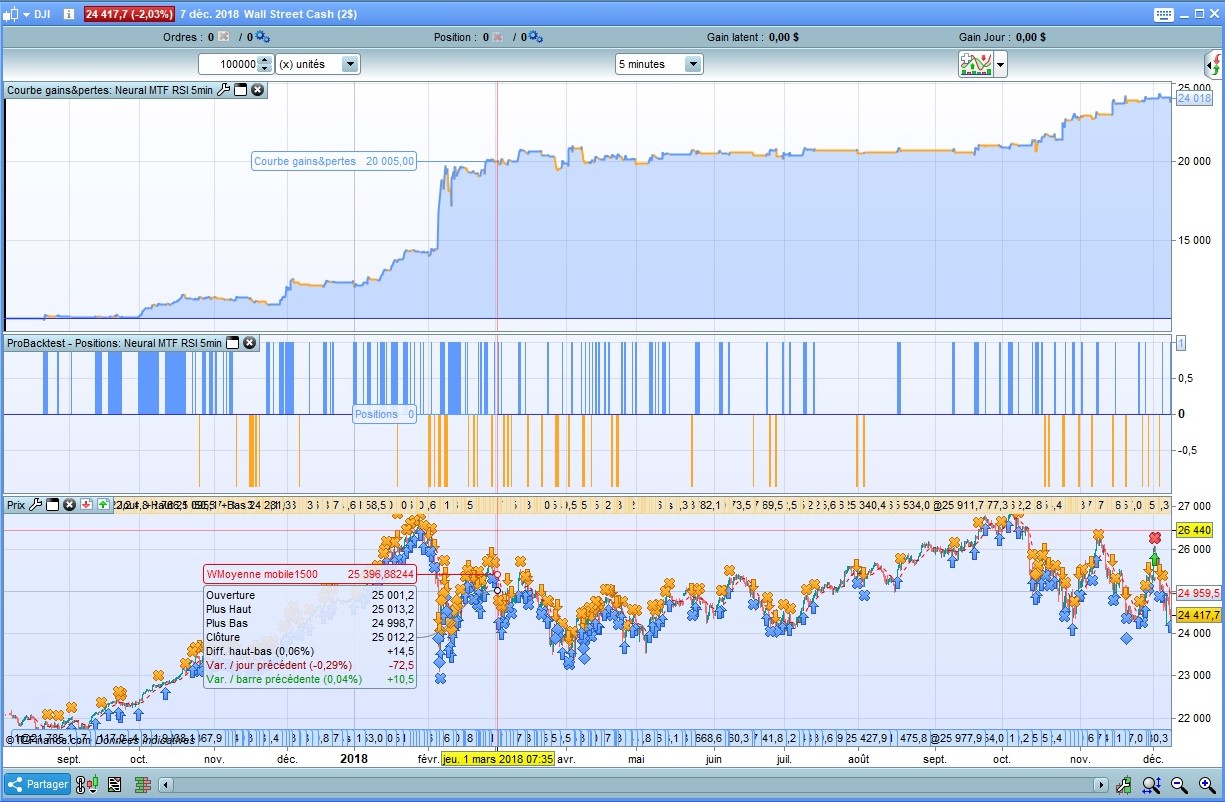
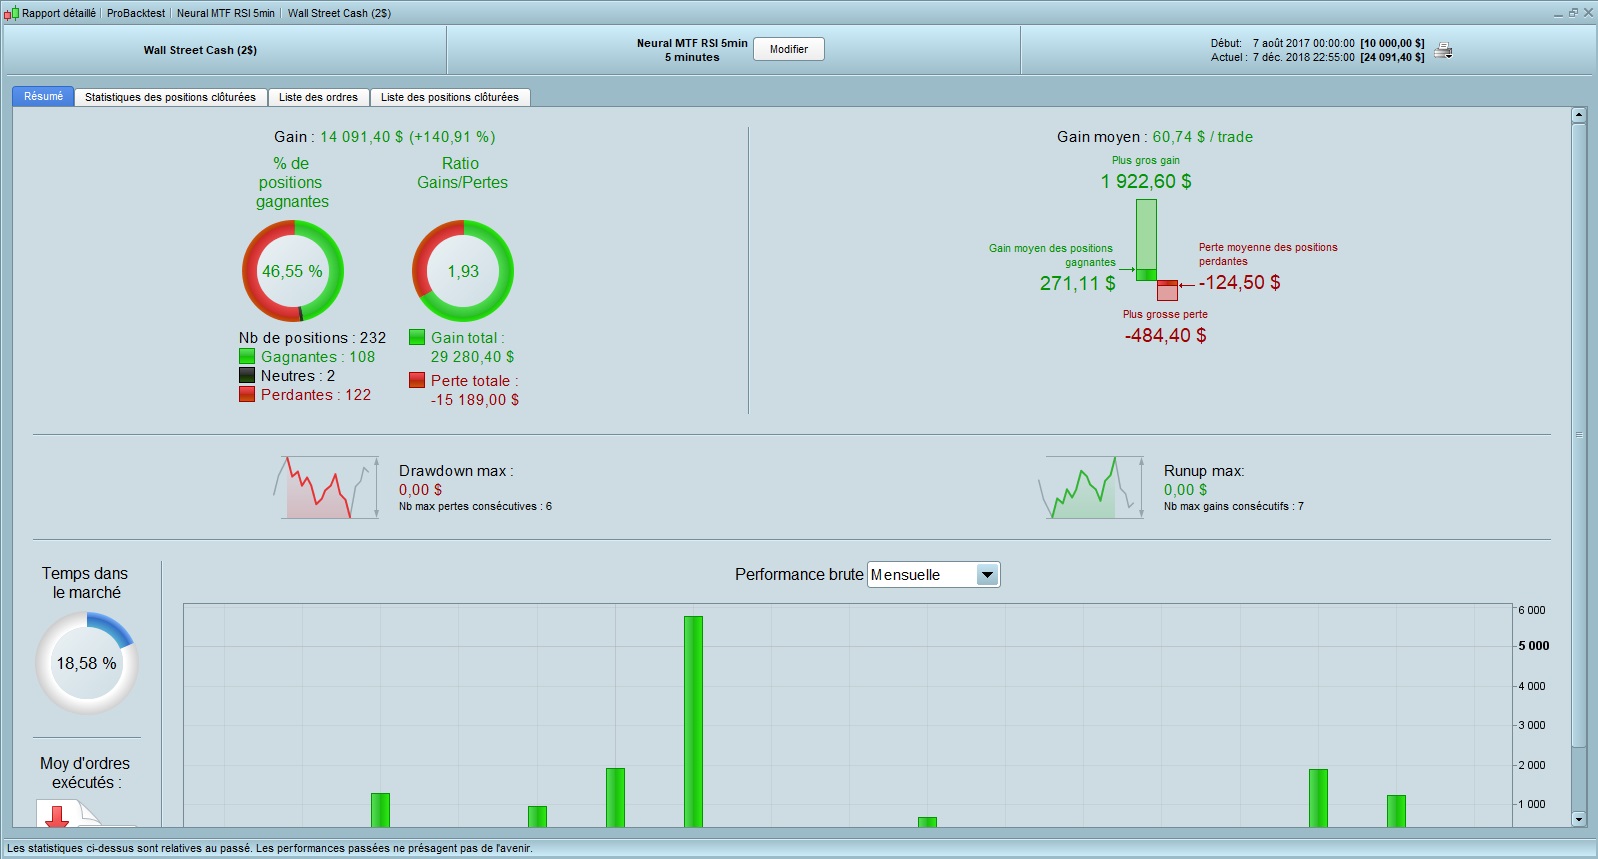
Just a trial based on neural network and multitimeframe, without stop loss or trailing.
LeoParticipant
Veteran
Looks awesome. Thanks for sharing! that encourage me to continue.
Hi Mahx
Can you share your code, I just discovered this nice piece of work (:] Leo) but I think it will help me to understand how I can play with it !
Tof
mahxParticipant
Average
I’ll improve it and test with others combination of indicators or time frame, but it take a most of time for test different setups. The base is interesting.
hi Leo,
-about your indicator Classifier V5.2, is it possible that Arrow is delayed more than 1 bar when it appear at screen. I ask you that because I am not in front of my screen when market is moving and I can’t see when Arrow is printing on chart ?
-Did you update you Neural Network with this indicator ? If not, can you tell me why ?
Thanks for you contribution.
Tof.
LeoParticipant
Veteran
Hi Auvergnat,
That “indicator” is not an indicator in the sence of predicting something or give signals. It looks int he past for fast movements. And extract the information of when it has started in order to feed the Neural Network data.
Why I didn’t have upload a new neural network with that new classifier?
I still experimenting with another ways classifier…as I said. It detects fast movements… But what is “fast” means? I think a classifier is so crutial in machine learning because is what the Neural Network is learning from. I explored another ways like unsupervised learning but the ProRealTime is not the best lenguage to do it so.
I didn’t has found so much time either. It is very consuming intensive in time and energy working in this project.
Hello Leo, amazing work! Indeed, it could be groundbreaking IF this gets validated.
As you recommended, I played a bit with your neural network by changing the variables 1,2,3,4 by other indicators. But what is weird to me is that the output is always the same, I get the same buy and sell signals. Have you experience the same?
LeoParticipant
Veteran
I have ggot several weird things in the process.
Sometimes I compare two different configurations i.e. diferentes variables from learn from and I got pretty similar predictions maybe was a coincidence.
In the other hand the predictions can never be near 0 or 1 if that is because maybe you need to load more bars or let the adgorim collect more data before start learning (line 194 change the values to more bars).
Check also the data. Once I got in the history a bar wich the high was equal to low then it has done a cero somewhere and the program got very weird values.
Something that can happen to me also is that some neurons die. That’s why the Neural Network also writes some values in the chart for cheking the overall process. You can see if everything looks normal.
What is normal… If all the values are changing like randomly in different ways but small amounts at the time… Sounds funny but it means that the descent gradient is doing the work for learning.
Hope it works.
For avoid misunderstanding in the forum. Please attach the file and where you are testing it and which time frame. Then I will have a look on it. Do not copy the code here because it causes confusion.
Cheers
Thx for your swift answer. I left the hyper parameters like they were, ie Betha 0.1, ETA 0.5, PipsTotrade 10, and adapted the line 194 to 10000 instead of 3000.
I was testing the neural network for scalping on 21ticks timeframe on Dax30. That way, we can get easily a lot of data for the network to learn. Anyway, on 15min TF with 50 PipsToTrade, got also always the same results as well.
To be clear, I was testing your version of the parameters (with what you call the SuperRange (so Trend001=round(10*(Curve001-Main001)/SuperRange)/10 etc)
against “my” version (in attachment) where I threw 4 random indicators:
Trend001= Average[50](close) + (2.5 * STD[50](close))
Trend002= Average[50](close) – (2.5 * STD[50](close))
Trend003= (highest[9]+lowest[9])/2
Trend004= (highest[26]+lowest[26])/2
As said, both versions return same output, which can be a coincidence but I don’t believe so.
LeoParticipant
Veteran
The same output. That is odd. In any case, when you use , maching learning for time series like financial markets, you must use relative values….Look, the value of (average50+2.5STD) 2 or 3 months ago is very different to the value of it today. Therefore the neural network a can not predict anything… you need to use relative values for compare values in the past with values of today for make a prediction.
For example:
( (average50+2.5*STD) – close ) / close
( close – (average50-2.5*STD) ) / close
etc
can you apply this changes to you network and tell me if it is working as you expected?
Hi Leo,
Indeed I was dumb, thx for the relative value advice. Nevertheless, this doesn’t improve things, just tried. Still same output. Don’t you experience the same behaviour or is it just me?