Seb
SebParticipant
Average
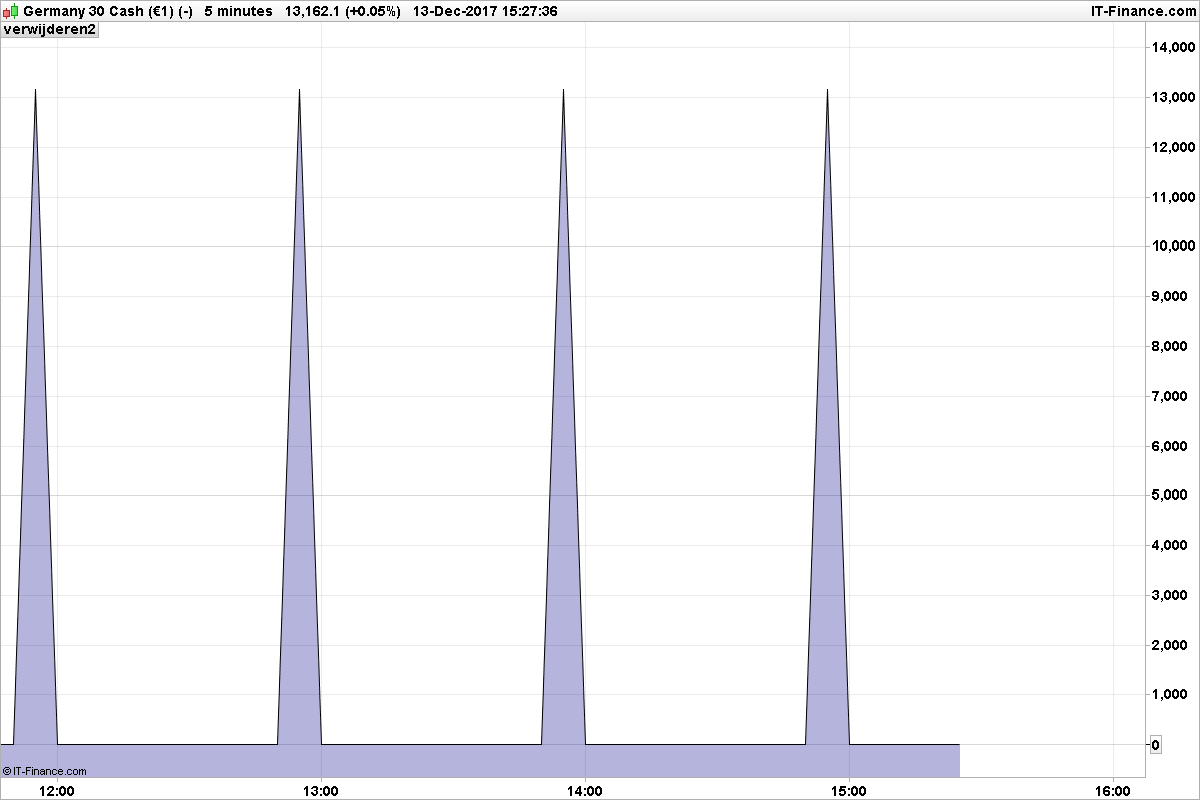
Hi everyone, I’m trying to make a higher timeframe EMA in my (lower timeframe) chart. I can print the values that have to be the input for the EMA calculation, but there are 0 values in between. The 0 values affect the calculation of the EMA. Therefore my question: is it possible to let an indicator print at intervals?
Difficult to answer your question without your code. But I think you are calling the EMA only one time at round hour and not in between. If you are calculating only on Close, you should give your variable the same value as the one before or not resetting it to zero. Once again, please share the code with the community, it would help also a lot of people here to know how you are achieving this interesting result (higher TF moving average on lower timeframe).
SebParticipant
Average
Credit goes to JMat45 for his Higher timeframe RSI code, I used the first part of his code to time the close of the higher timeframe in the lower timeframe chart. In the chart of my first post I print “htfclose”, the 60 minute close, in a 5 minute chart. In the code below I attempt to code an EMA(3) of the 60 minute timeframe for a 5 minute chart, but without success. The ExponentialAverage[3](htfclose) function of PRT doesn’t work either; it takes in the 0’s in between of the htfclose values, which gives a lower than supposed result. Therefore my question was if it’s possible to print at intervals, so the 0’s won’t be put in the calculation of the EMA3.
HigherTimeFrame = 60

// Chart timeframe:
IF Minute > 0 THEN
IF Day = Day[1] THEN
ChartTimeframe = Minute-Minute[1]
ELSIF Day <> Day[1] THEN
ChartTimeframe = Minute
ENDIF
ELSIF Minute = 0 THEN
IF Hour - Hour[1] = 1 THEN
ChartTimeframe = (60-Minute[1])
ELSIF Hour - Hour[1] > 1 THEN
ChartTimeframe = (Hour-Hour[1]) * 60
ENDIF
ENDIF

IF BarIndex > 0 AND BarIndex[1] > 0 AND ChartTimeFrame <> ChartTimeFrame[1] THEN
ChartTimeFrame = ChartTimeFrame[1]
ENDIF

//
StartHour = 7

// No. of Closes to go back for each higher timeframe:
ResHTF = (Hour-StartHour) MOD MAX((HigherTimeFrame/60),1)

IF ChartTimeFrame > 0 THEN
Calc1 = Minute MOD HigherTimeFrame
Calc2 = Minute MOD ChartTimeFrame
Pf1 = (ResHTF[1]*60) + (((Calc1-Calc2)/ChartTimeFrame)+1)[1]
ENDIF

if Pf1 = HigherTimeFrame/ChartTimeFrame then
result = close
else
result = 0
endif
htfclose = result

//Let's try EMA3 of the HigherTimeFrame (htfclose)
if Pf1 = HigherTimeFrame/ChartTimeFrame then
EMA3 = (htfclose+(htfclose[HigherTimeFrame/ChartTimeFrame]*0.5)+(htfclose[((HigherTimeFrame/ChartTimeFrame)*2)]*SQUARE(0.5)))/(1+0.5+Square(0.5))
endif

return EMA3
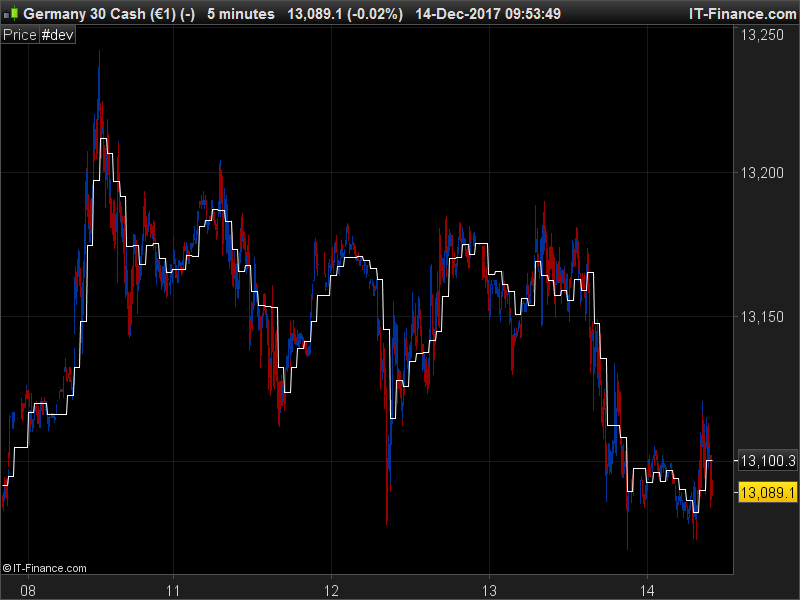
I don’t know if the EMA calculation is correct and accurate with the real superior timeframe EMA, but I fixed the way it is displayed, now the curve is continuous. Interesting code, thanks for sharing it 🙂
HigherTimeFrame = 60

// Chart timeframe:
IF Minute > 0 THEN
IF Day = Day[1] THEN
ChartTimeframe = Minute-Minute[1]
ELSIF Day <> Day[1] THEN
ChartTimeframe = Minute
ENDIF
ELSIF Minute = 0 THEN
IF Hour - Hour[1] = 1 THEN
ChartTimeframe = (60-Minute[1])
ELSIF Hour - Hour[1] > 1 THEN
ChartTimeframe = (Hour-Hour[1]) * 60
ENDIF
ENDIF

IF BarIndex > 0 AND BarIndex[1] > 0 AND ChartTimeFrame <> ChartTimeFrame[1] THEN
ChartTimeFrame = ChartTimeFrame[1]
ENDIF

//
StartHour = 7

// No. of Closes to go back for each higher timeframe:
ResHTF = (Hour-StartHour) MOD MAX((HigherTimeFrame/60),1)

IF ChartTimeFrame > 0 THEN
Calc1 = Minute MOD HigherTimeFrame
Calc2 = Minute MOD ChartTimeFrame
Pf1 = (ResHTF[1]*60) + (((Calc1-Calc2)/ChartTimeFrame)+1)[1]
ENDIF

if Pf1 = HigherTimeFrame/ChartTimeFrame then
result = close
else
result = result[1]
endif
htfclose = result

//Let's try EMA3 of the HigherTimeFrame (htfclose)
if Pf1 = HigherTimeFrame/ChartTimeFrame then
EMA3 = (htfclose+(htfclose[HigherTimeFrame/ChartTimeFrame]*0.5)+(htfclose[((HigherTimeFrame/ChartTimeFrame)*2)]*SQUARE(0.5)))/(1+0.5+Square(0.5))
endif

return EMA3