Hi All,
I was wondering if it is possible to replicate an indicator from TradingView.
It is called Nadaraya-Watson: Rational Quadratic Kernel (Non-Repainting). On the charts, it kind of looks like a regular Moving Average. But you can set the lines based on another timefrime
You can find more info and the code on TV
Thank you
Hi,
thanks. but that looks like the Envelope and not the Rational Quadratic Kernel (Non-Repainting), no?
Sorry, I recognised the name and gave the forum link assuming you were after the mid-line (the y2 variable of the return line), if what you’re after is not the same as this y2 then I don’t remember other Nadaraya-Watson code already made in the forum, Nicolas will assess whether it can be converted (and if yes will add it to the conversions list).
It is the same as the y2 line from the above code, apart that in that version the line takes color following another 2 period lag line crossing.
Added to the conversion list in order to get the same as this one.
Ok, so it is not possible to create the same indicator as I posted initially?
Yes it is possible, please be patient 😉
Done!
// © jdehorty
// @version=5

// A non-repainting implementation of Nadaraya-Watson Regression using a Rational Quadratic Kernel.

// Settings
once bullishR = 0
once bullishG = 250
once bullishB = 154
once bearishR = 255
once bearishG = 69
once bearishB = 0

src = customclose

// hh = Lookback Window, minval=3.0, tooltip='The number of bars used for the estimation. This is a sliding value that represents the most recent historical bars. Recommended range: 3-50

r = rr*0.25
//rr = Relative Weighting, step=0.25, Relative weighting of time frames. As this value approaches zero, the longer time frames will exert more influence on the estimation. As this value approaches infinity, the behavior of the Rational Quadratic Kernel will become identical to the Gaussian kernel. Recommended range: 0.25-25 => RR from 1 to 100

//xx = 25, Start Regression at Bar, Bar index on which to start regression. The first bars of a chart are often highly volatile, and omission of these initial bars often leads to a better overall fit. Recommended range: 5-25

//smoothColors = false, Smooth Colors, tooltip=Uses a crossover based mechanism to determine colors. This often results in less color transitions overall

//lag = 2, Lag for crossover detection. Lower values result in earlier crossovers. Recommended range: 1-2

//size = array.size(array.from(src)) // size of the data series
size = Min(Barindex,Maxlength)

// Further Reading:
// The Kernel Cookbook: Advice on Covariance functions. David Duvenaud. Published June 2014.
// Estimation of the bandwidth parameter in Nadaraya-Watson kernel non-parametric regression based on universal threshold level. Ali T, Heyam Abd Al-Majeed Hayawi, Botani I. Published February 26, 2021.

// Estimations
currentWeight = 0
cumulativeWeight = 0
for i = 0 to Size-xx-1 do
y = src[i]
w = POW(1+(POW(i,2)/(POW(hh,2)*2*r)),-r)
currentWeight = currentWeight + y*w
cumulativeWeight = cumulativeWeight + w
Next
yhat1 = currentWeight / cumulativeWeight

currentWeight = 0
cumulativeWeight = 0
for i = 0 to Size-xx-1 do
y = src[i]
w = POW(1+(POW(i,2)/(POW(hh-lag,2)*2*r)),-r)
currentWeight = currentWeight + y*w
cumulativeWeight = cumulativeWeight + w
Next
yhat2 = currentWeight / cumulativeWeight

// Rates of Change
wasBearish = yhat1[2] > yhat1[1]
wasBullish = yhat1[2] < yhat1[1]
isBearish = yhat1[1] > yhat1
isBullish = yhat1[1] < yhat1
isBearishChange = isBearish and wasBullish
isBullishChange = isBullish and wasBearish

// Crossovers
isBullishCross = yhat2 crosses over yhat1
isBearishCross = yhat2 crosses under yhat1
isBullishSmooth = yhat2 > yhat1
isBearishSmooth = yhat2 < yhat1

// Colors

If isBullishSmooth then
colorByCrossR = bullishR
colorByCrossG = bullishG
colorByCrossB = bullishB
Else
colorByCrossR = bearishR
colorByCrossG = bearishG
colorByCrossB = bearishB
Endif

If isBullish then
colorByRateR = bullishR
colorByRateG = bullishG
colorByRateB = bullishB
Else
colorByRateR = bearishR
colorByRateG = bearishG
colorByRateB = bearishB
Endif

If smoothColors then
R = colorByCrossR
G = colorByCrossG
B = colorByCrossB
Else
R = colorByRateR
G = colorByRateG
B = colorByRateB
Endif

// Alert Variables
If smoothColors then
alertBullish = isBearishCross
Else
alertBullish = isBearishChange
Endif

If smoothColors then
alertBearish = isBullishCross
Else
alertBearish = isBullishChange
Endif

// Alerts for Color Changes
//alertcondition(condition=alertBullish, title='Bearish Color Change', message='Nadaraya-Watson: {{ticker}} ({{interval}}) turned Bearish ▼')
//alertcondition(condition=alertBearish, title='Bullish Color Change', message='Nadaraya-Watson: {{ticker}} ({{interval}}) turned Bullish ▲')

// Non-Displayed Plot Outputs (i.e., for use in other indicators)
//plot(alertBearish ? -1 : alertBullish ? 1 : 0, "Alert Stream", display=display.none)

Return yhat1 as "Rational Quadratic Kernel Estimate" style(line,4) coloured(R,G,B,255)
Haha ok will do. Thank you!
Oh wow, many thanks. Will try it over the weekend.
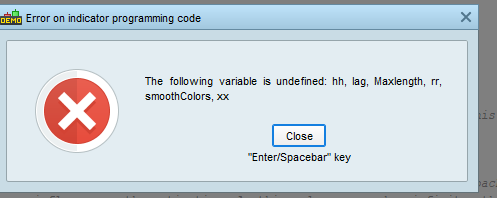
I get this error message. On which rows am I suppose to add values?
sorry, really new to coding
thank you
 JS
JSParticipant
Veteran
Hi @Harem
Download the itf -file and import the itf-file under indicators…
Now you have the complete code including the parameters…
(So, don’t copy the code from the forum but download the itf-file)
much appreciated. Thank you
Hi,
sorry, one more question. Do I have to have the maxlength parameter? or is there a default nr for that?
I added Maxlength because otherwise the indicator is very slow.
I just translate the original code (without improving it to be faster, which is possible) and it seems it uses all barindex for calculation (which is not relevant too because it does not change the result after 200 or 300 bars).
That is why i added Maxlength (too lazzy for improving the code)
But you can change 400 to 2000 or more if you want, you will notice no change in the result exept more time of calculation
ps : Lamaille is me