Hello all, its been a while since I’ve last posted a 3 page long post about whatever is on my mind, so i figured it was time for another one. This post is based only on my own experiences, research and my own algorithms.
I thought I’d post another long post about something that has taken up (too) much of my time the past years. The topic is going to be about creating robust portfolios of strategies and how to manage the risk of each algorithm, combined into 1 portfolio. Im going to assume that if youre reading this you already have a couple of algorithms or maybe even 10+ running, if so im guessing questions regarding this topic has been hovering in your head also. Sadly however, I do not pocess the recipe for a perfect portfolio, but I have been running 10+ algorithms for a few years now and lessons have been learned, some the hard way. Before i start i also want to say that most of my algorithms are Long only. I got 15m, 30m, 1h, 2h, daily timeframes going on. My main markets are Dax, US tech 100, wall st, us500. The majority is momentum algorithms, but I also got some mean reverting algorithms.
When i first started with algorithmic trading I was very fixated on the portfolio part of it. I kind of knew that with enough time spent, I would be able to create profitable algorithms, but how should I put together systems to create a portfolio with as much diversification as possible? And how diversified are you really, when shit hits the fan?
My portfolio has truly been tested throughout the covid crisis and all the spikes and volatility leading up to it as well. I started my journey in 2016-2017 but it wasnt until february 2018 that i turned “everything” on/live. Just days later a huge drop in most stock markets happened and they went down roughly -10 to -15%. Before I knew it iIwas in a huge drawdown. There had basicly been no volatility since 2016 -> 2018 and suddenly it was right in my face. Panic set in and I realized that when “shit hits the fan” i wasnt diversified at all. My momentum algos got faked out at the tops right, before the fall happened and so they went into drawdown. At the same time my mean reverting algorithms tried to pick bottoms when in facts there was no bottom for another -10% down.. I realized that I had been blinded by greed and potential profits, that I had accepted way more risk than I was comfortable with. I turned off most of the algorithms and got to work. Creating new filters, looking into high volatility markets and meassures I could get in place to help stop the losses.
Now before i continue on my journey it must be said that even tho all my algorithms at that time was in the red, in the long term they all have turned green. But being red day after day, week after week, even month after month is extremely hard. You want to do anything to stop the pain that is inflicted on your account, even turning off your algorithms.
So with most algorithms turned off, i started to re-evaluate how I should construct my portfolio. I extracted the backtesting results and pasted it into excel, I did this for every strategy. I could then start running deeper analysis on each algorithm and start comparing one algo perfomance to another. I also started to look more deeply into each algorithms winning/loss per month/quarter/year, again comparing them to each other. I also researched how un-correlated (or should i say correlated?) momentum and mean reverting algorithms actually are (my algorithms at least). So here are a few of my key points when constructing a portfolio:
- Momentum algorithms tend to go into drawdown when new highs dont result in new trends/swing higher, which typicly happens after a big trend/swing up, as the market pauses/goes into consolidation. If the market just dips down a little then swings up again, your mean reverting algorithms should make up for the losses from the momentum algorithms.
- If however the market turns sharply down after reaching new highs then you will most likely experience a drawdown in both your mean reverting and your momemtun algorithms. This is when your tail-losses/biggest losses occur and this is what you need to be the most afraid of.
- It really gets the darkest before it turns brighter, do not turn off algorithms just because they are in a drawdown. My biggest losses have all been accompanied by my biggest winners. When investing long term buy’n’hold, if you miss out on the top 10 days your investment will suffer greatly, same goes for algorithms in my experience. Make sure your portfolio makes money, even if its small money, when your biggest losses happen in your backtests. This will help your mental game alot.
- Exporting backtest data into excel to study the graphs of different algos can give much needed help and clues as to how 2 different algorithms work together.
- Treat each algorithm as a seperate investing object. Look at the maximum drawdown from the backtest, add a little bit to that and put that max drawdown together with all the other max drawdowns in your portfolio. If they all hit their max drawdowns at the same time, would it ruin your account? If the answer is yes, you need to make DAMN SURE that they will never hit at the same time. If they start going into huge drawdowns at the same time its alot easier to turn off the algorithms which could be a disaster.
- You can create sub-portfolios such as a mix of your most un-correlated algorithms running on a seperate account to keep the drawdown at a minimum, allowing you to buy even more contracts on the same strategies without experiencing the potential drawdown of running more strategies in that portfolio. Personally i havnt gotten this far just yet, but im looking into it as we speak.
- For me, looking at the average monthly expected return from 1 algorithm is not as helpful as looking at quarterly results. You have to expect drawdowns on all algorithms in 1 month, unless you have some very good short term algorithms at least. Quarterly numbers even out the numbers more, and this makes things easier when comparing the different backtests of different algorithms.
- What is the risk of all the algorithms going into a deep drawdown at the same time? For example I run mostly Long only in stock indices. And as we all know, most stock indicies are very correlated. You would therefore assume that if “all markets” are down -0.5% you would most likely be down on your total equity, but this is not always the case. A 15 min algorithm might spot an amazing trade during the night/day. Even if the market ends -0.5% it dosnt mean it couldnt have been +1% at some point. I might have lost 2-3 trades on the 1h algorithms, but i might have made back all those losses on the 15-30m algorithms. How your algorithm trades and at what timeframe it trades might have a huge impact on your portfolio when adding the algorithm. Dont assume that a Long only momentum 15m algorithm and a Long only momentum 1h algorithm are 100% correlated.
- Even running an algorithm that produces a net 0 in the long run could theorieticly be worth running as long as it covers its own costs of trading in the long run and can help diversify your portfolio.
So with all this and more, I jumped into the portfolio game once again in october 2018. Just days after i pressed play, all markets crashed like they havnt crashed since 2008. All stock markets was down roughly -20% and my portfolio was instantly in another huge drawdown. However this time it was alot better than the last time. I had learned from my mistakes, i had adjusted the contract sizes of each algorithm to fit my portfolio better. I was bleeding money the rest of 2018, but then at christmas times santa claus blesse the stock market with a face ripping rally going straight up non stop for months, making all that bleeding worth it. I had held through a huge crash and a huge rally. Even tho i had lost money at the end of 2018 it felt good.
2019 comes around, the markets are volatile compared to 2016-2018. Obviously nobody knows yet that the corona virus is coming. My results was sadly not as good as i had hoped. Turned out that I was running some forex algorithms that was not performing as the backtest said they should be. The edge was too small, the slippage and price to play was just too high and those strategies ended up bleeding my account. Luckily I was doing very well in the indicies but overall I wasnt making alot of money. I turned off the bad strategies and my equity started to climb. I adjusted some of my best algorithms contract sizes up, at the same time i adjusted up the size of the algorithms that was most un-correlated to those strategies, to even things out.
Things was looking great, but then covid came and boy oh boy.. The markets dropped like nothing I had ever seen before. it would be roughly -30% down before markets turned up again, and I would have loved to say that I was perfect and let my algorithms run, but in the heat of the moment, at the very last drop, i turned off 2 algorithms that had lost the most, and of course, 1 week later one of these algorithms would have won back all those losses and then some if i had just kept it going. This very expensive lesson however has been proven to be worth its cost.
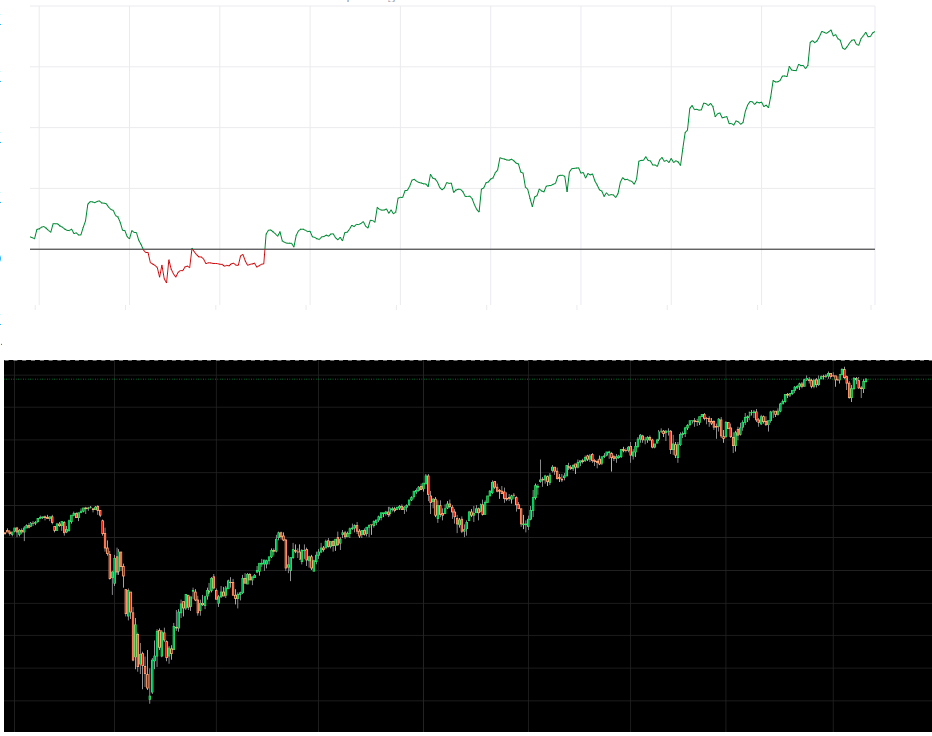
Finally I have included a picture of all my trading (my whole portfolio from 2020-2021), including the corona-dip, and I have compared it to the SP500. What I want to show is that by using diversification you will OVERPERFORM when the market is rough and bad, but you will UNDERPERFORM when the market is going straight up. And by my own standards I would argue that if your portfolio does this then you are on the correct path! You can now beat the market by leveraging up (depending on how much you over/underperform vs the market obviously).
And you can sadly see the huge coronavirus drop.. that dip would have just been only 50% of its size, had i not turned off 2 of the algorithms. Fear got to me, hopefully wont do something that stupid ever again.
Thanks for reading about my journey and I hope it can bring you either tips and tricks you can use or at least the knowledge that there are others out there struggling just like you are.
Lets continue the climb!